Microvast Holdings, Inc.
MVST NASDAQ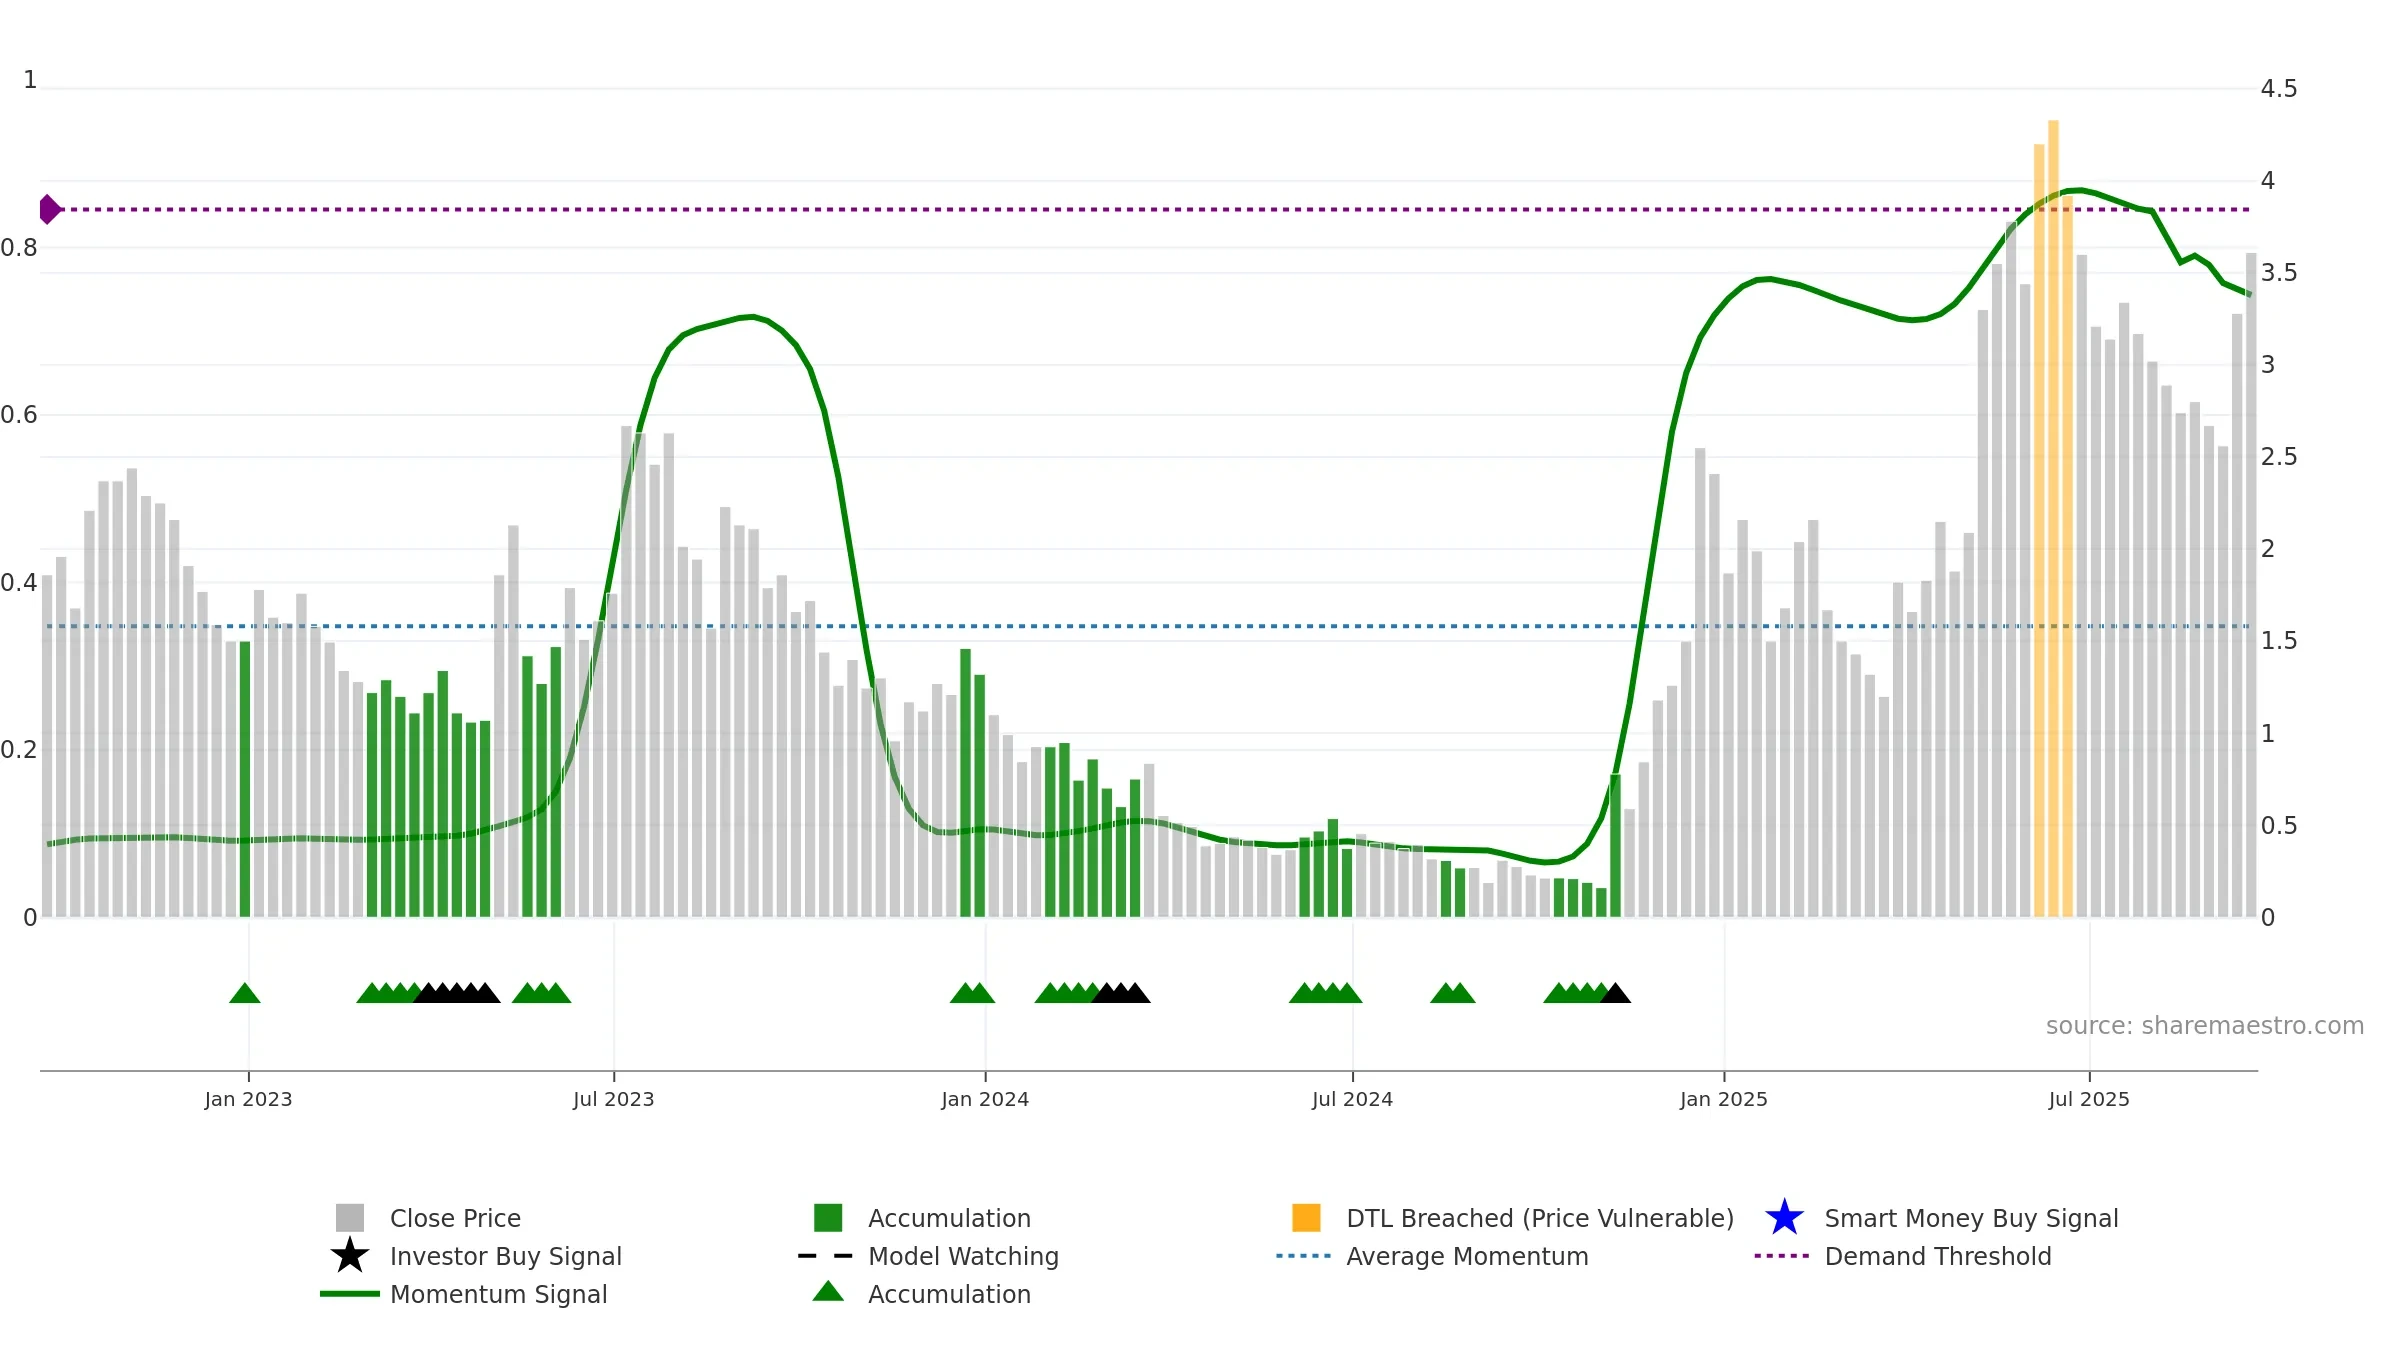
Weekly Summary
Microvast Holdings, Inc. closed at 3.6100 (4.03% WoW) . Data window ends Fri, 19 Sep 2025.
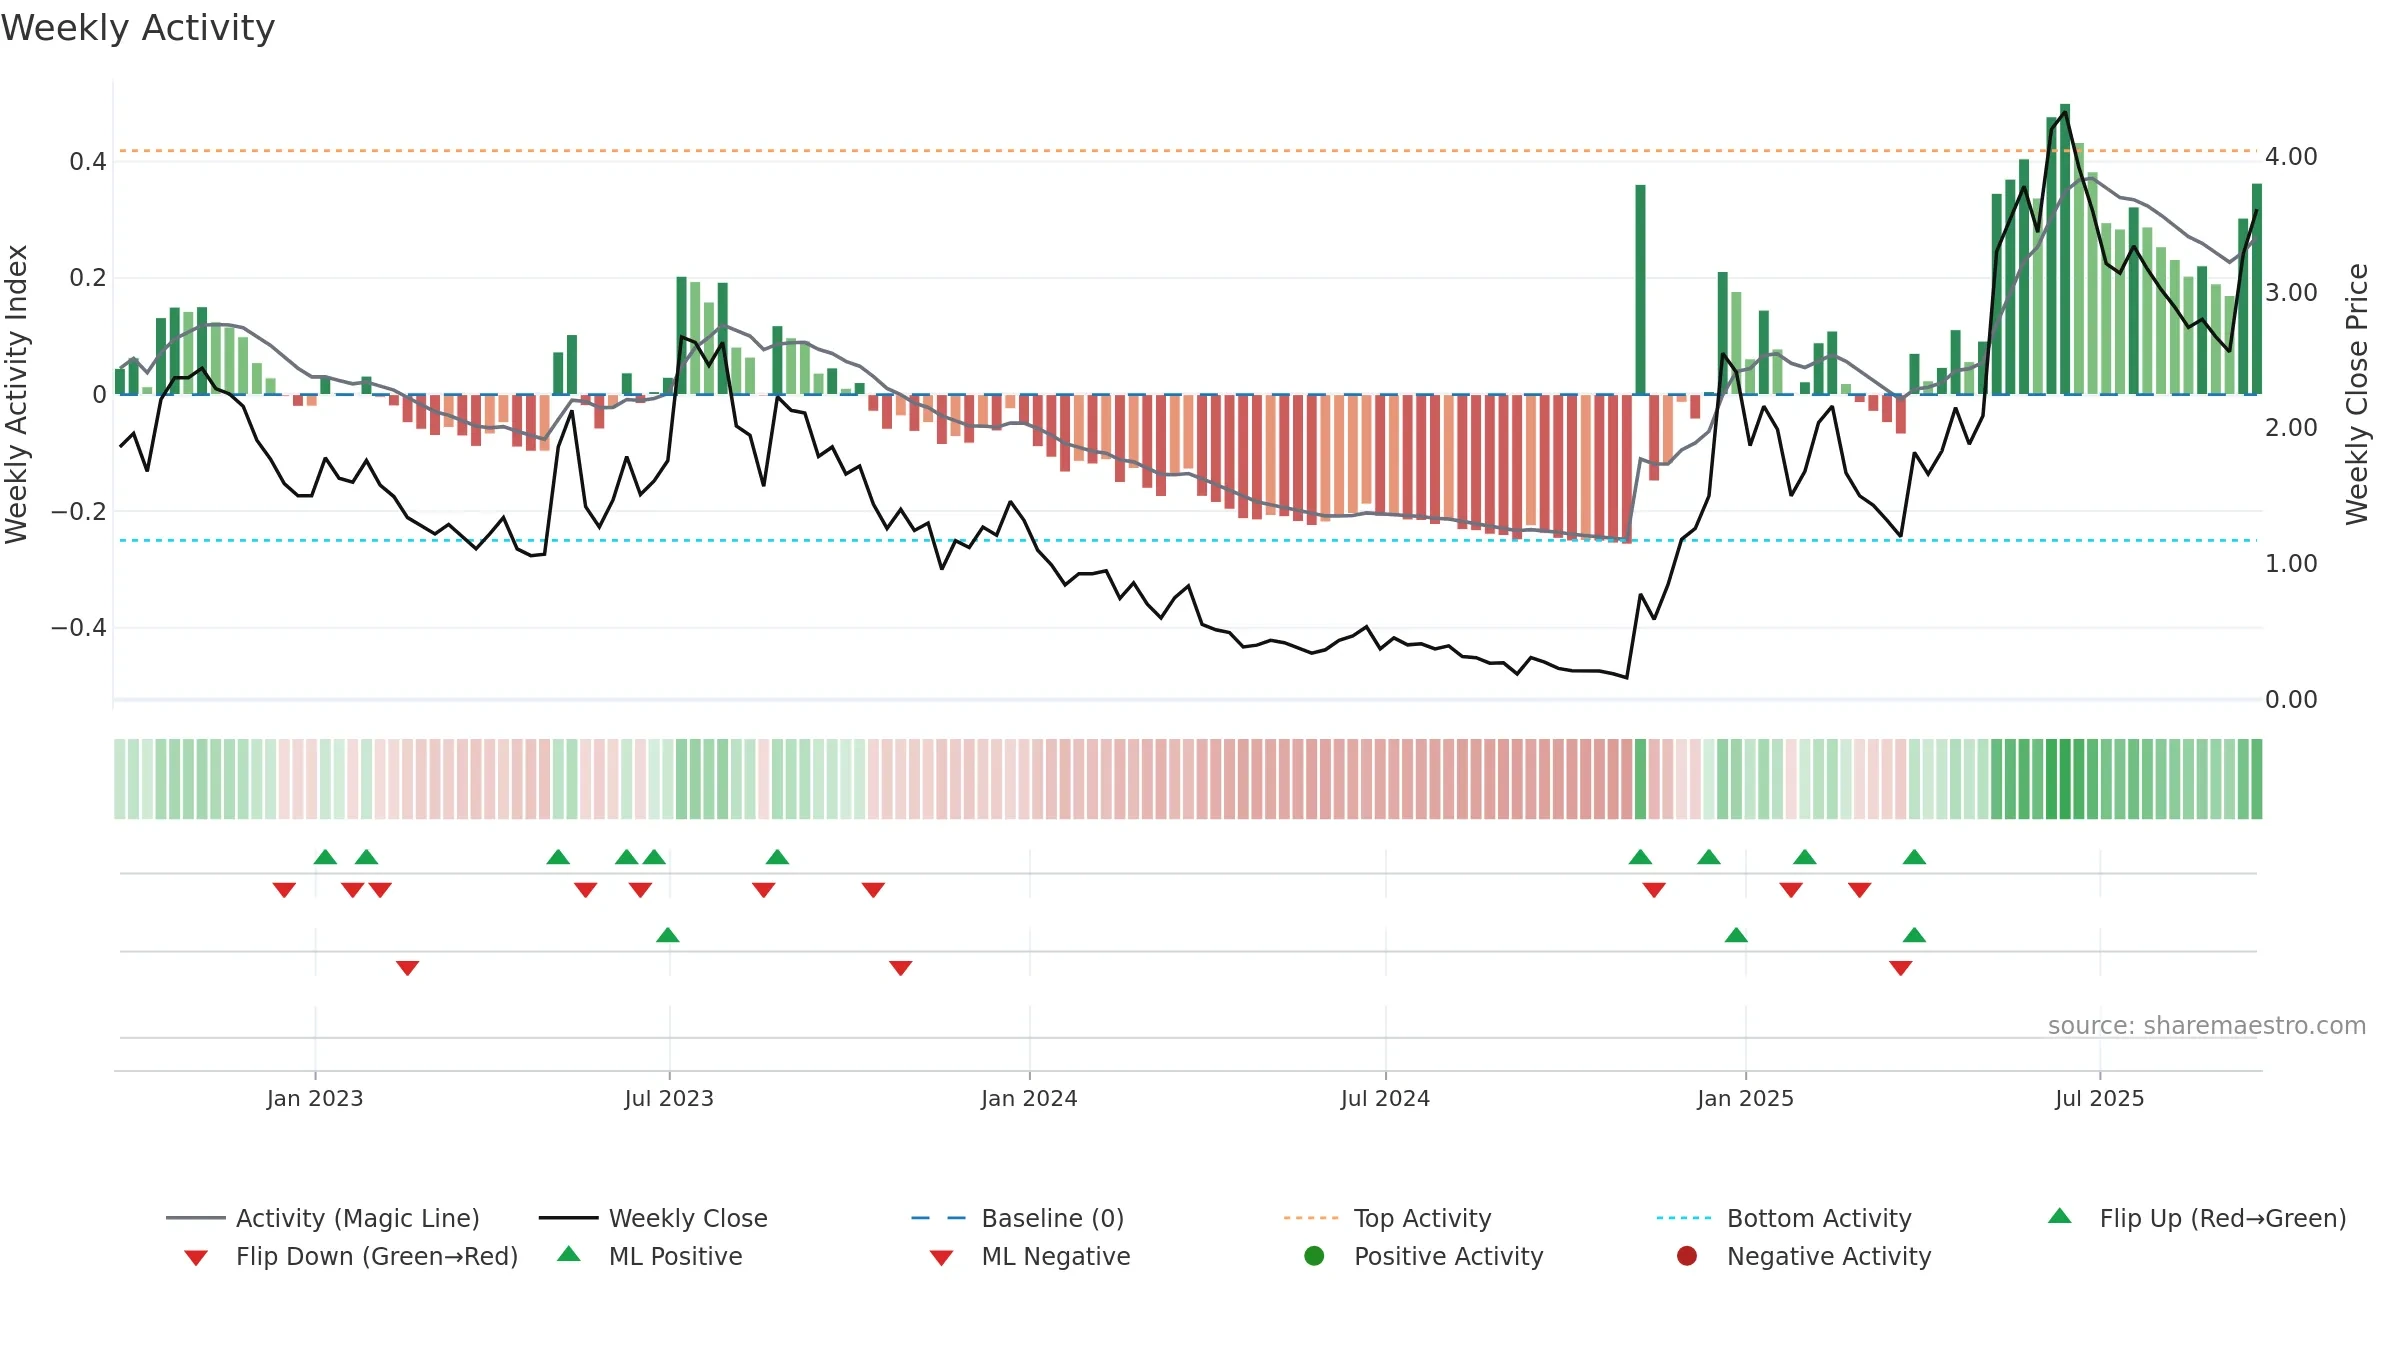
How to read this — Price slope is upward, indicating persistent buying over the window. Elevated weekly volatility increases whipsaw risk. Volume and price are moving in the same direction — a constructive confirmation. Returns are positively correlated with volume — strength tends to arrive on higher activity. Fresh short-term crossover improves near-term tone. Price holds above key averages, indicating constructive participation.
Up-slope supports buying interest; pullbacks may be contained if activity stays firm.
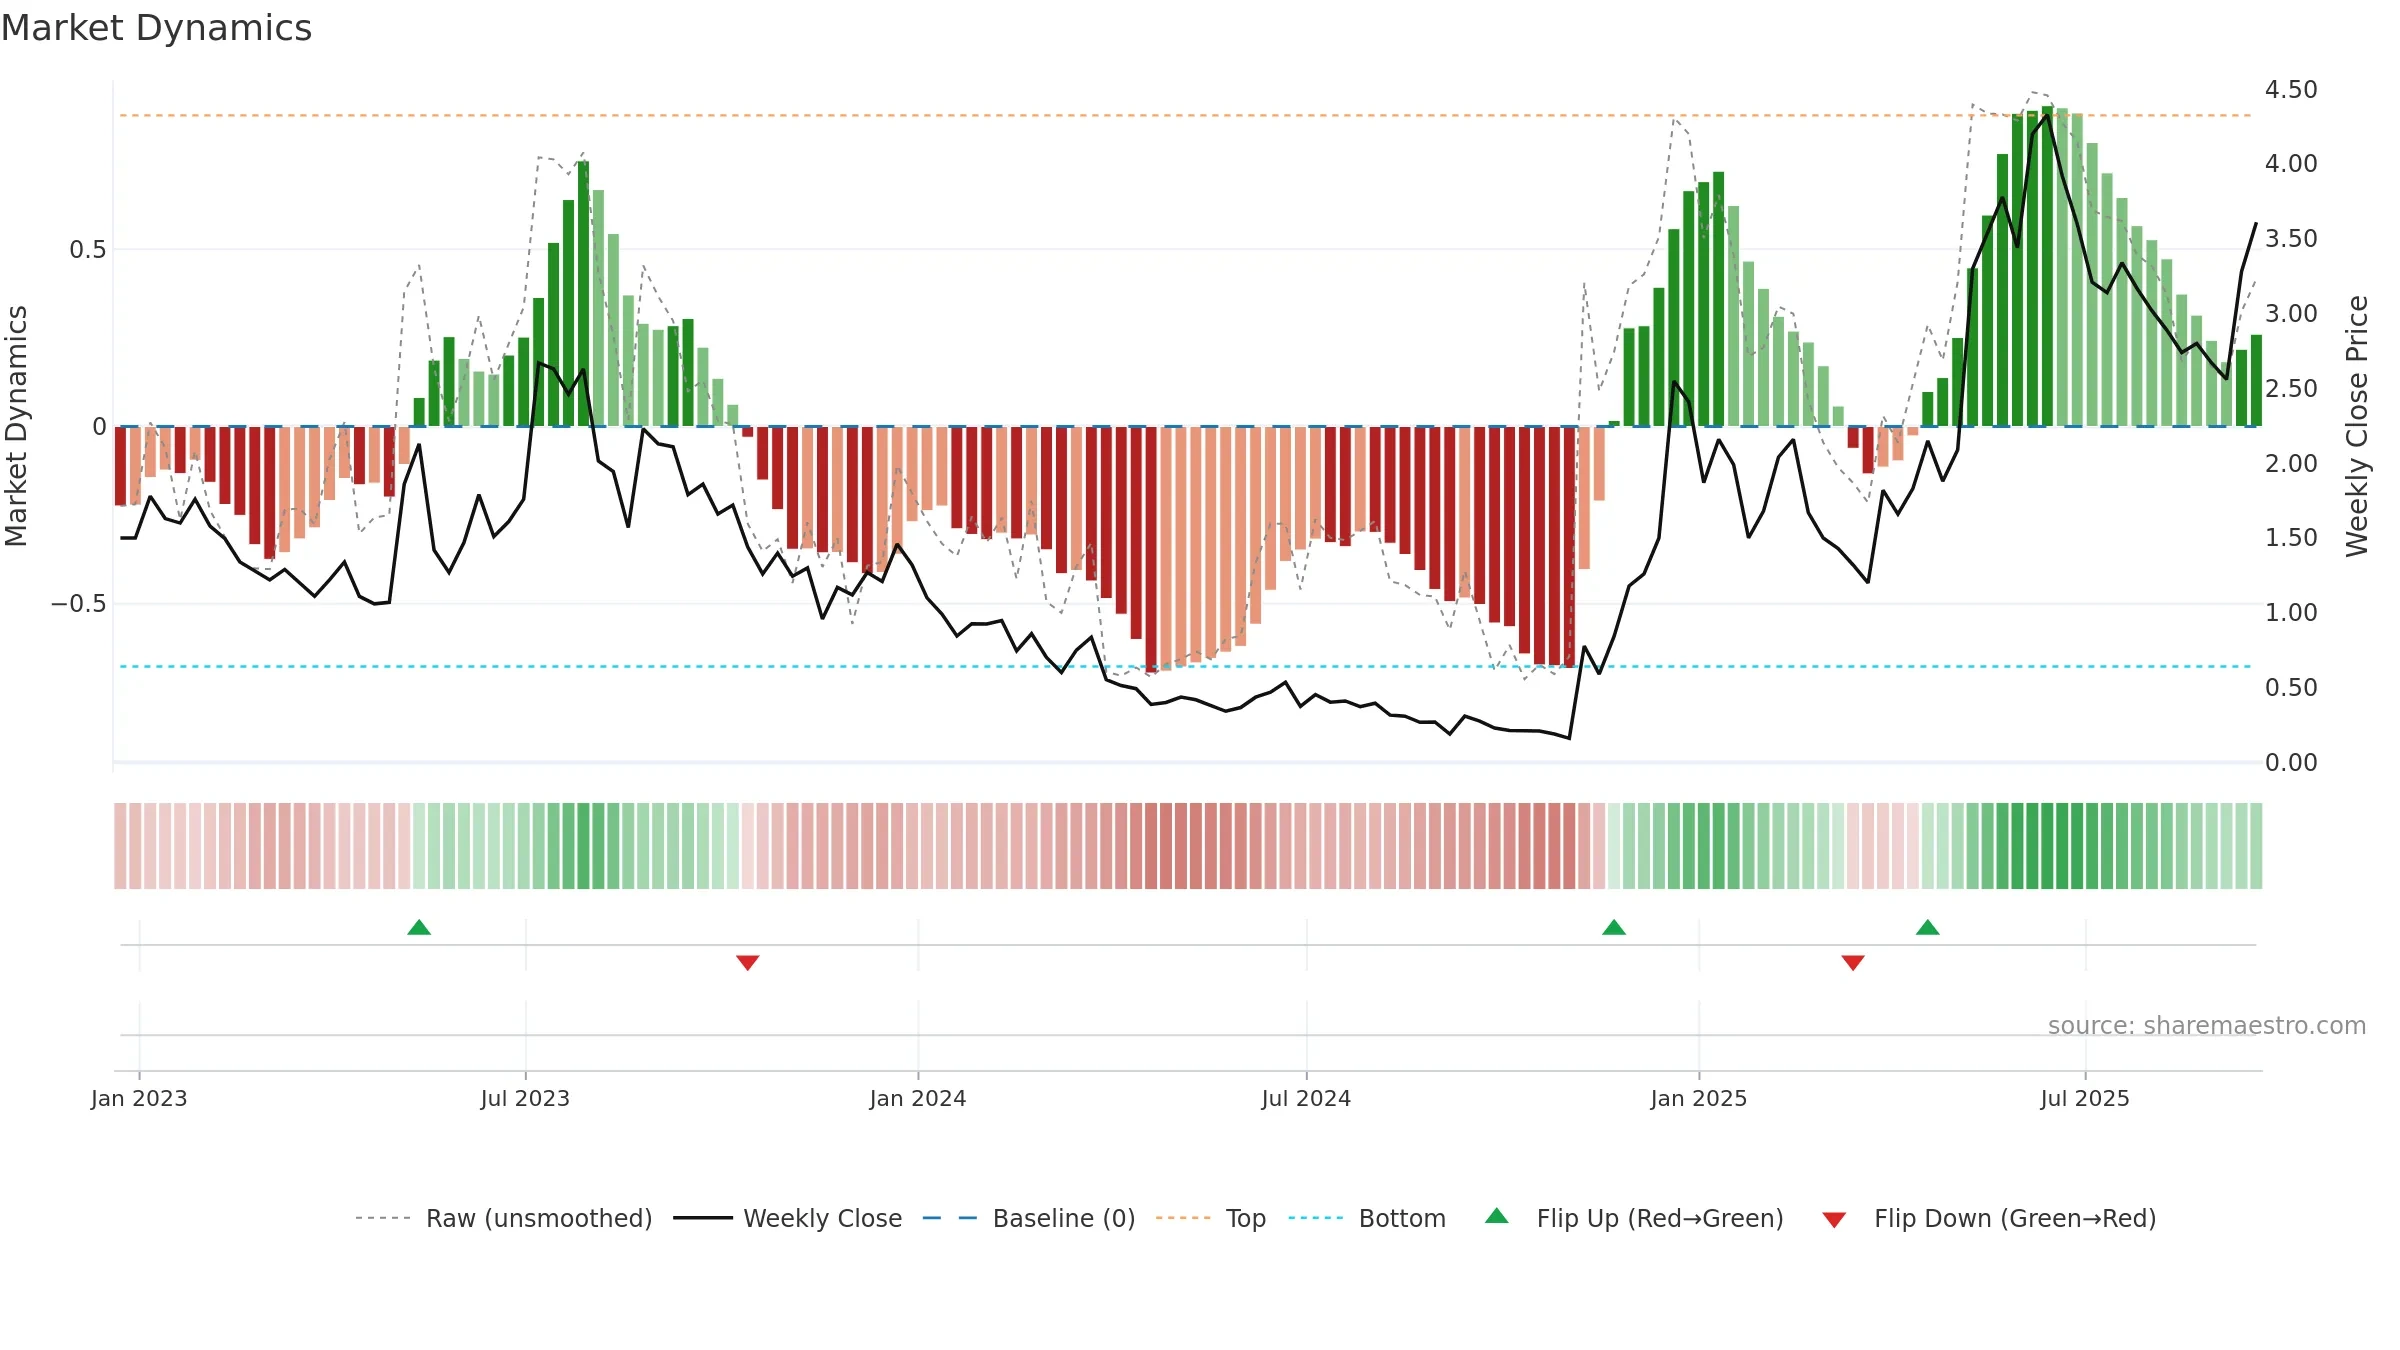
Gauge maps the trend signal to a 0–100 scale.
How to read this — Gauge is elevated but momentum is rolling over; topping risk is rising.
Stay alert: protect gains or seek confirmation before adding risk.

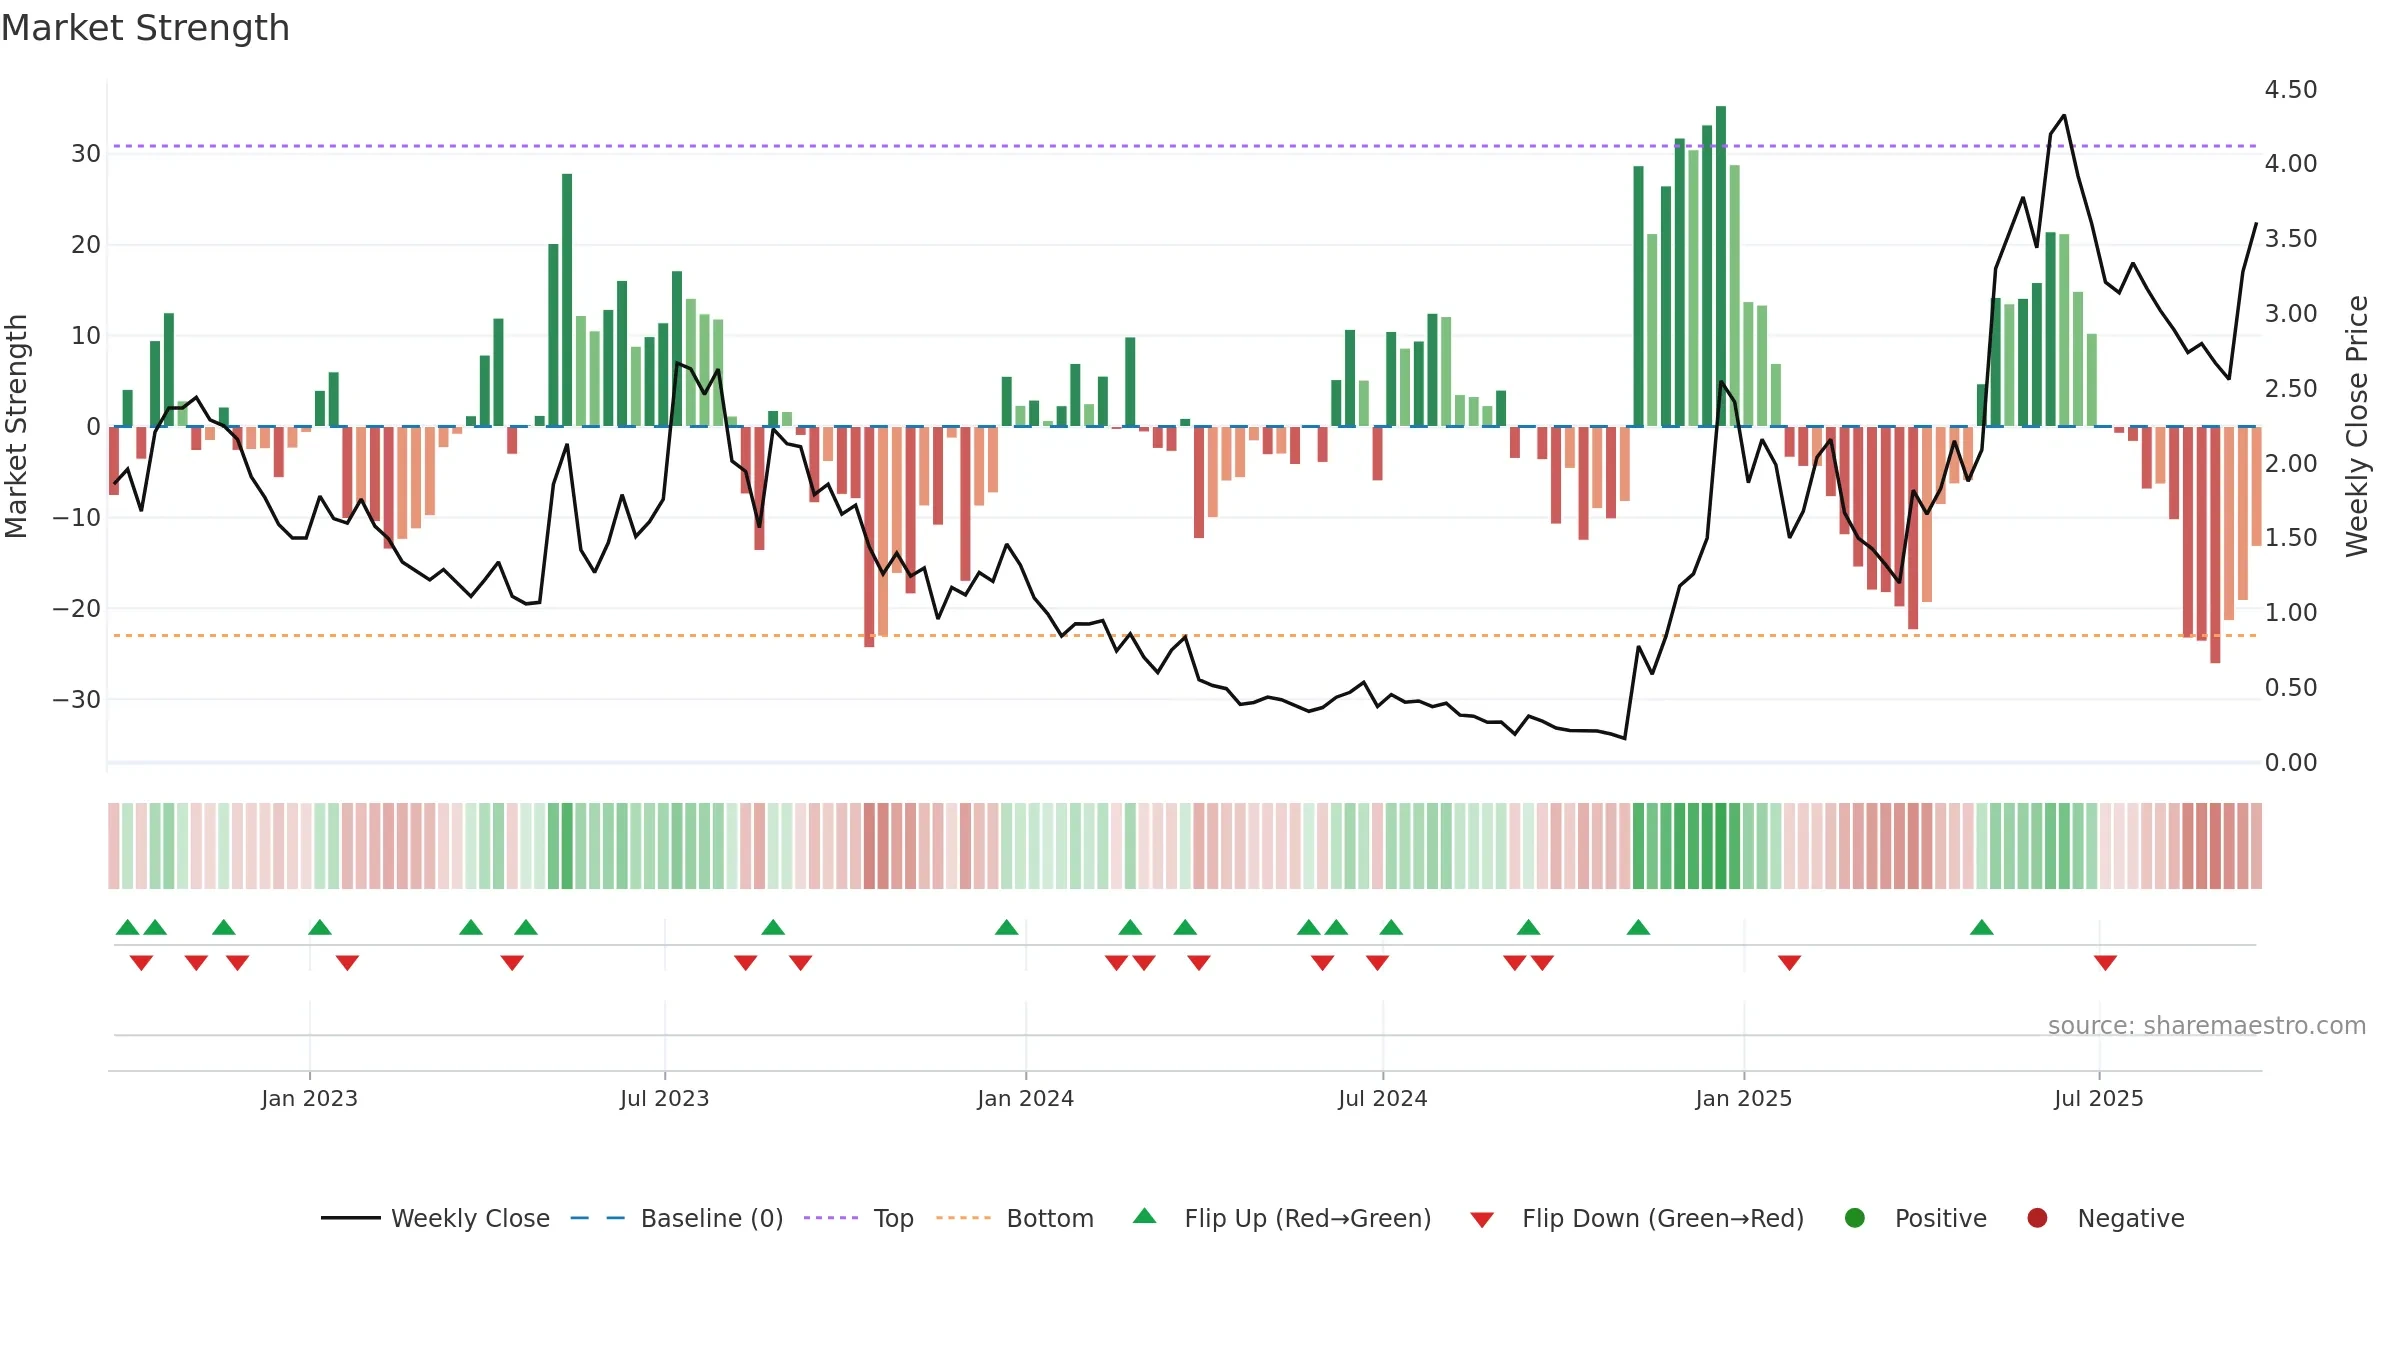
Relative strength is Positive
(> 0%, outperforming).
Latest MRS: 19.78% (week ending Fri, 19 Sep 2025).
Slope: Rising over 8w.
Notes:
- Holding above the zero line indicates relative bid.
- MRS slope rising over ~8 weeks.
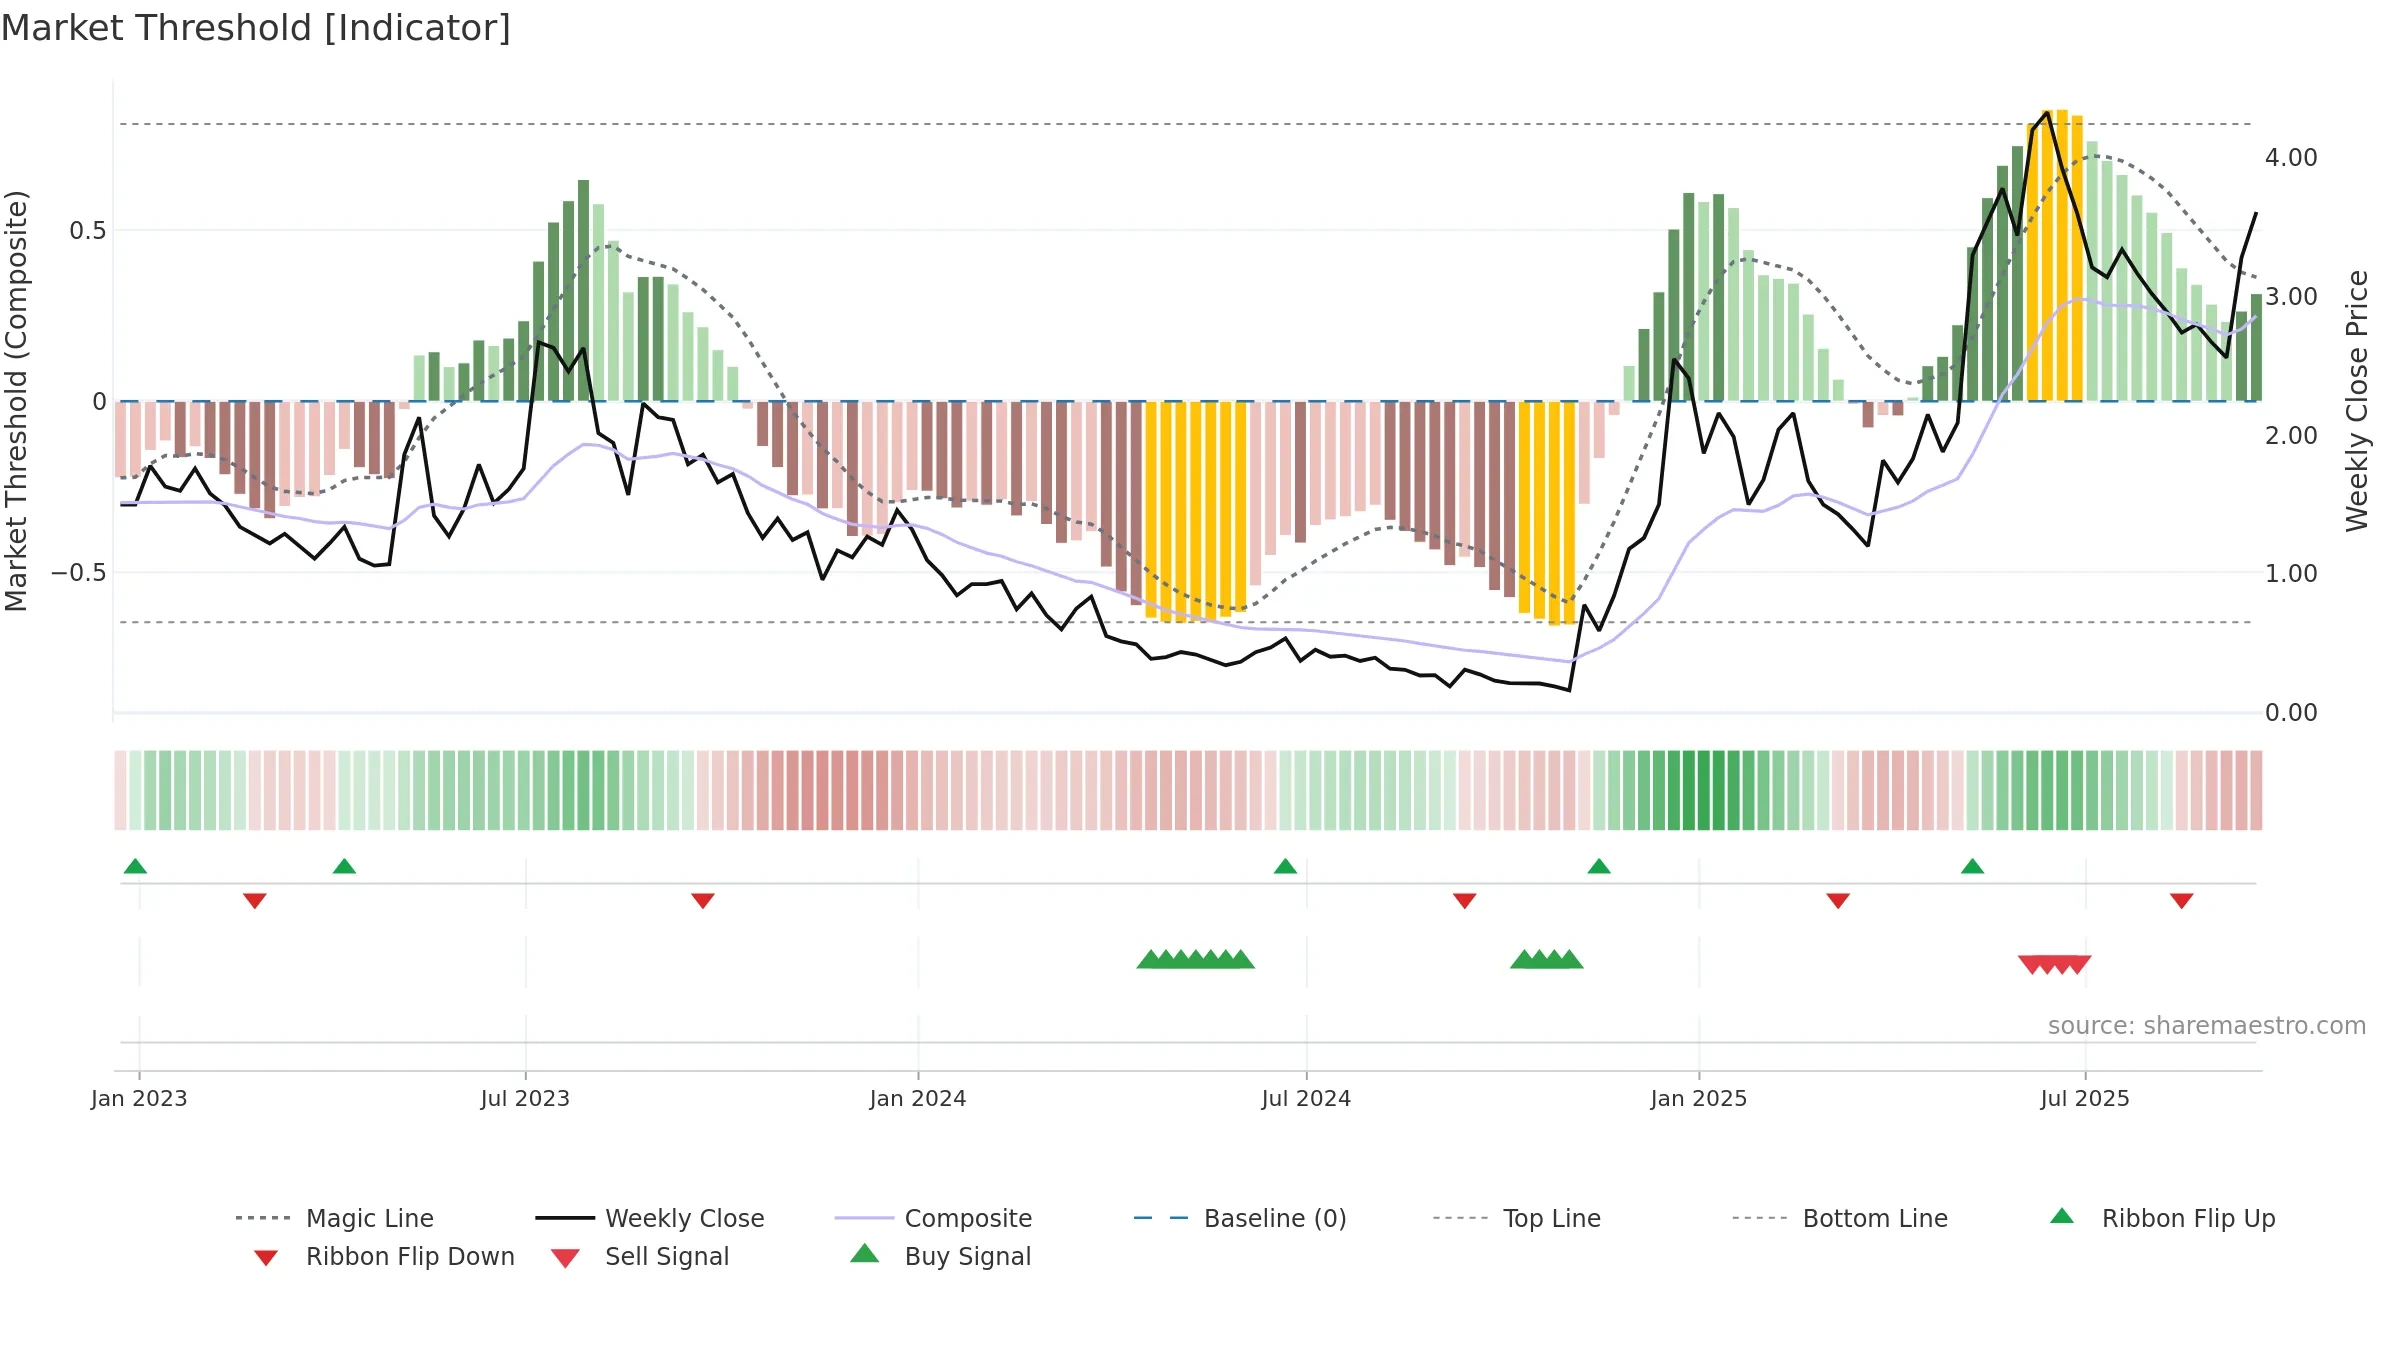
Conclusion
Negative setup. ★★⯪☆☆ confidence. Trend: Uptrend at Risk · 19.54% over window · vol 6.27% · liquidity convergence · posture above · RS outperforming · leaning negative
- Price holds above 8–26 week averages
- Liquidity confirms the price trend
- Solid multi-week performance
- Mansfield RS: outperforming & rising
- High level but momentum rolling over (topping risk)
- Momentum is weak/falling
- High return volatility raises whipsaw risk
Why: Price window 19.54% over w. Close is 10.06% above the prior-window high. Return volatility 6.27%. Volume trend rising. Liquidity convergence with price. Trend state uptrend at risk. 4–8w crossover bullish. Baseline deviation 1.34% (widening). Momentum neutral and falling.
Tip: Most metrics include a hover tooltip where they appear in the report.