Noah Holdings Limited
NOAH NYSE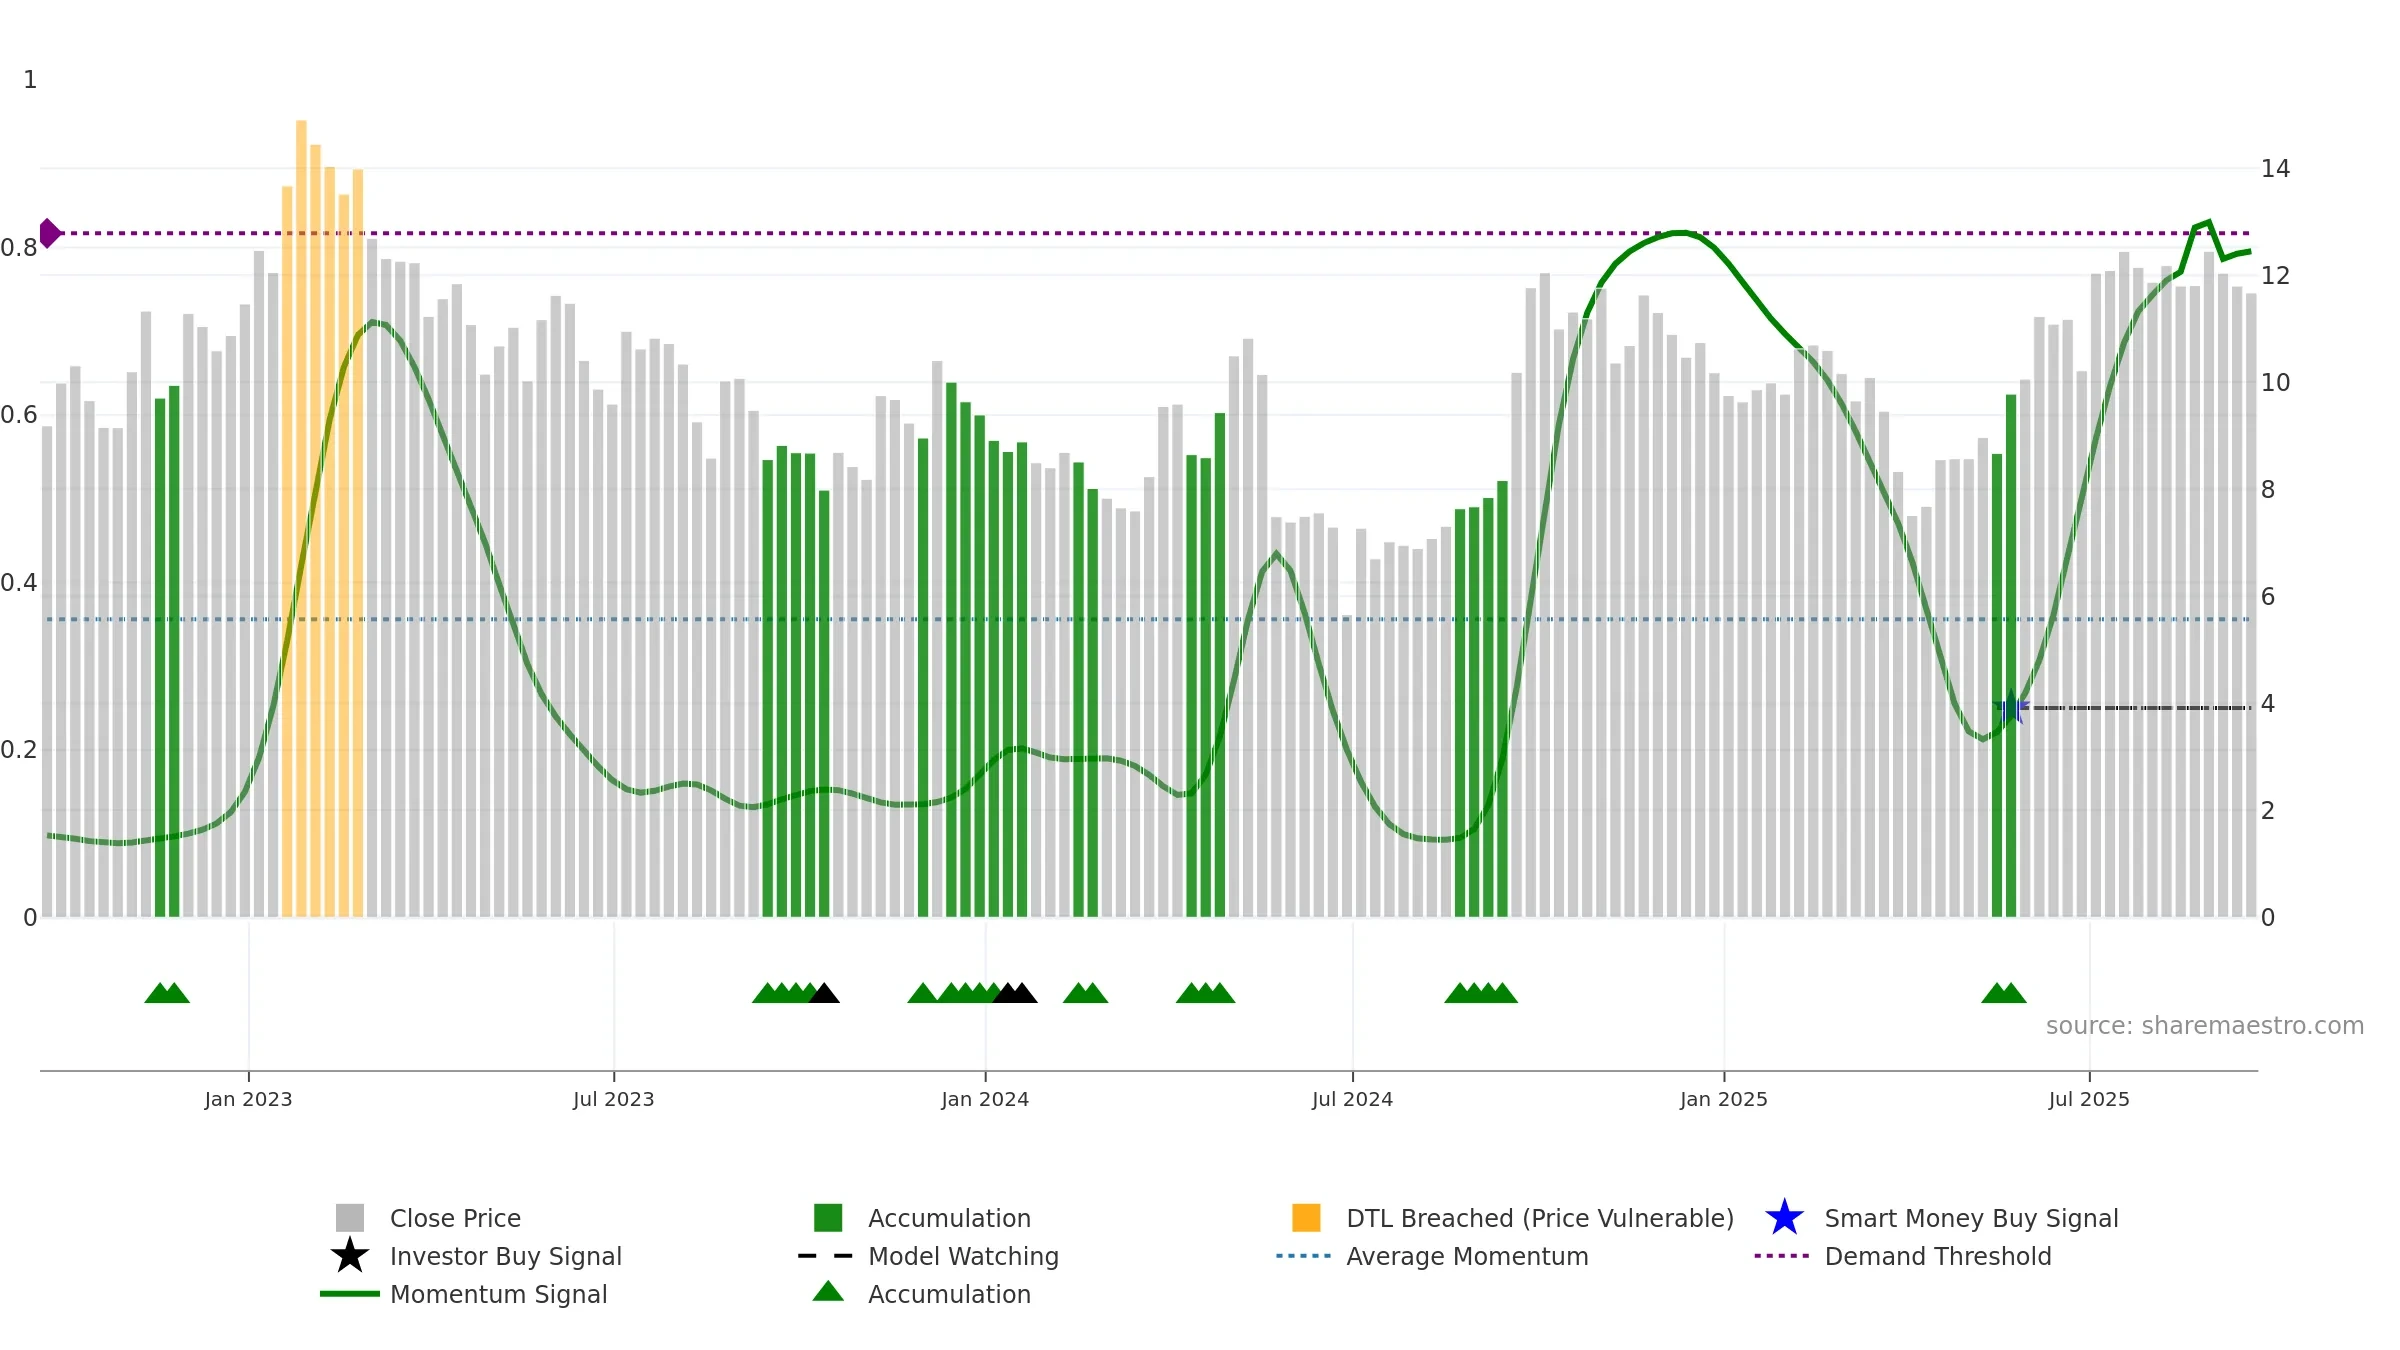
Weekly Summary
Noah Holdings Limited closed at 11.6700 (-1.19% WoW) . Data window ends Fri, 19 Sep 2025.
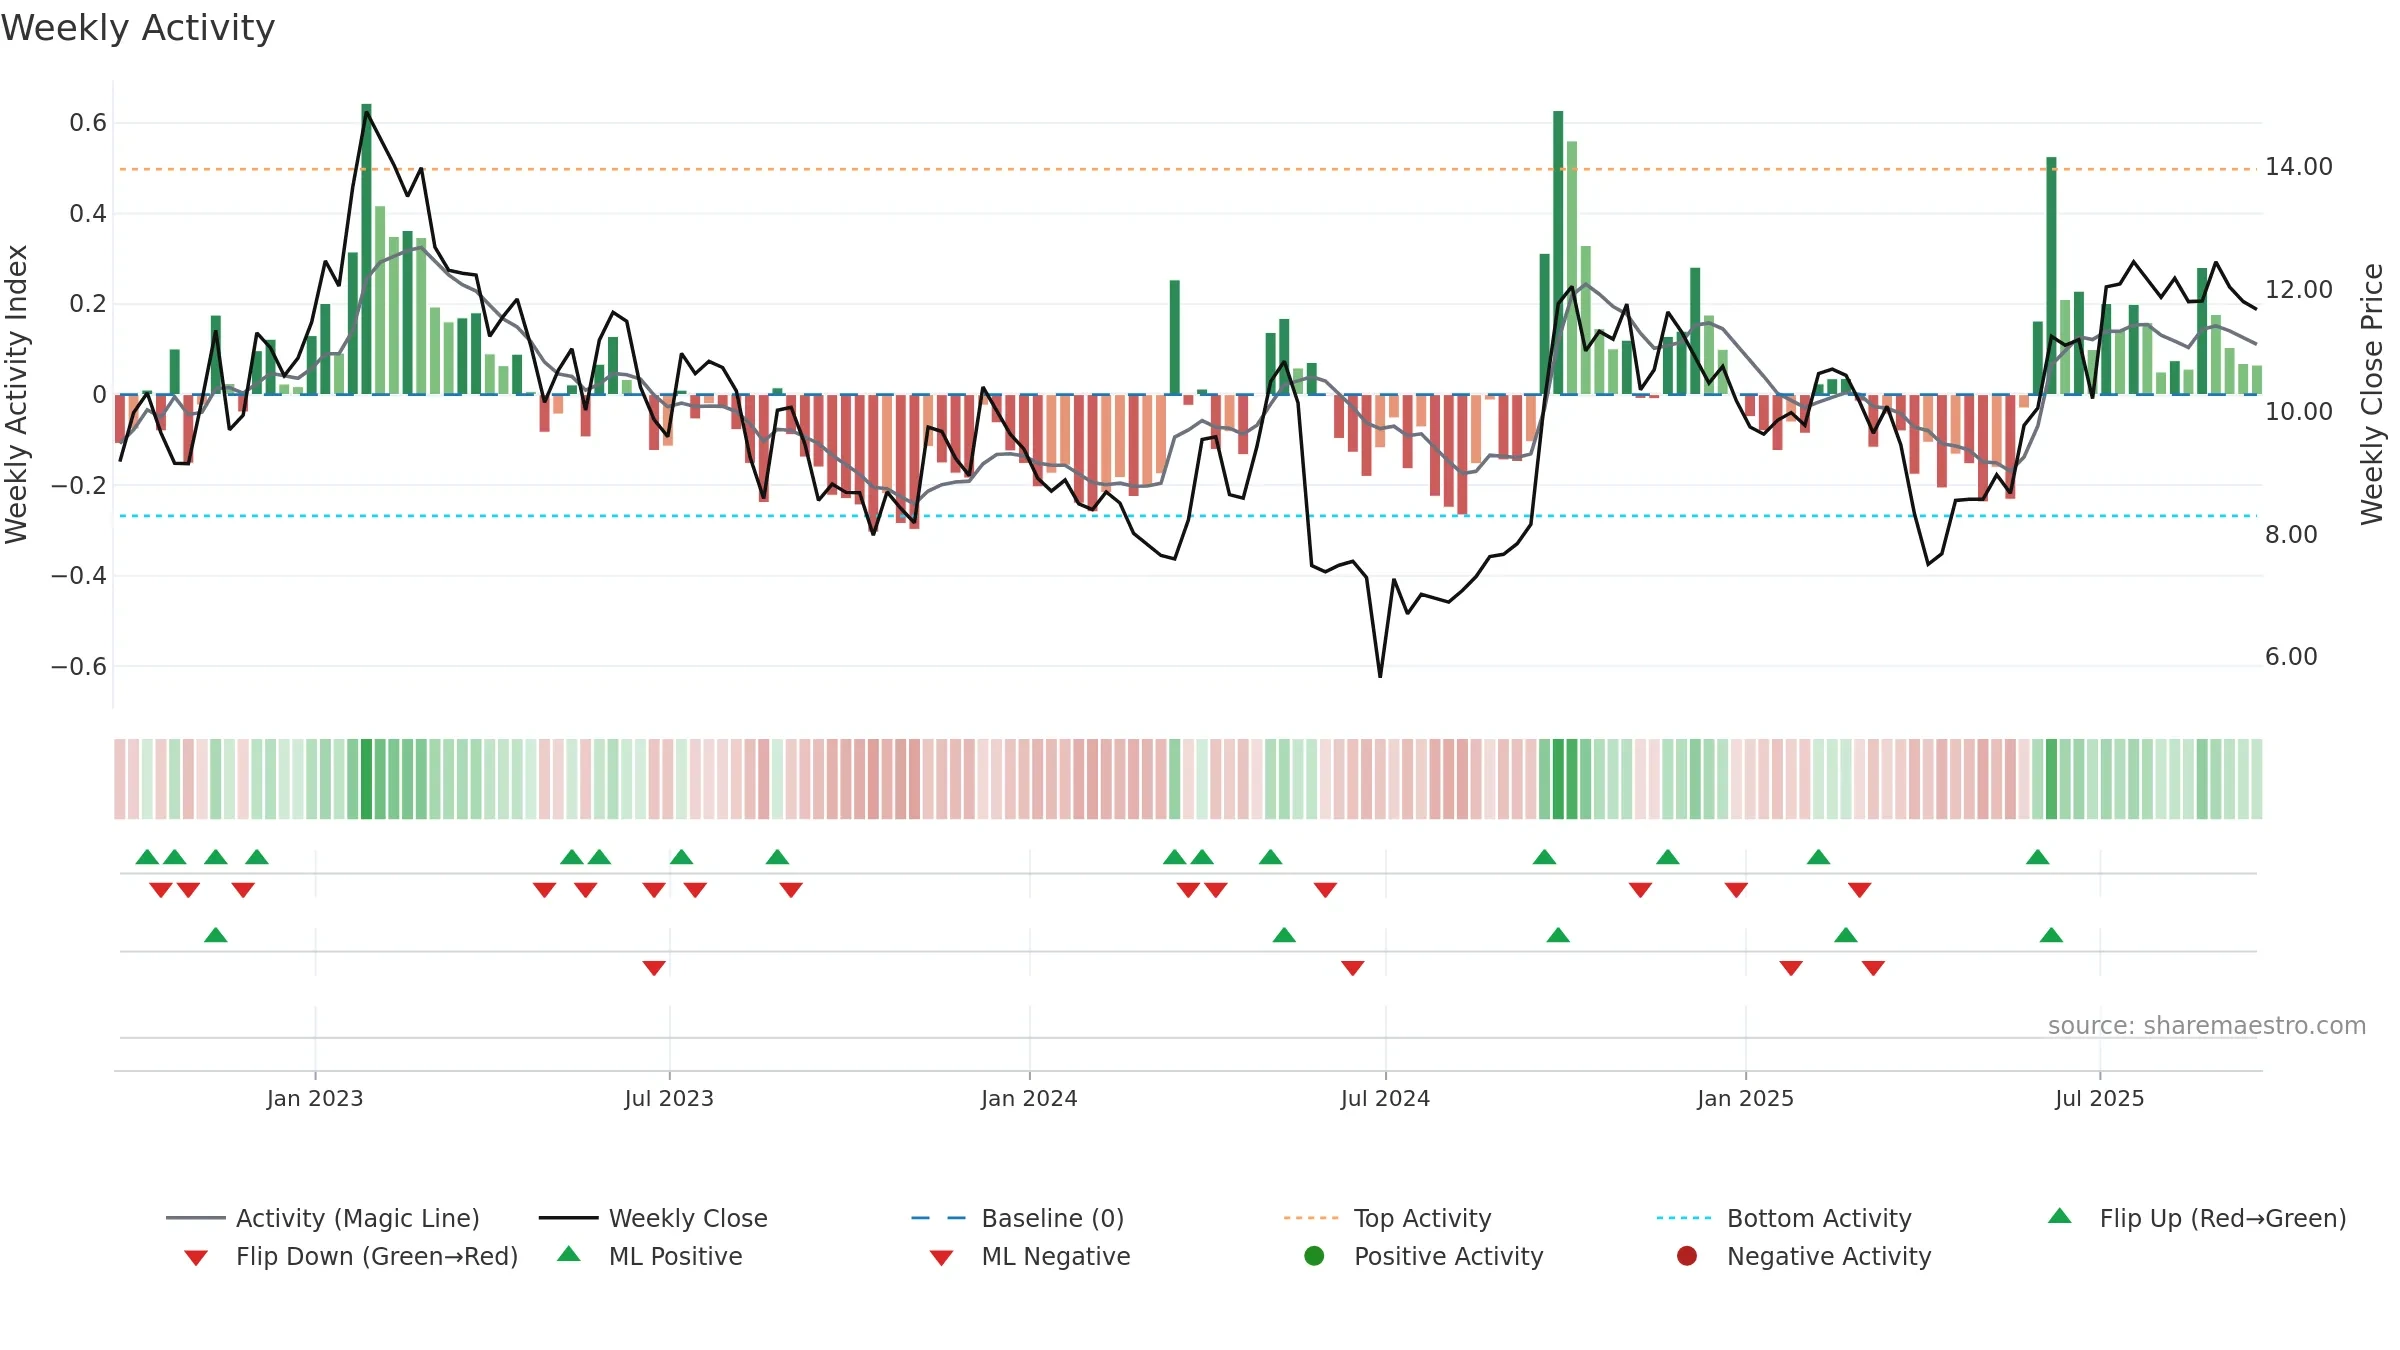
How to read this — Price slope is downward, indicating persistent supply pressure. Volume trend diverges from price — watch for fatigue or rotation. Constructive MA stack supports the up-drift; pullbacks may find support at the 8–13 week region.
Down-slope argues for patience; rallies can fade sooner unless participation improves. Because liquidity isn’t confirming, prefer evidence of fresh demand before chasing moves.
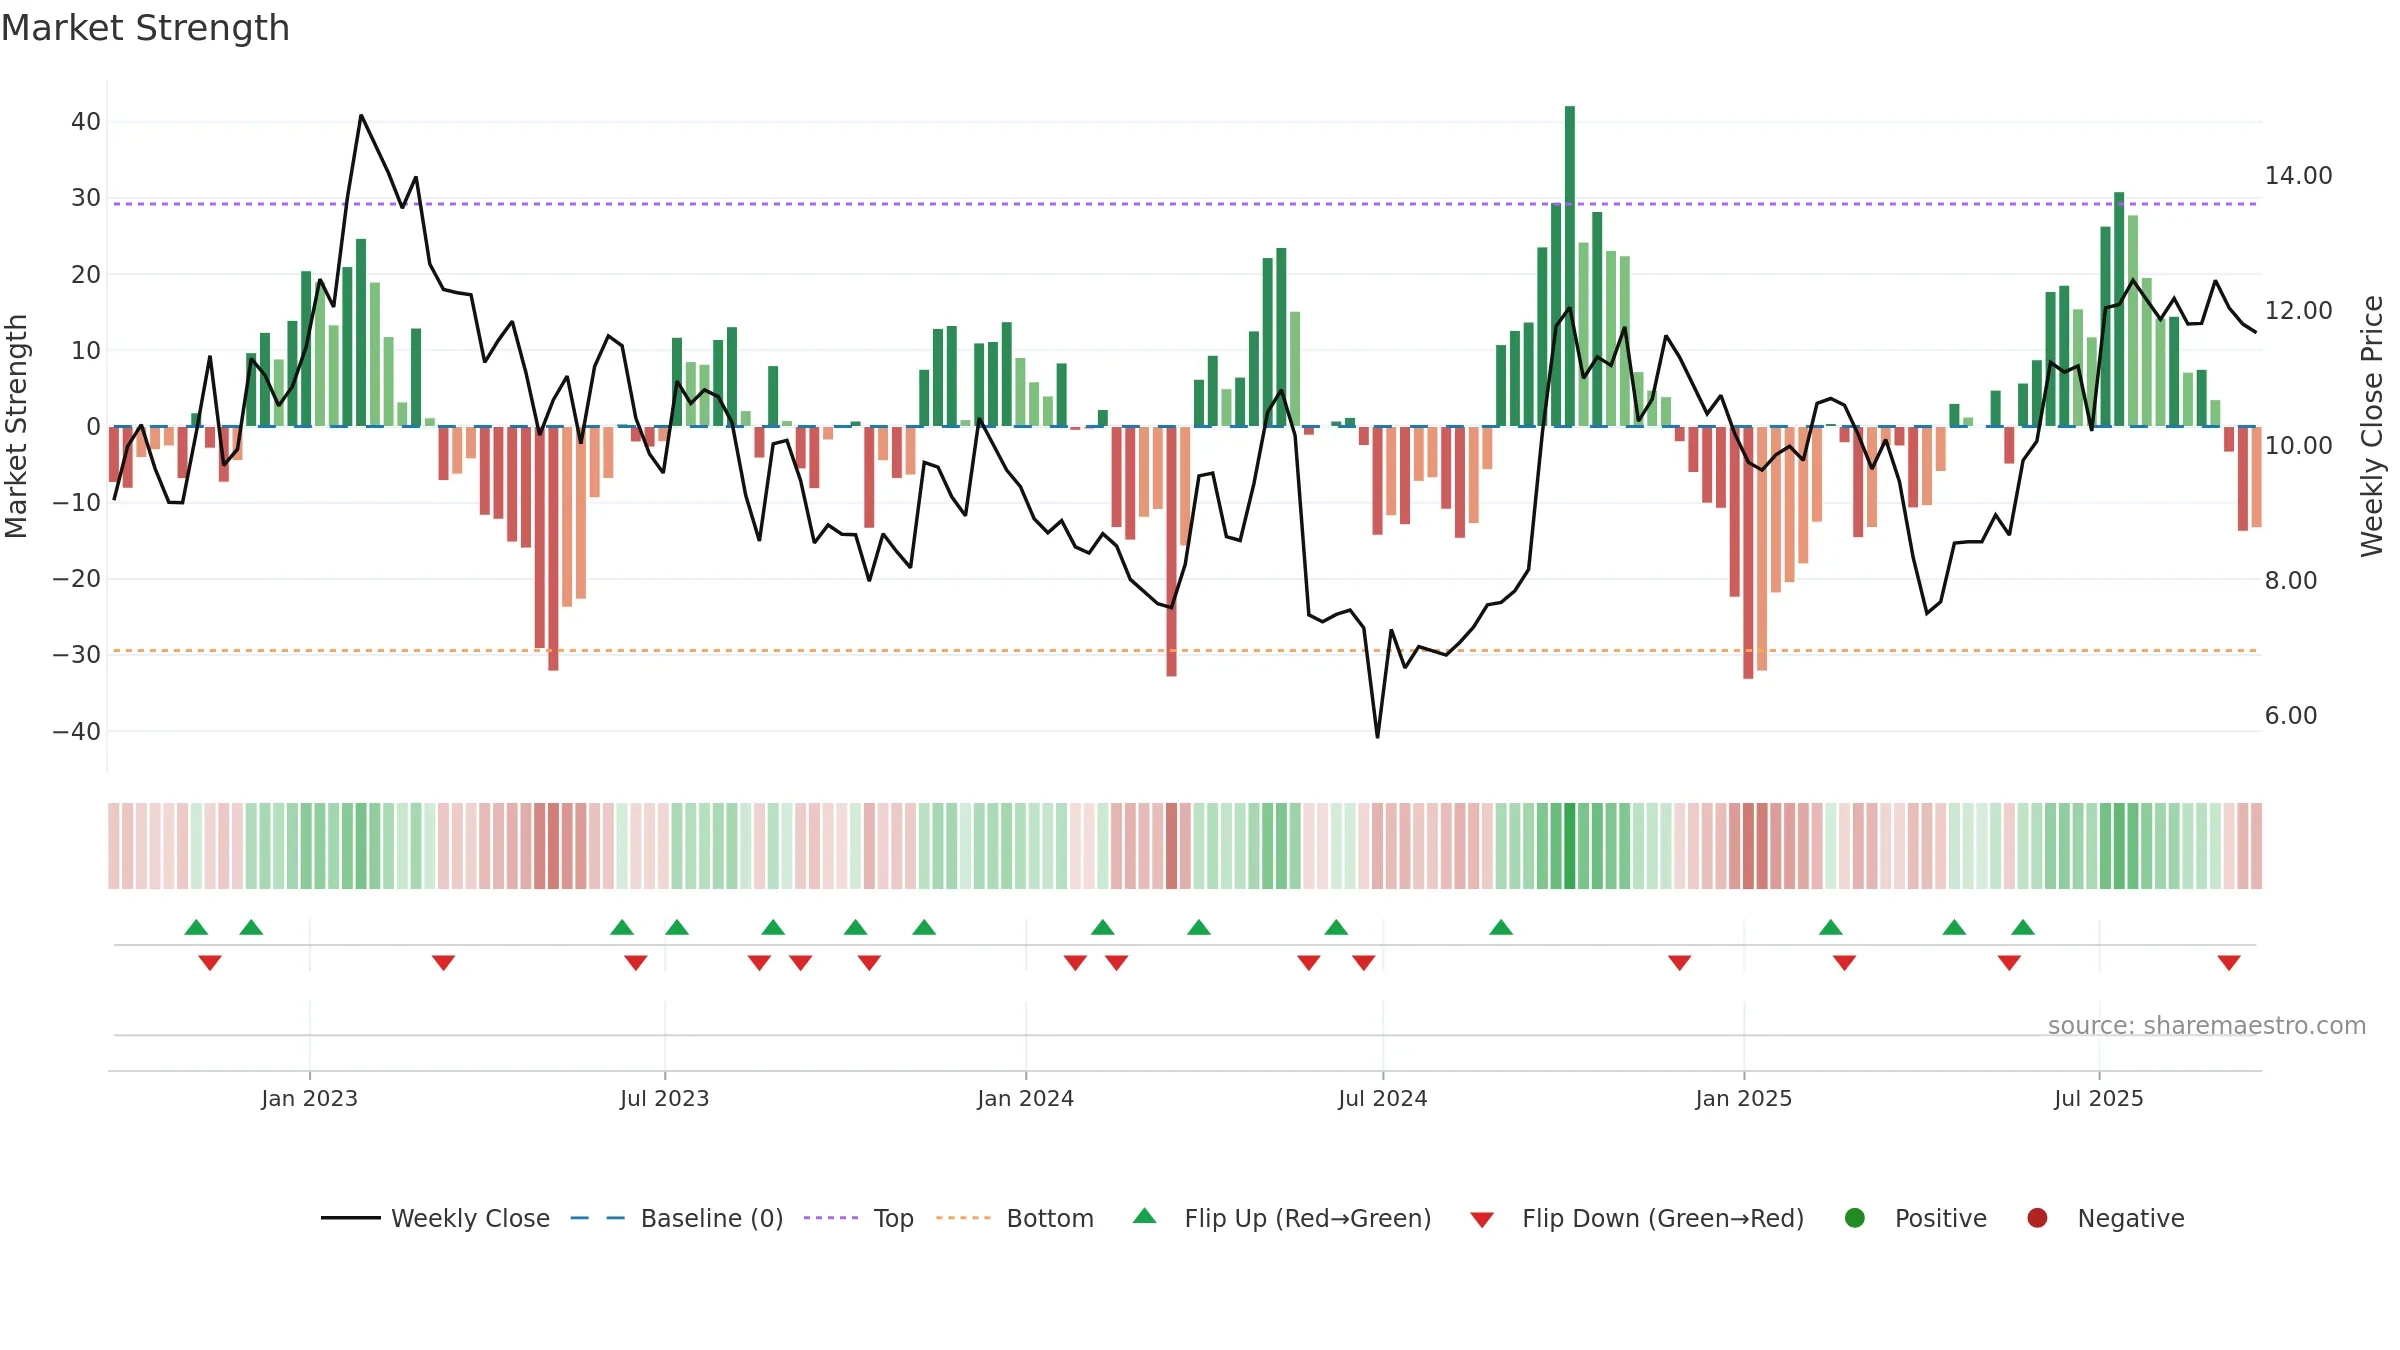
Gauge maps the trend signal to a 0–100 scale.
How to read this — Gauge is elevated but momentum is rolling over; topping risk is rising. Notable breakdown from ≥0.80 weakens trend quality.
Stay alert: protect gains or seek confirmation before adding risk.

Relative strength is Positive
(> 0%, outperforming).
Latest MRS: 2.63% (week ending Fri, 19 Sep 2025).
Slope: Falling over 8w.
Notes:
- Holding above the zero line indicates relative bid.
- MRS slope falling over ~8 weeks.
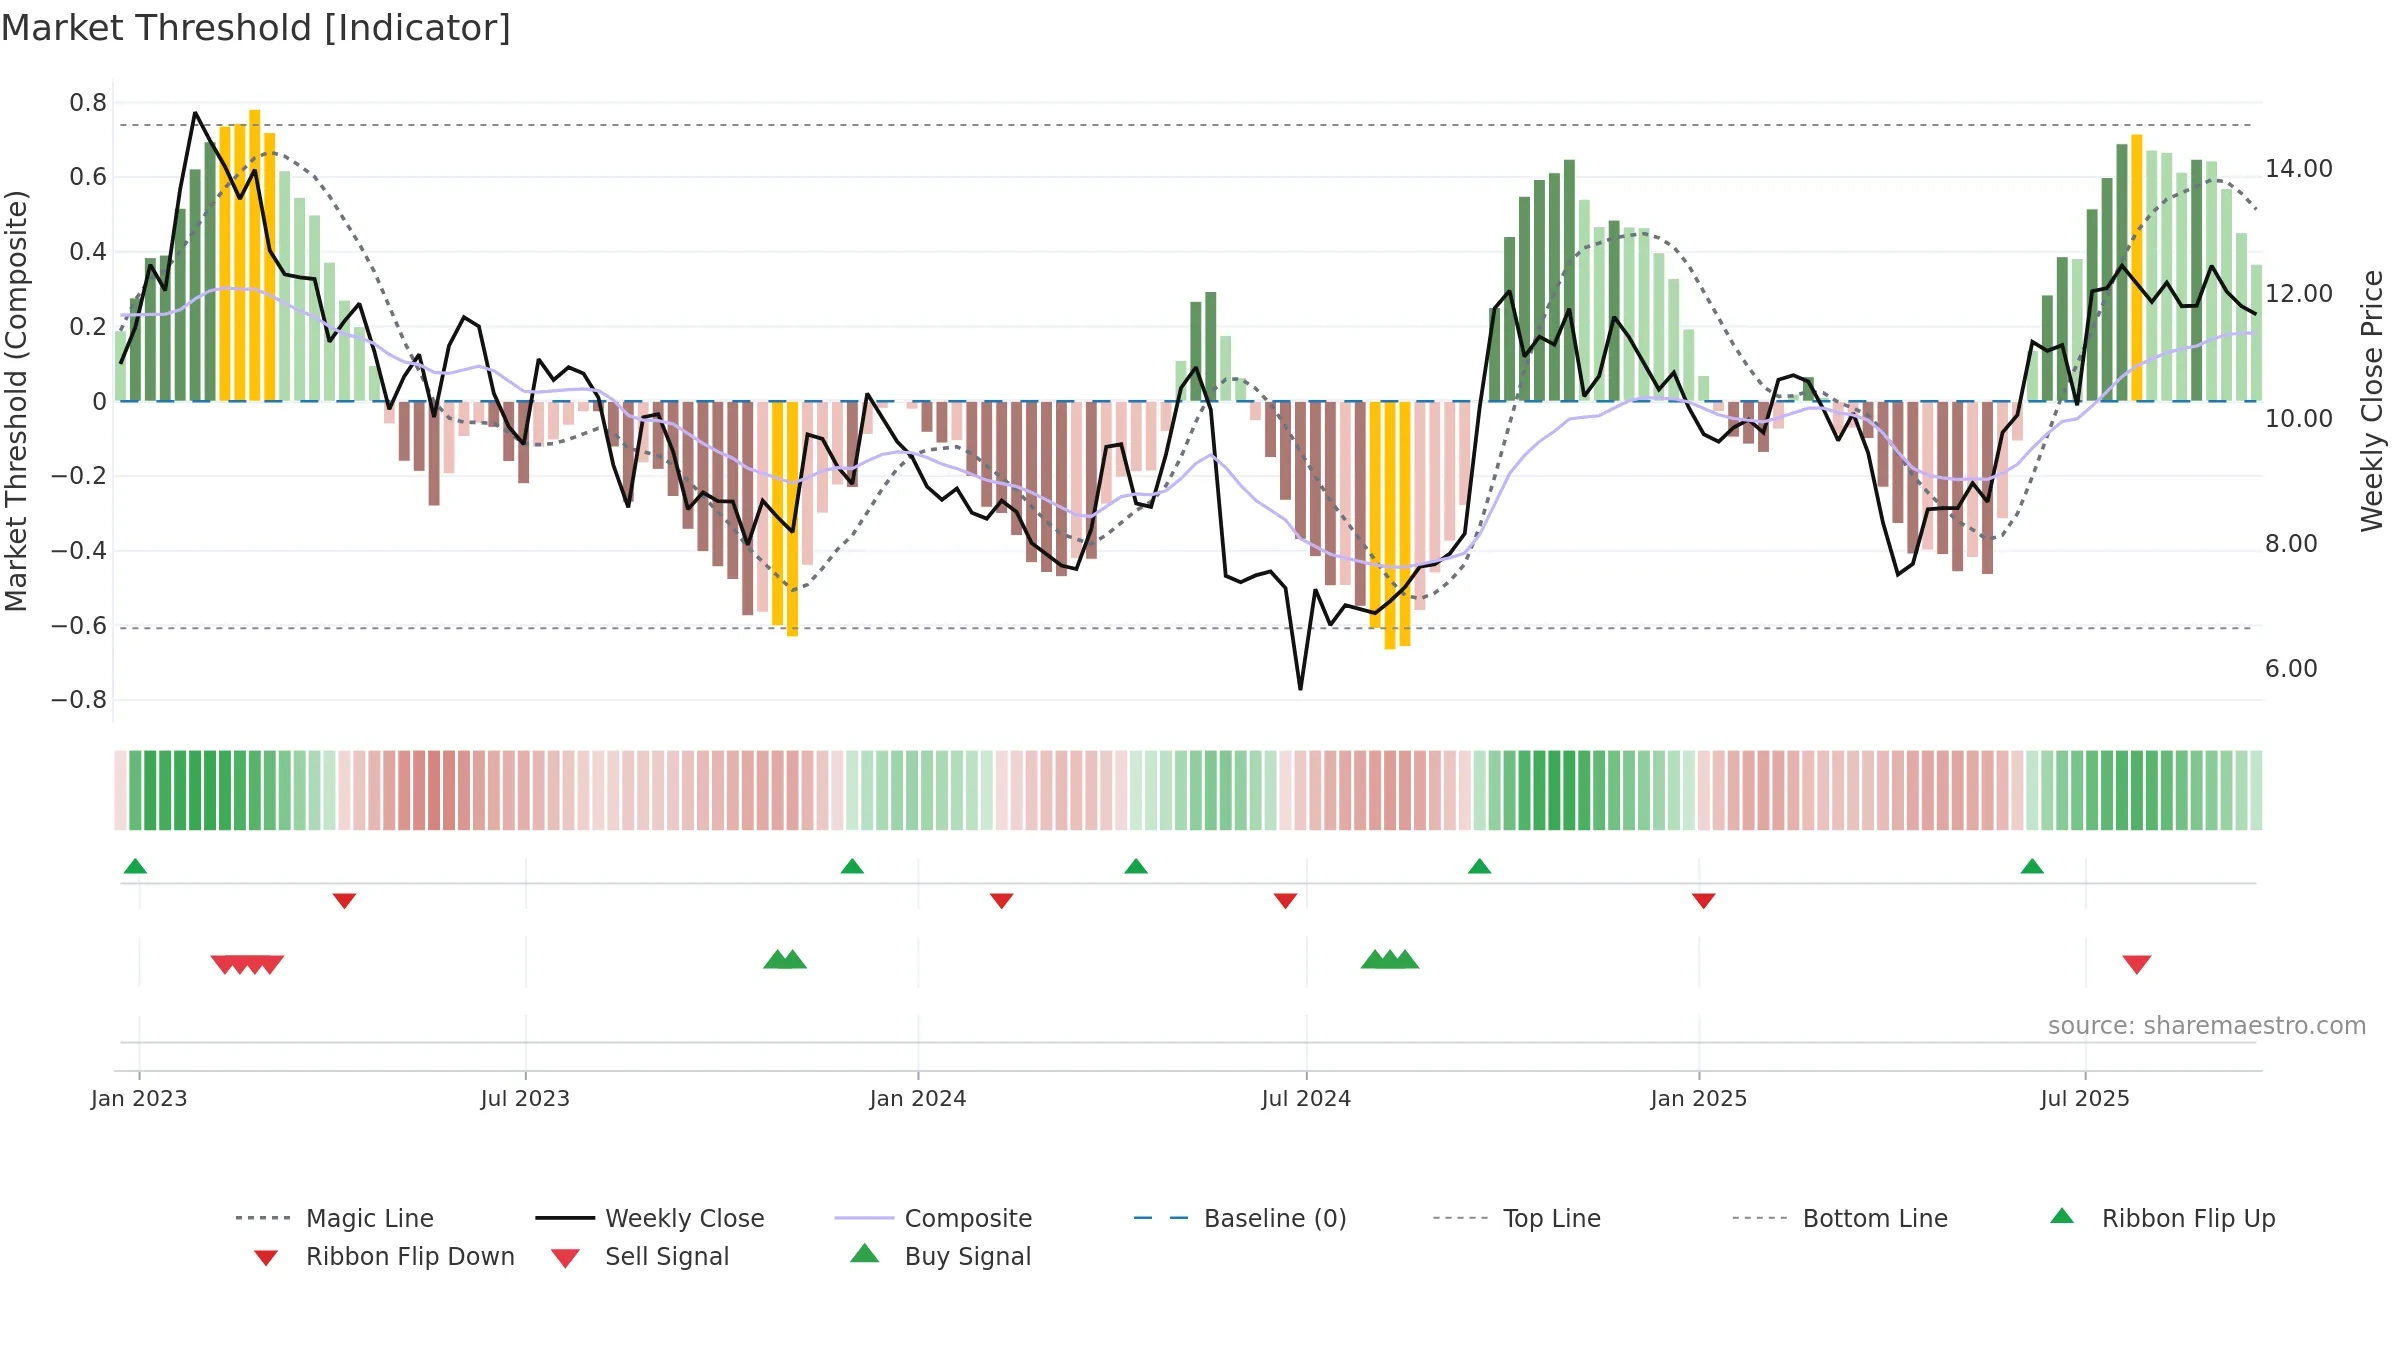
Conclusion
Negative setup. ★★⯪☆☆ confidence. Trend: Uptrend at Risk · -1.68% over window · vol 3.16% · liquidity divergence · posture mixed · RS outperforming · leaning negative
- Momentum is bullish and rising
- Constructive moving-average stack
- Mansfield RS: outperforming & rising
- High level but momentum rolling over (topping risk)
- Price is not above key averages
- Liquidity diverges from price
- Negative multi-week performance
Why: Price window -1.68% over w. Close is -6.27% below the prior-window high. Volume trend rising. Liquidity divergence with price. Trend state uptrend at risk. MA stack constructive. Momentum bullish and rising.
Tip: Most metrics include a hover tooltip where they appear in the report.