Microsoft Corporation
MSFT NASDAQ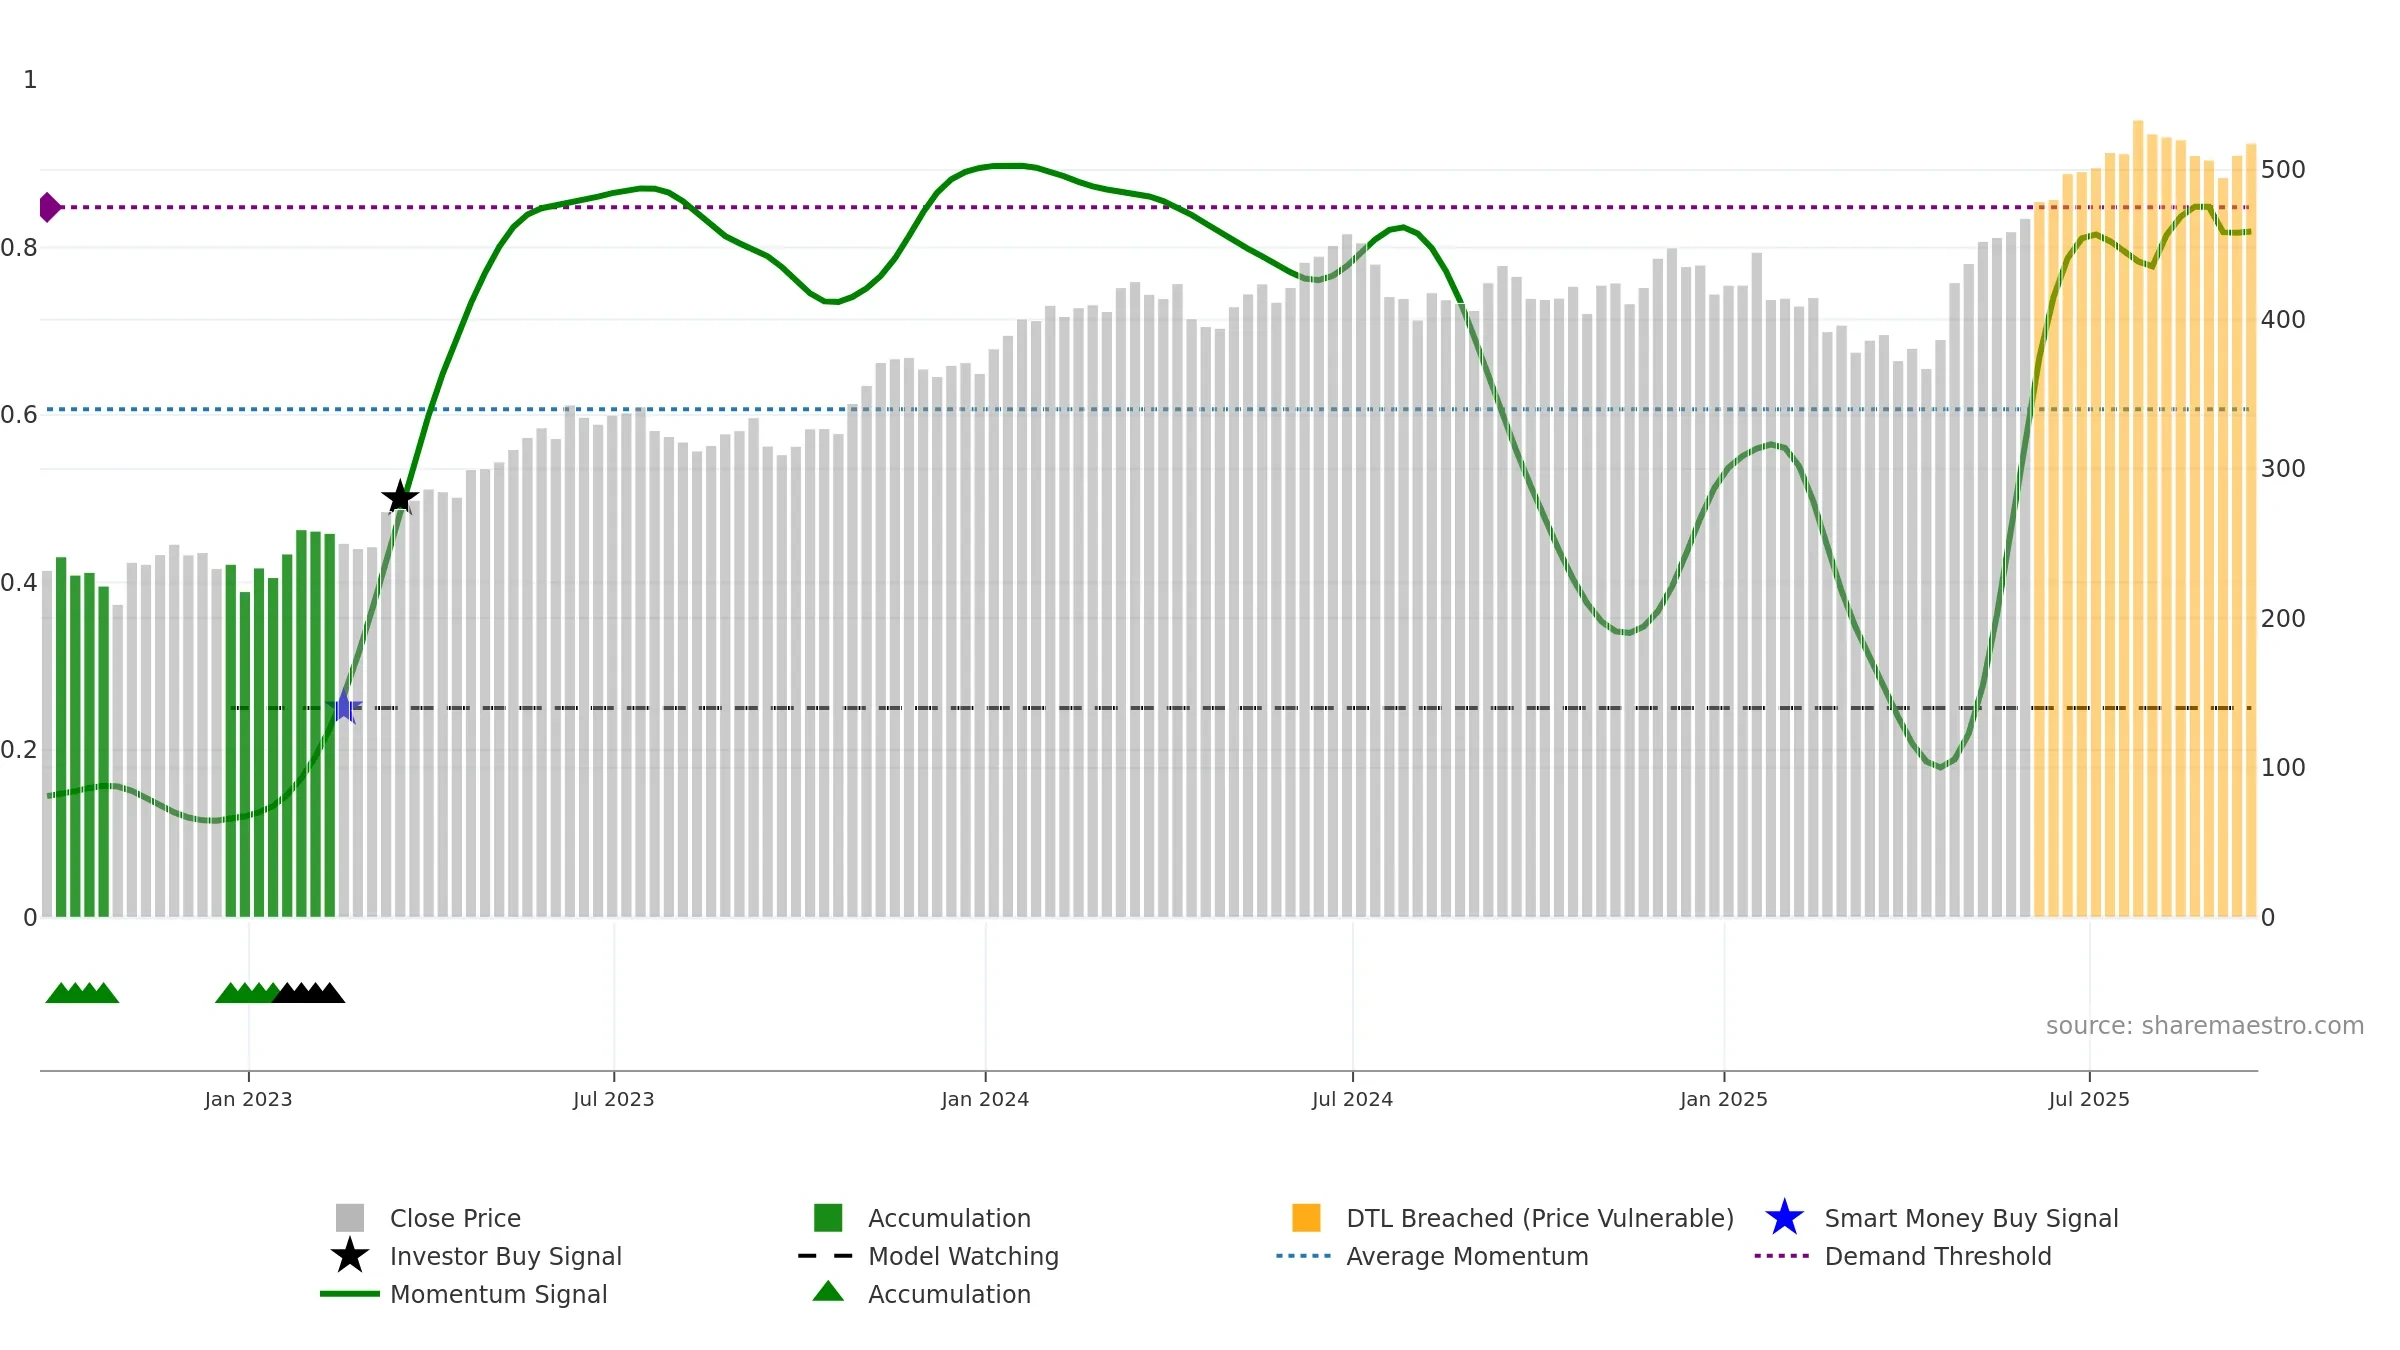
Weekly Report
Microsoft Corporation closed at 517.9300 (1.44% WoW) . Data window ends Fri, 19 Sep 2025.
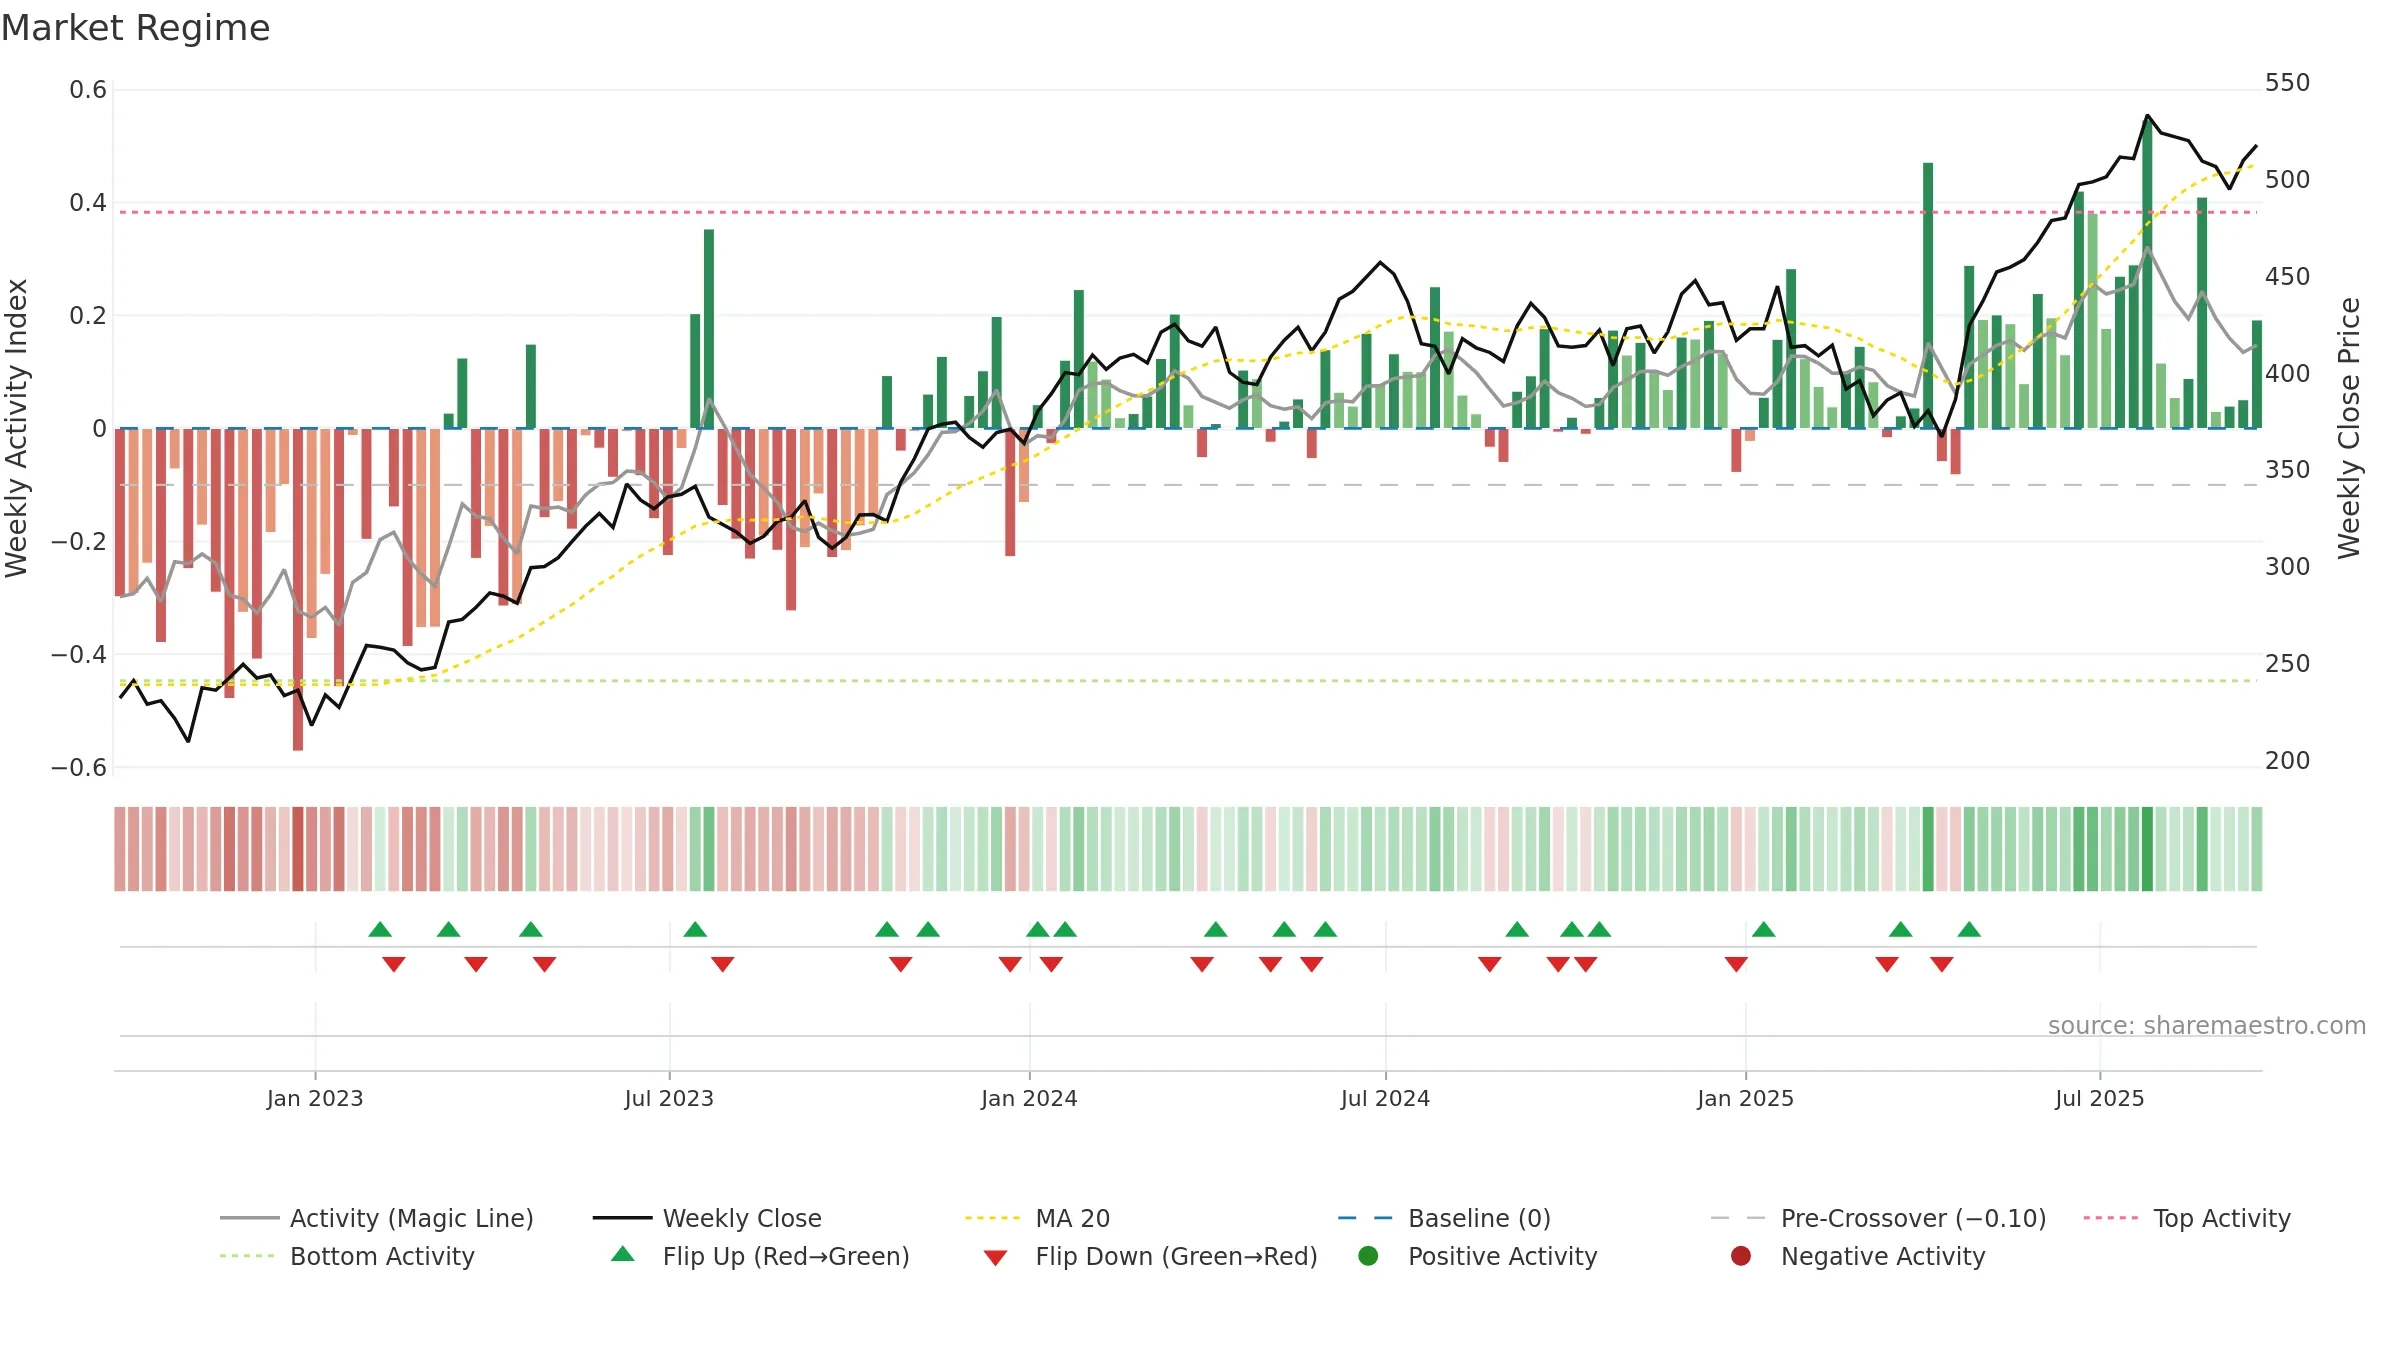
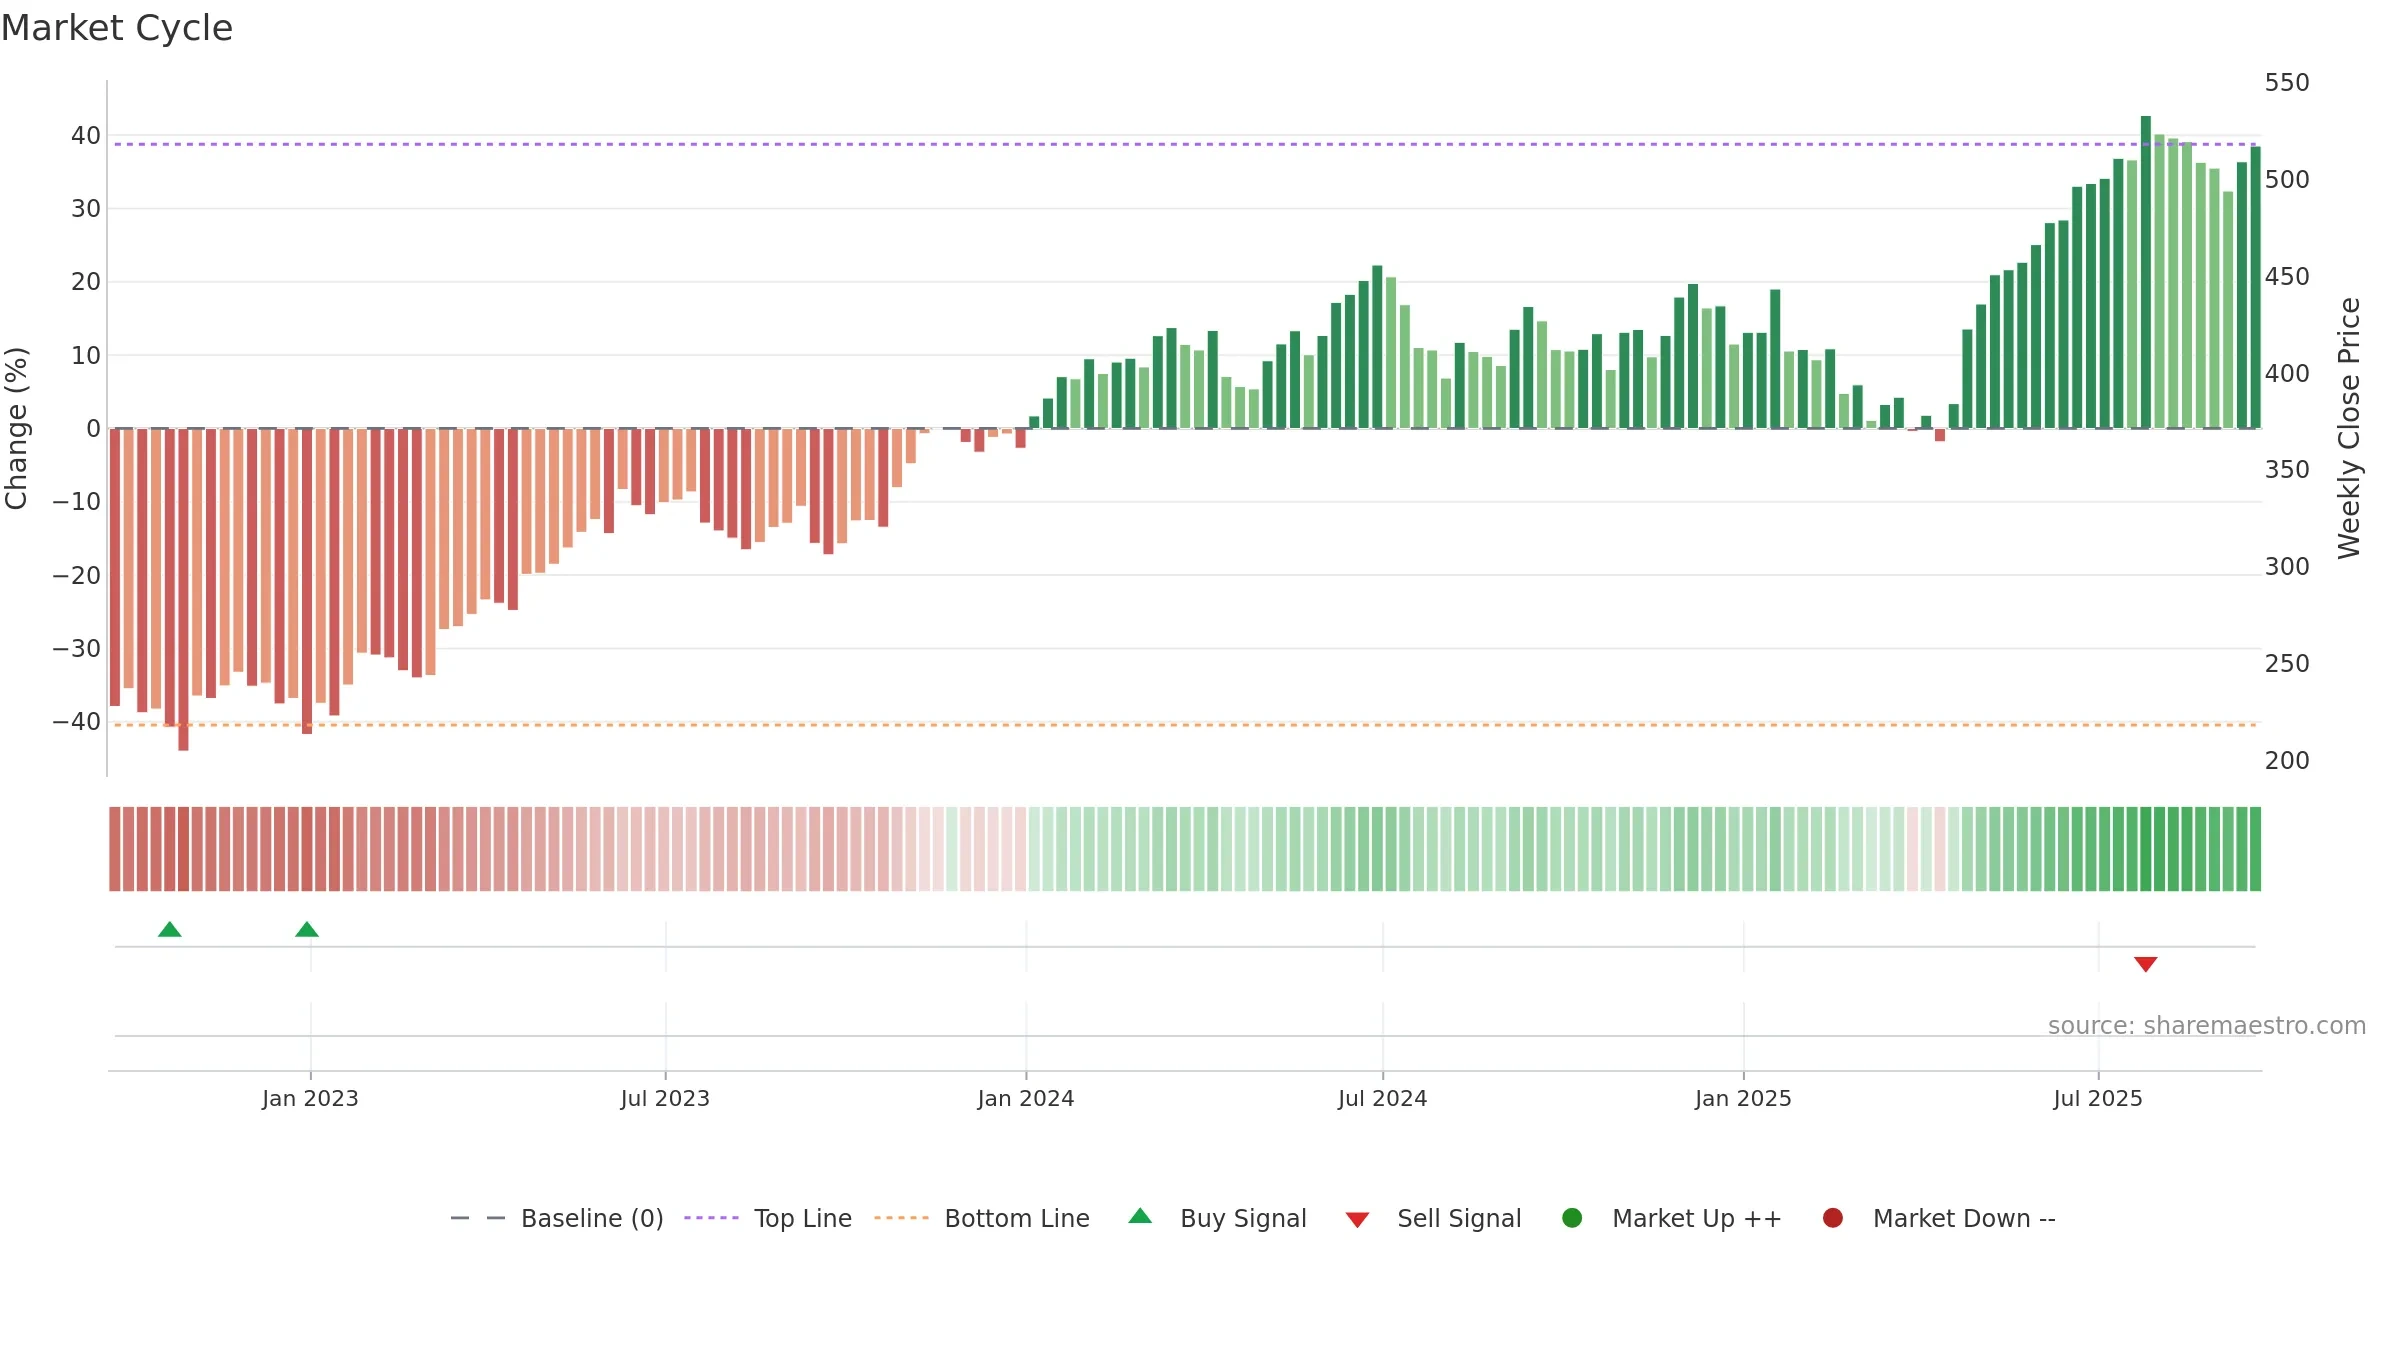
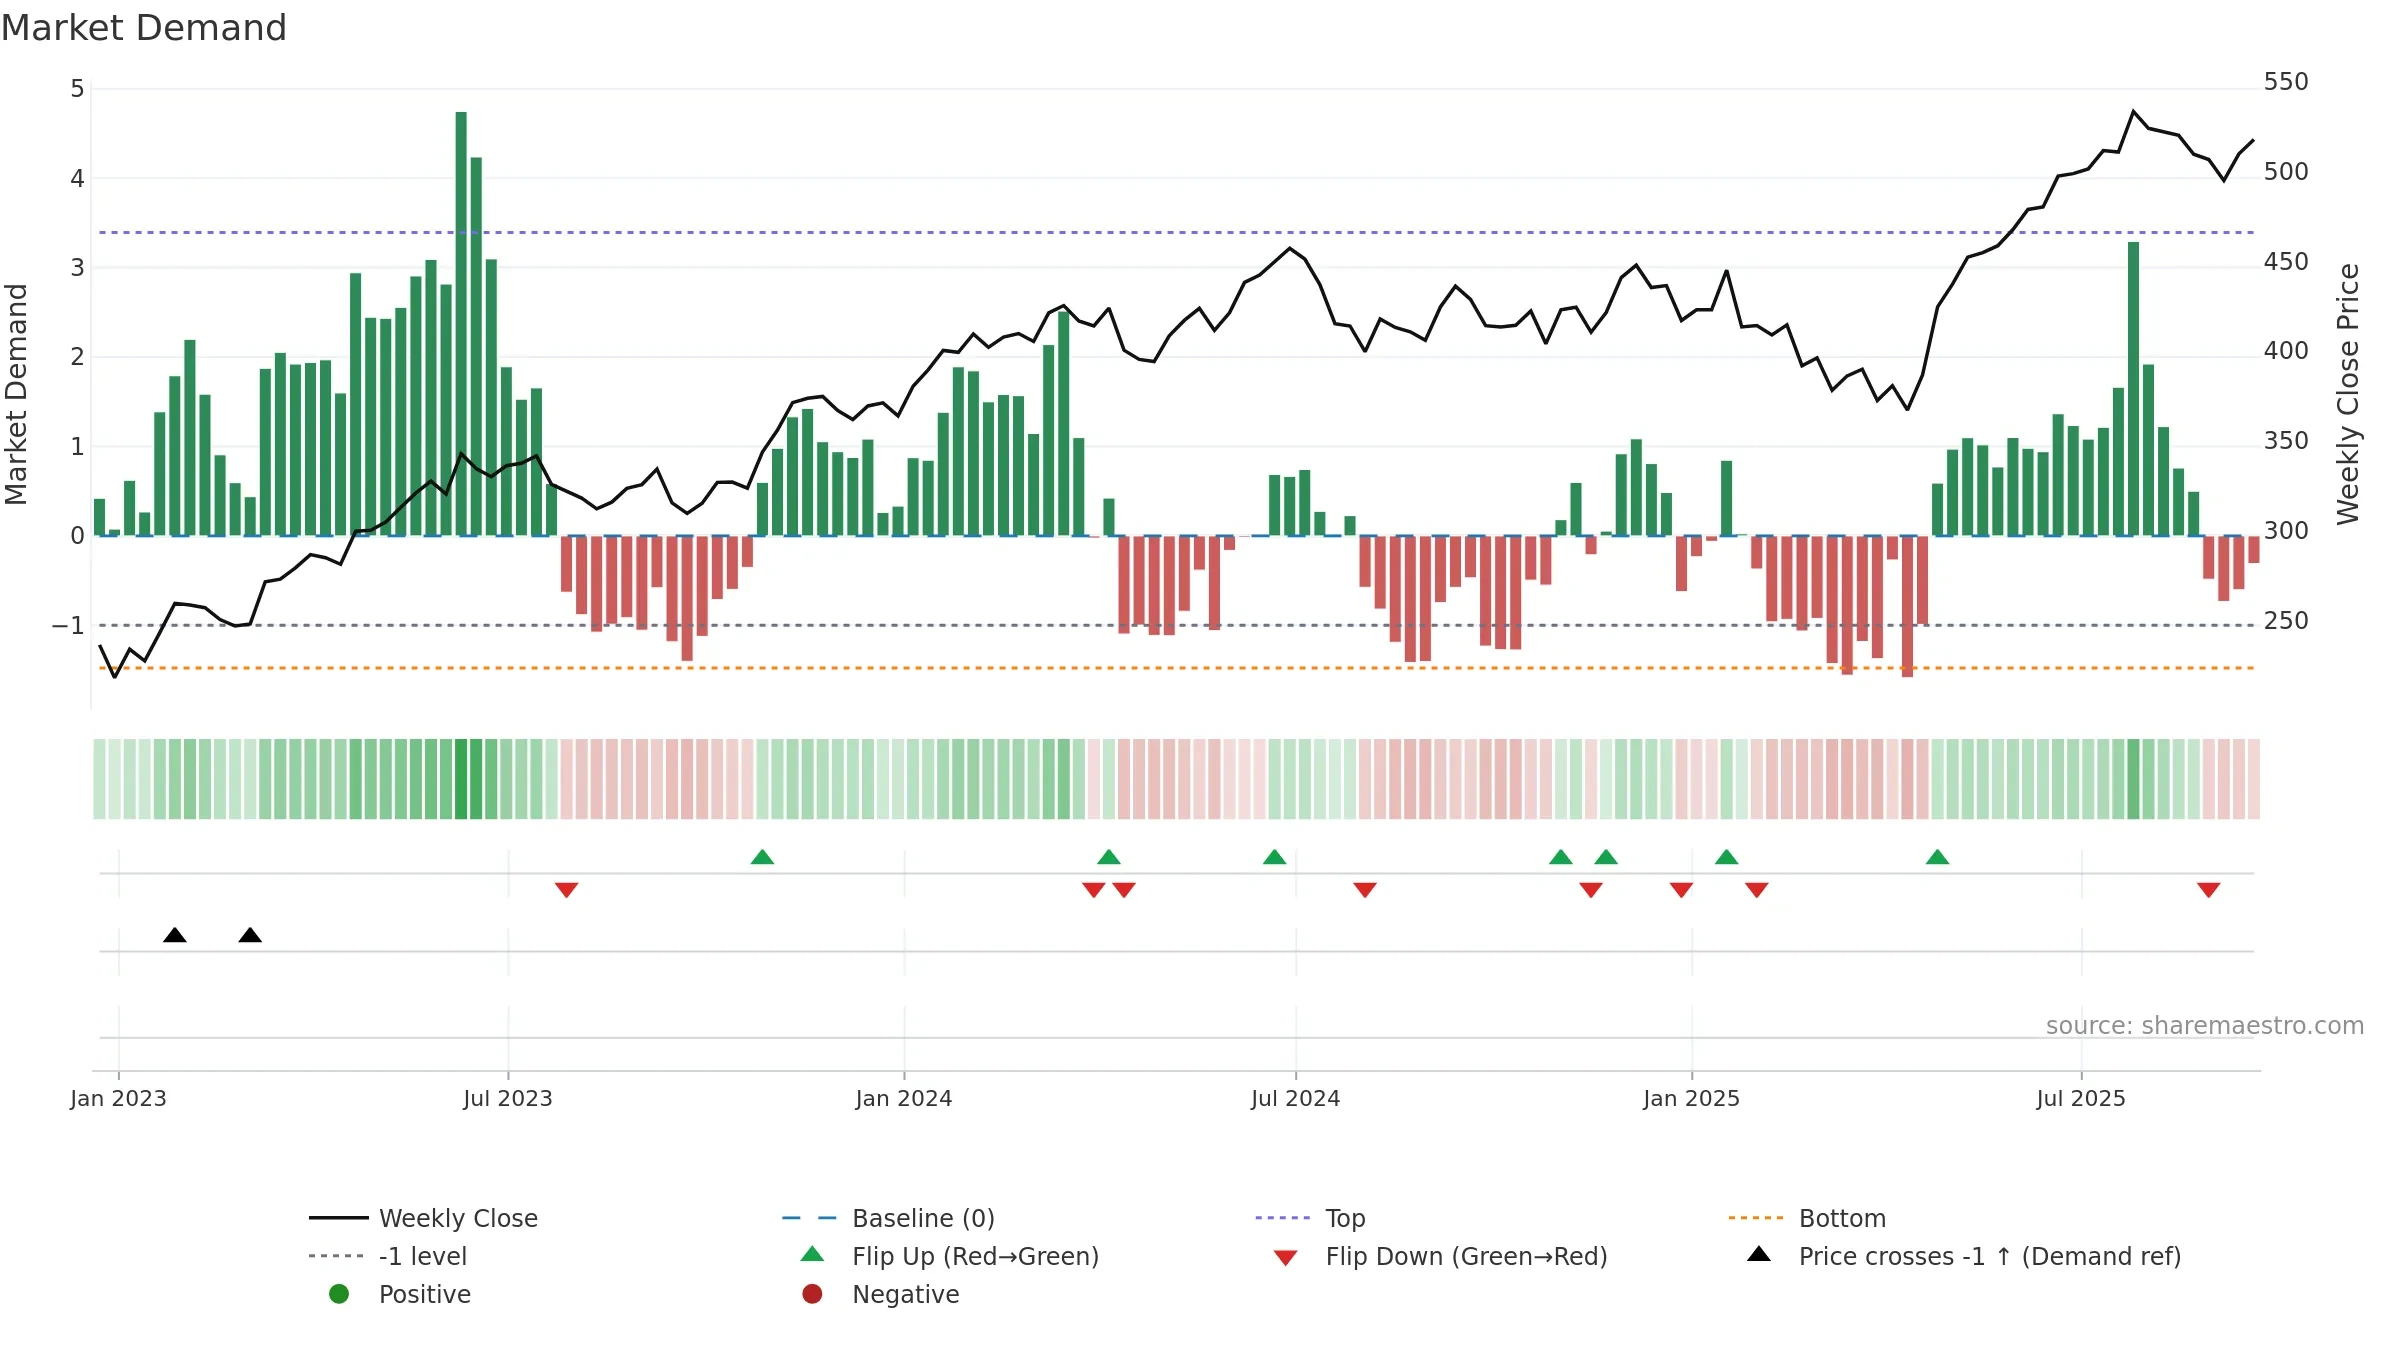
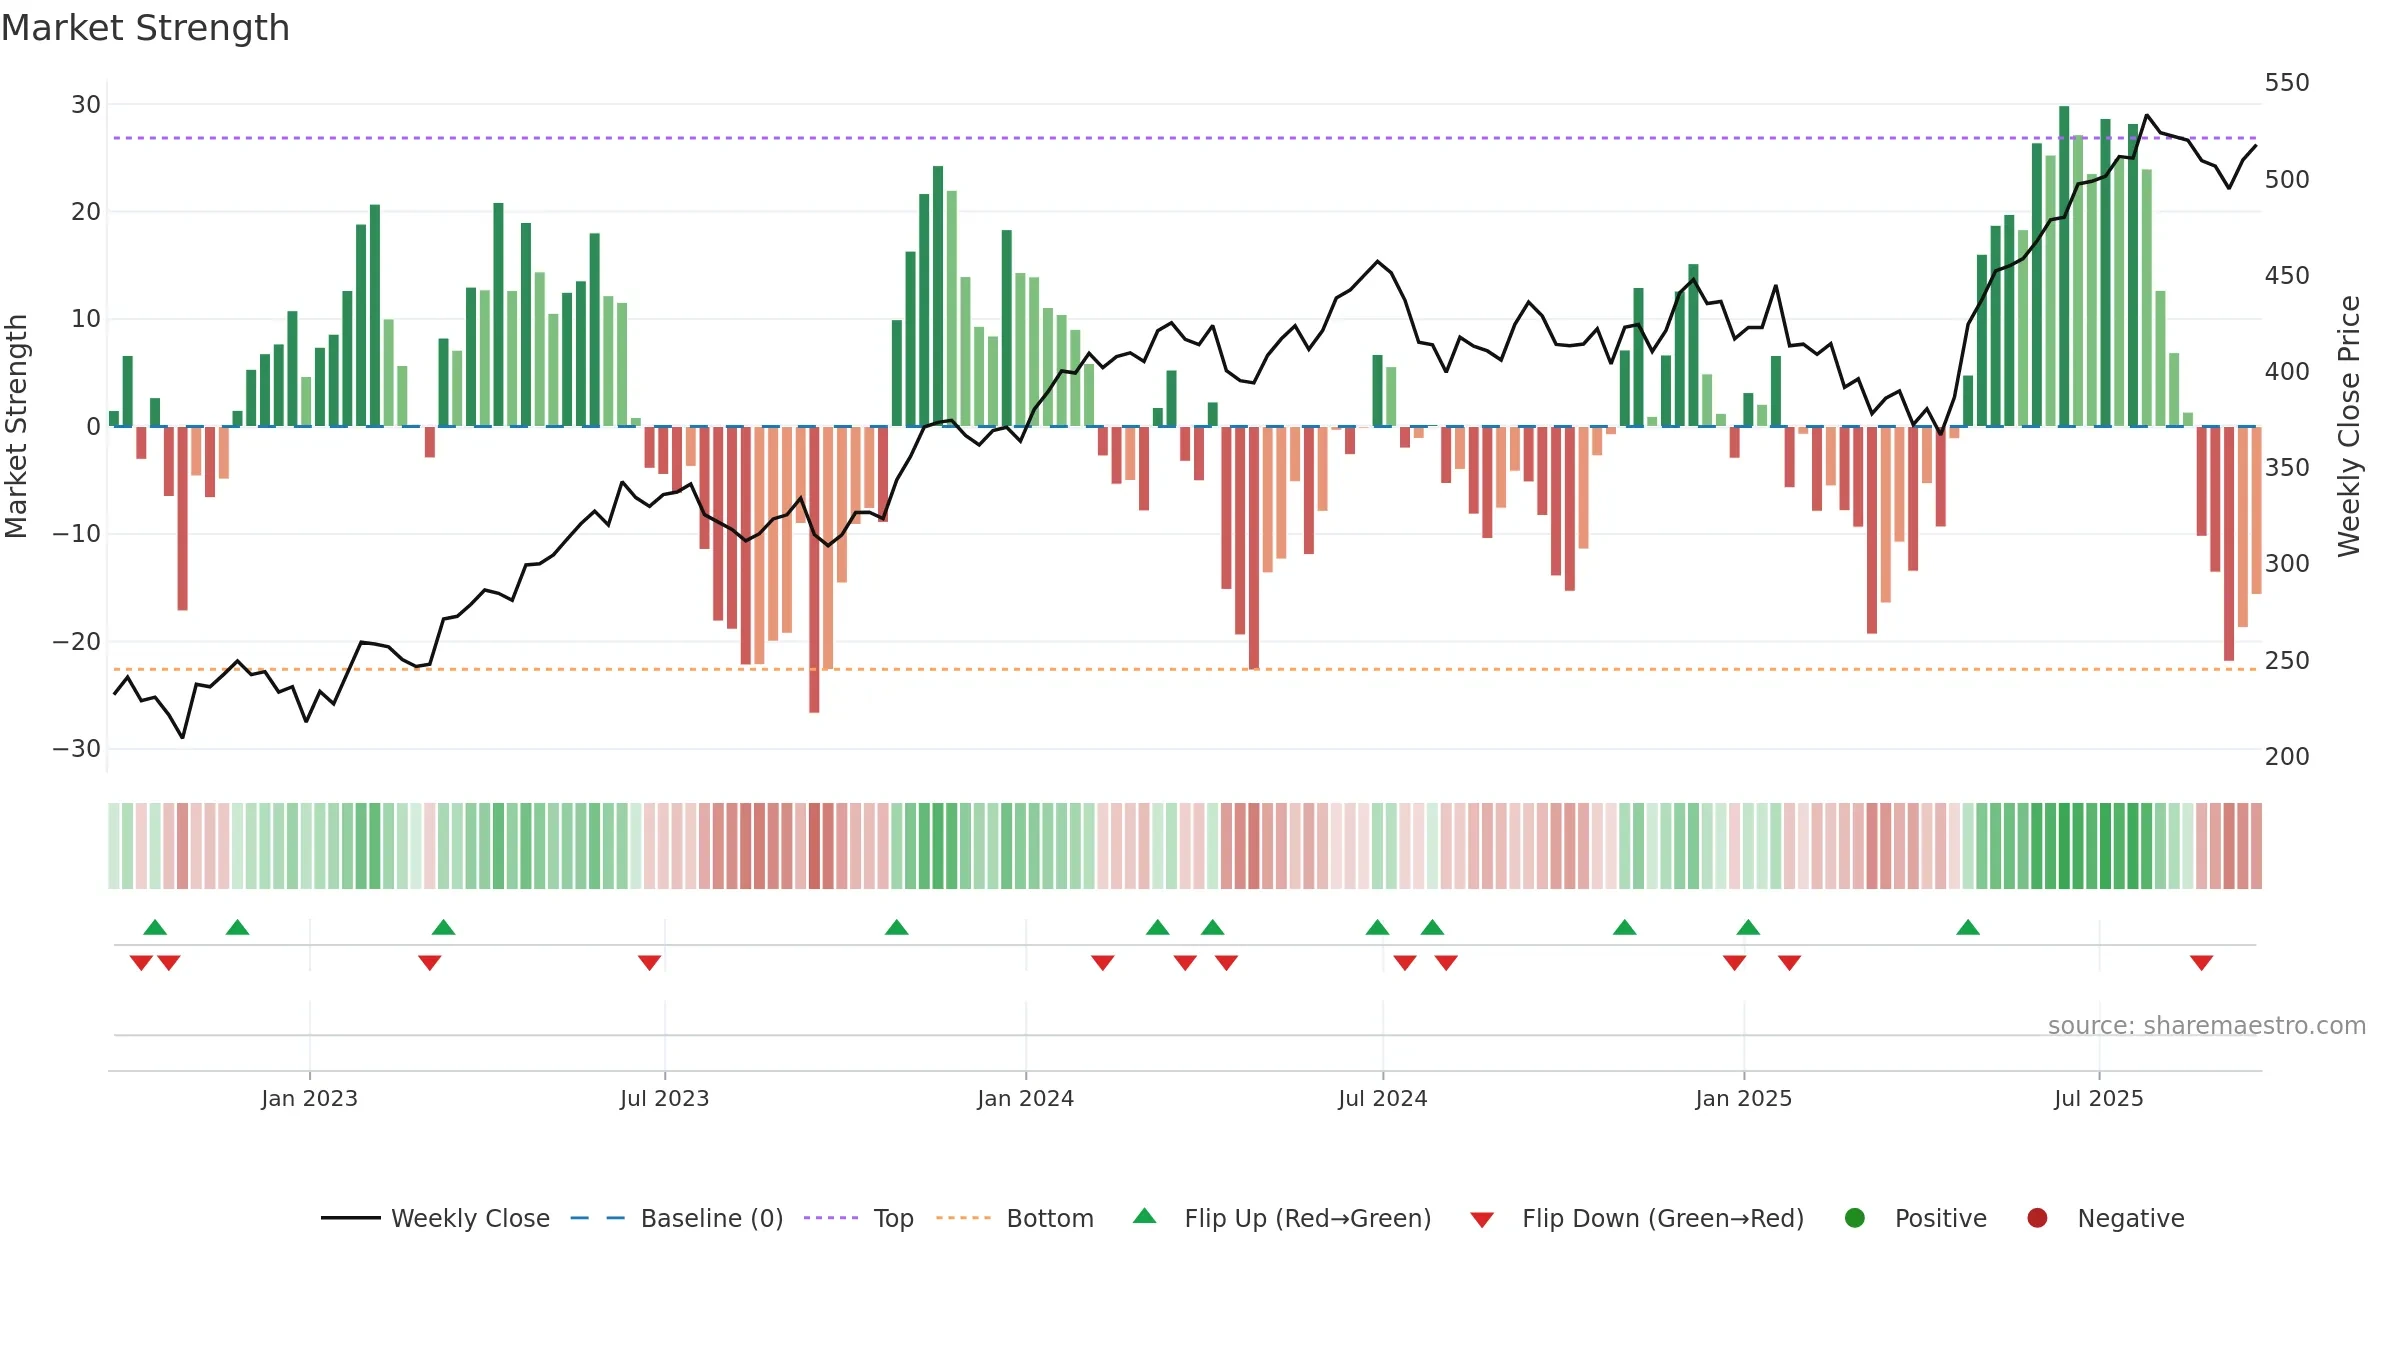
How to read this — Price slope is downward, indicating persistent supply pressure. Low weekly volatility favours steadier follow-through. Volume trend diverges from price — watch for fatigue or rotation. Returns are positively correlated with volume — strength tends to arrive on higher activity. Distance to baseline is narrowing — reverting closer to its fair-value track. Price holds above key averages, indicating constructive participation.
Down-slope argues for patience; rallies can fade sooner unless participation improves. Because liquidity isn’t confirming, prefer evidence of fresh demand before chasing moves.
Gauge maps the trend signal to a 0–100 scale.
How to read this — Gauge is elevated but momentum is rolling over; topping risk is rising.
Stay alert: protect gains or seek confirmation before adding risk.
Conclusion
Negative setup. ★★☆☆☆ confidence. Price window: -1. Trend: Uptrend at Risk; gauge 81. In combination, liquidity diverges from price.
- Momentum is bullish and rising
- Price holds above 8w & 26w averages
- Low return volatility supports durability
- High-level but rolling over (topping risk)
- Liquidity diverges from price
- Negative multi-week performance
- Sellers active at elevated levels (distribution)
Why: Price window -1.18% over 8w. Close is -1.18% below the prior-window high. Return volatility 1.37%. Volume trend rising. Liquidity divergence with price. Trend state uptrend at risk. High-regime (0.80–1.00) downticks 3/6 (50.0%) • Accumulating. Momentum bullish and rising.
Tip: Most metrics include a hover tooltip where they appear in the report.