Boozt AB (publ)
BOOZT STO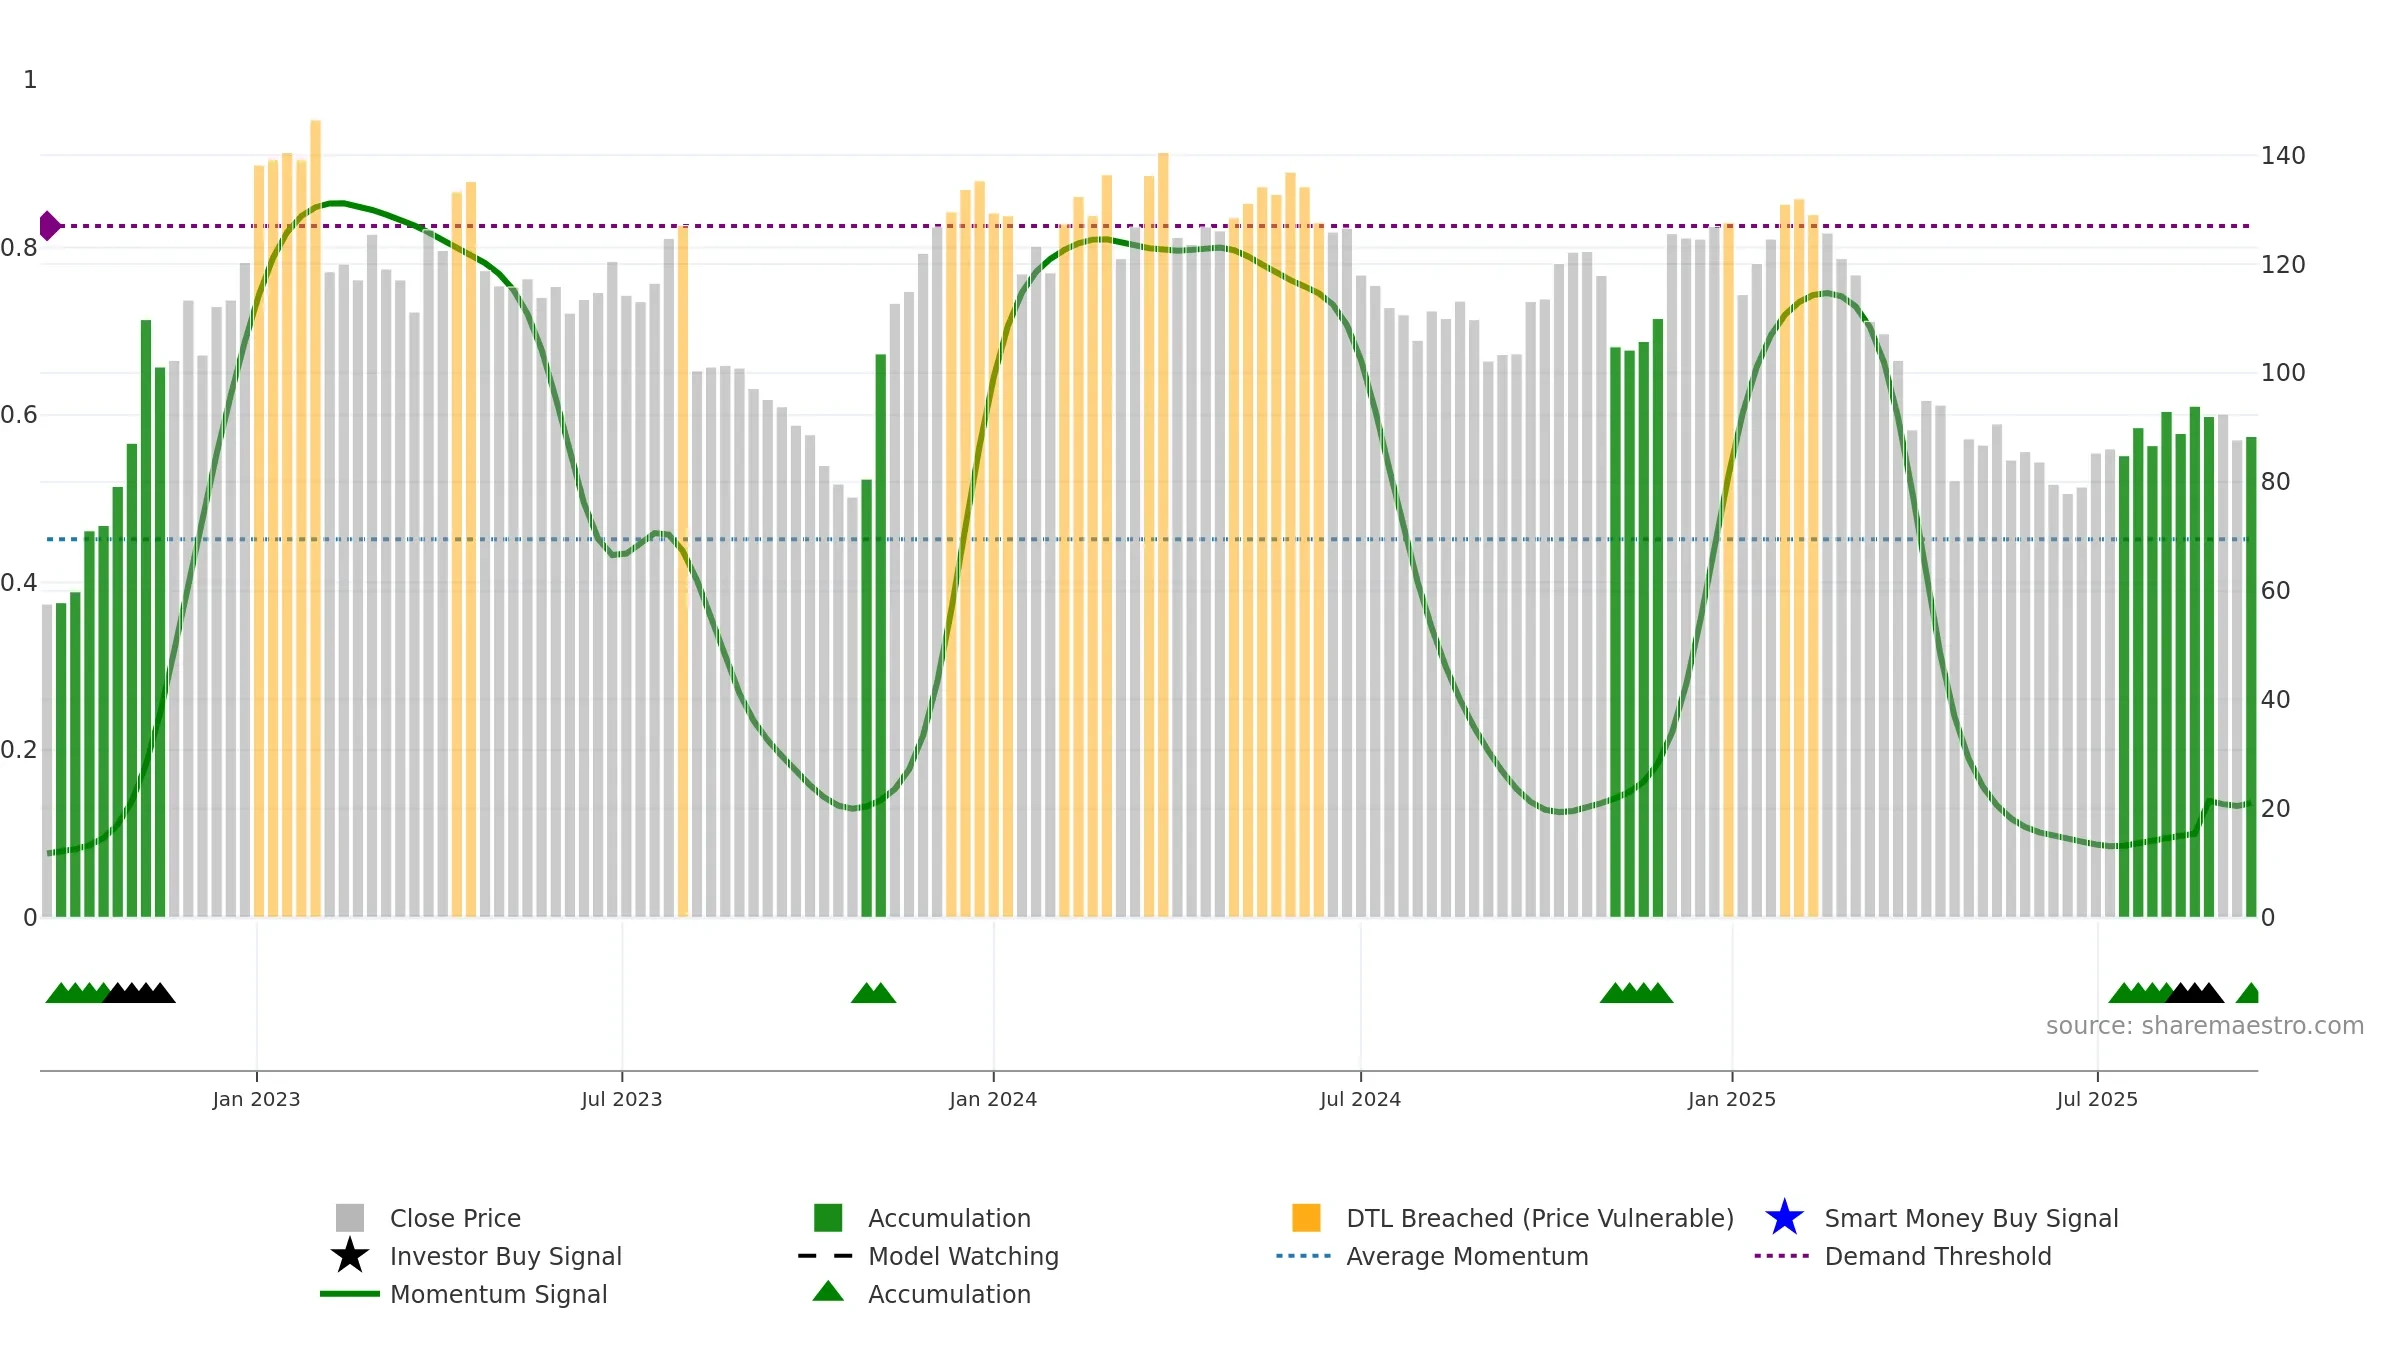
Weekly Report
Boozt AB (publ) closed at 88.3500 (-0.23% WoW) . Data window ends Mon, 15 Sep 2025.
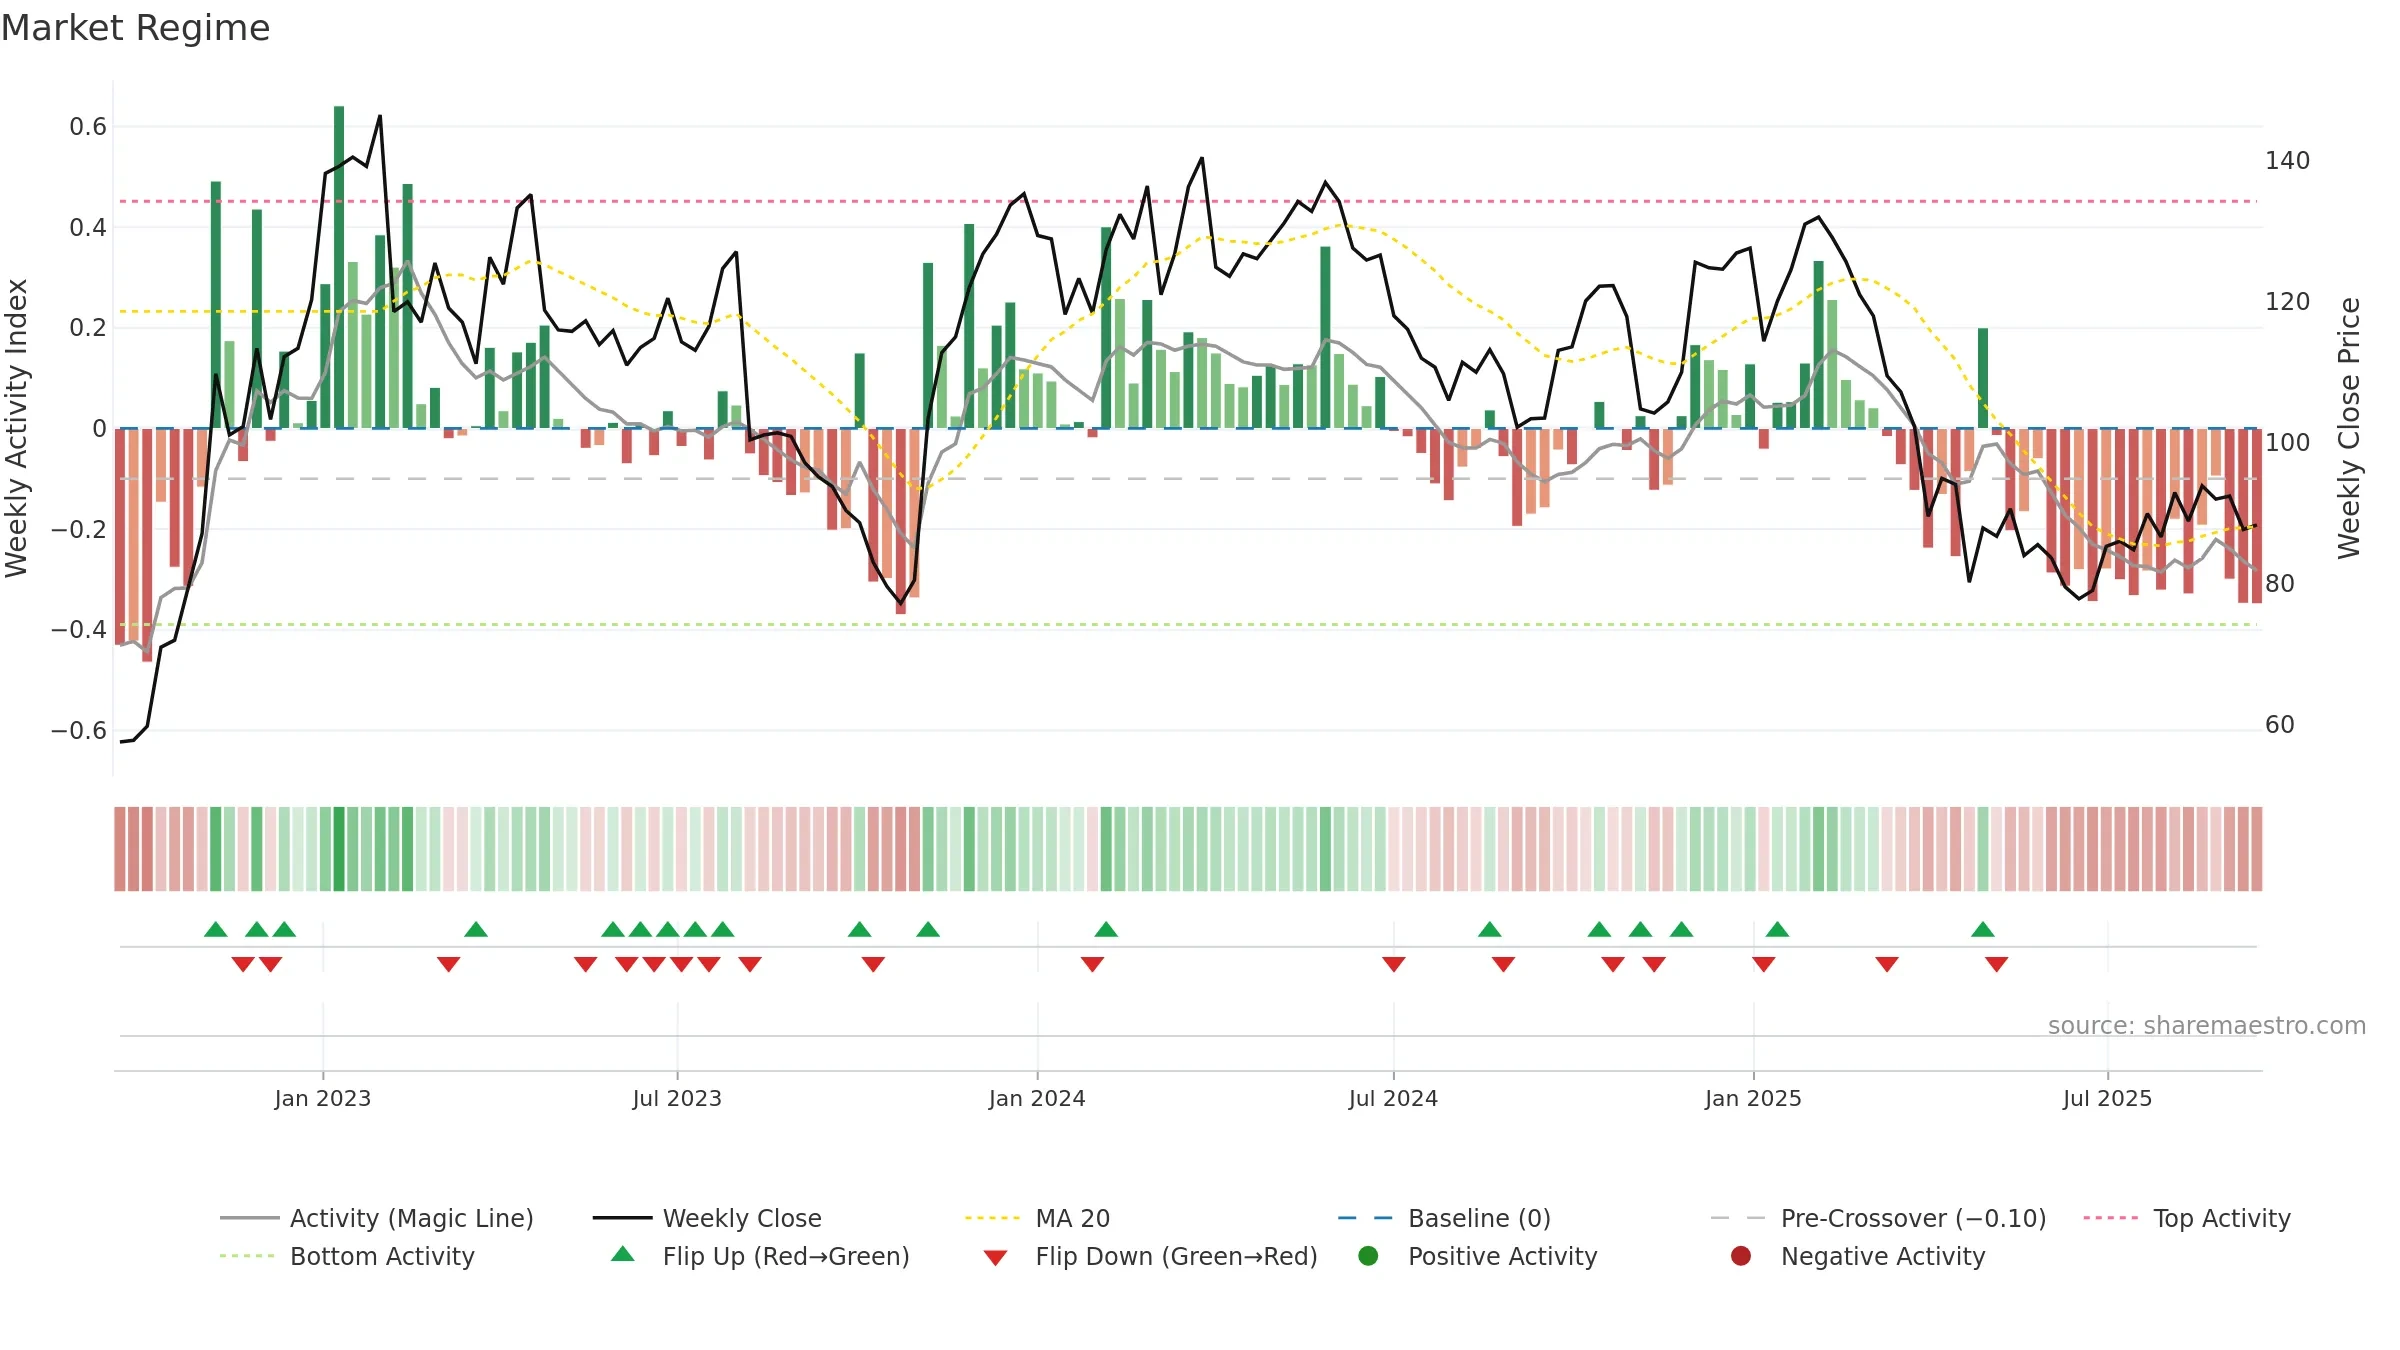
How to read this — Price slope is downward, indicating persistent supply pressure. Elevated weekly volatility increases whipsaw risk. Volume and price are moving in the same direction — a constructive confirmation. Fresh short-term downside crossover weakens near-term tone.
Down-slope argues for patience; rallies can fade sooner unless participation improves.
Gauge maps the trend signal to a 0–100 scale.
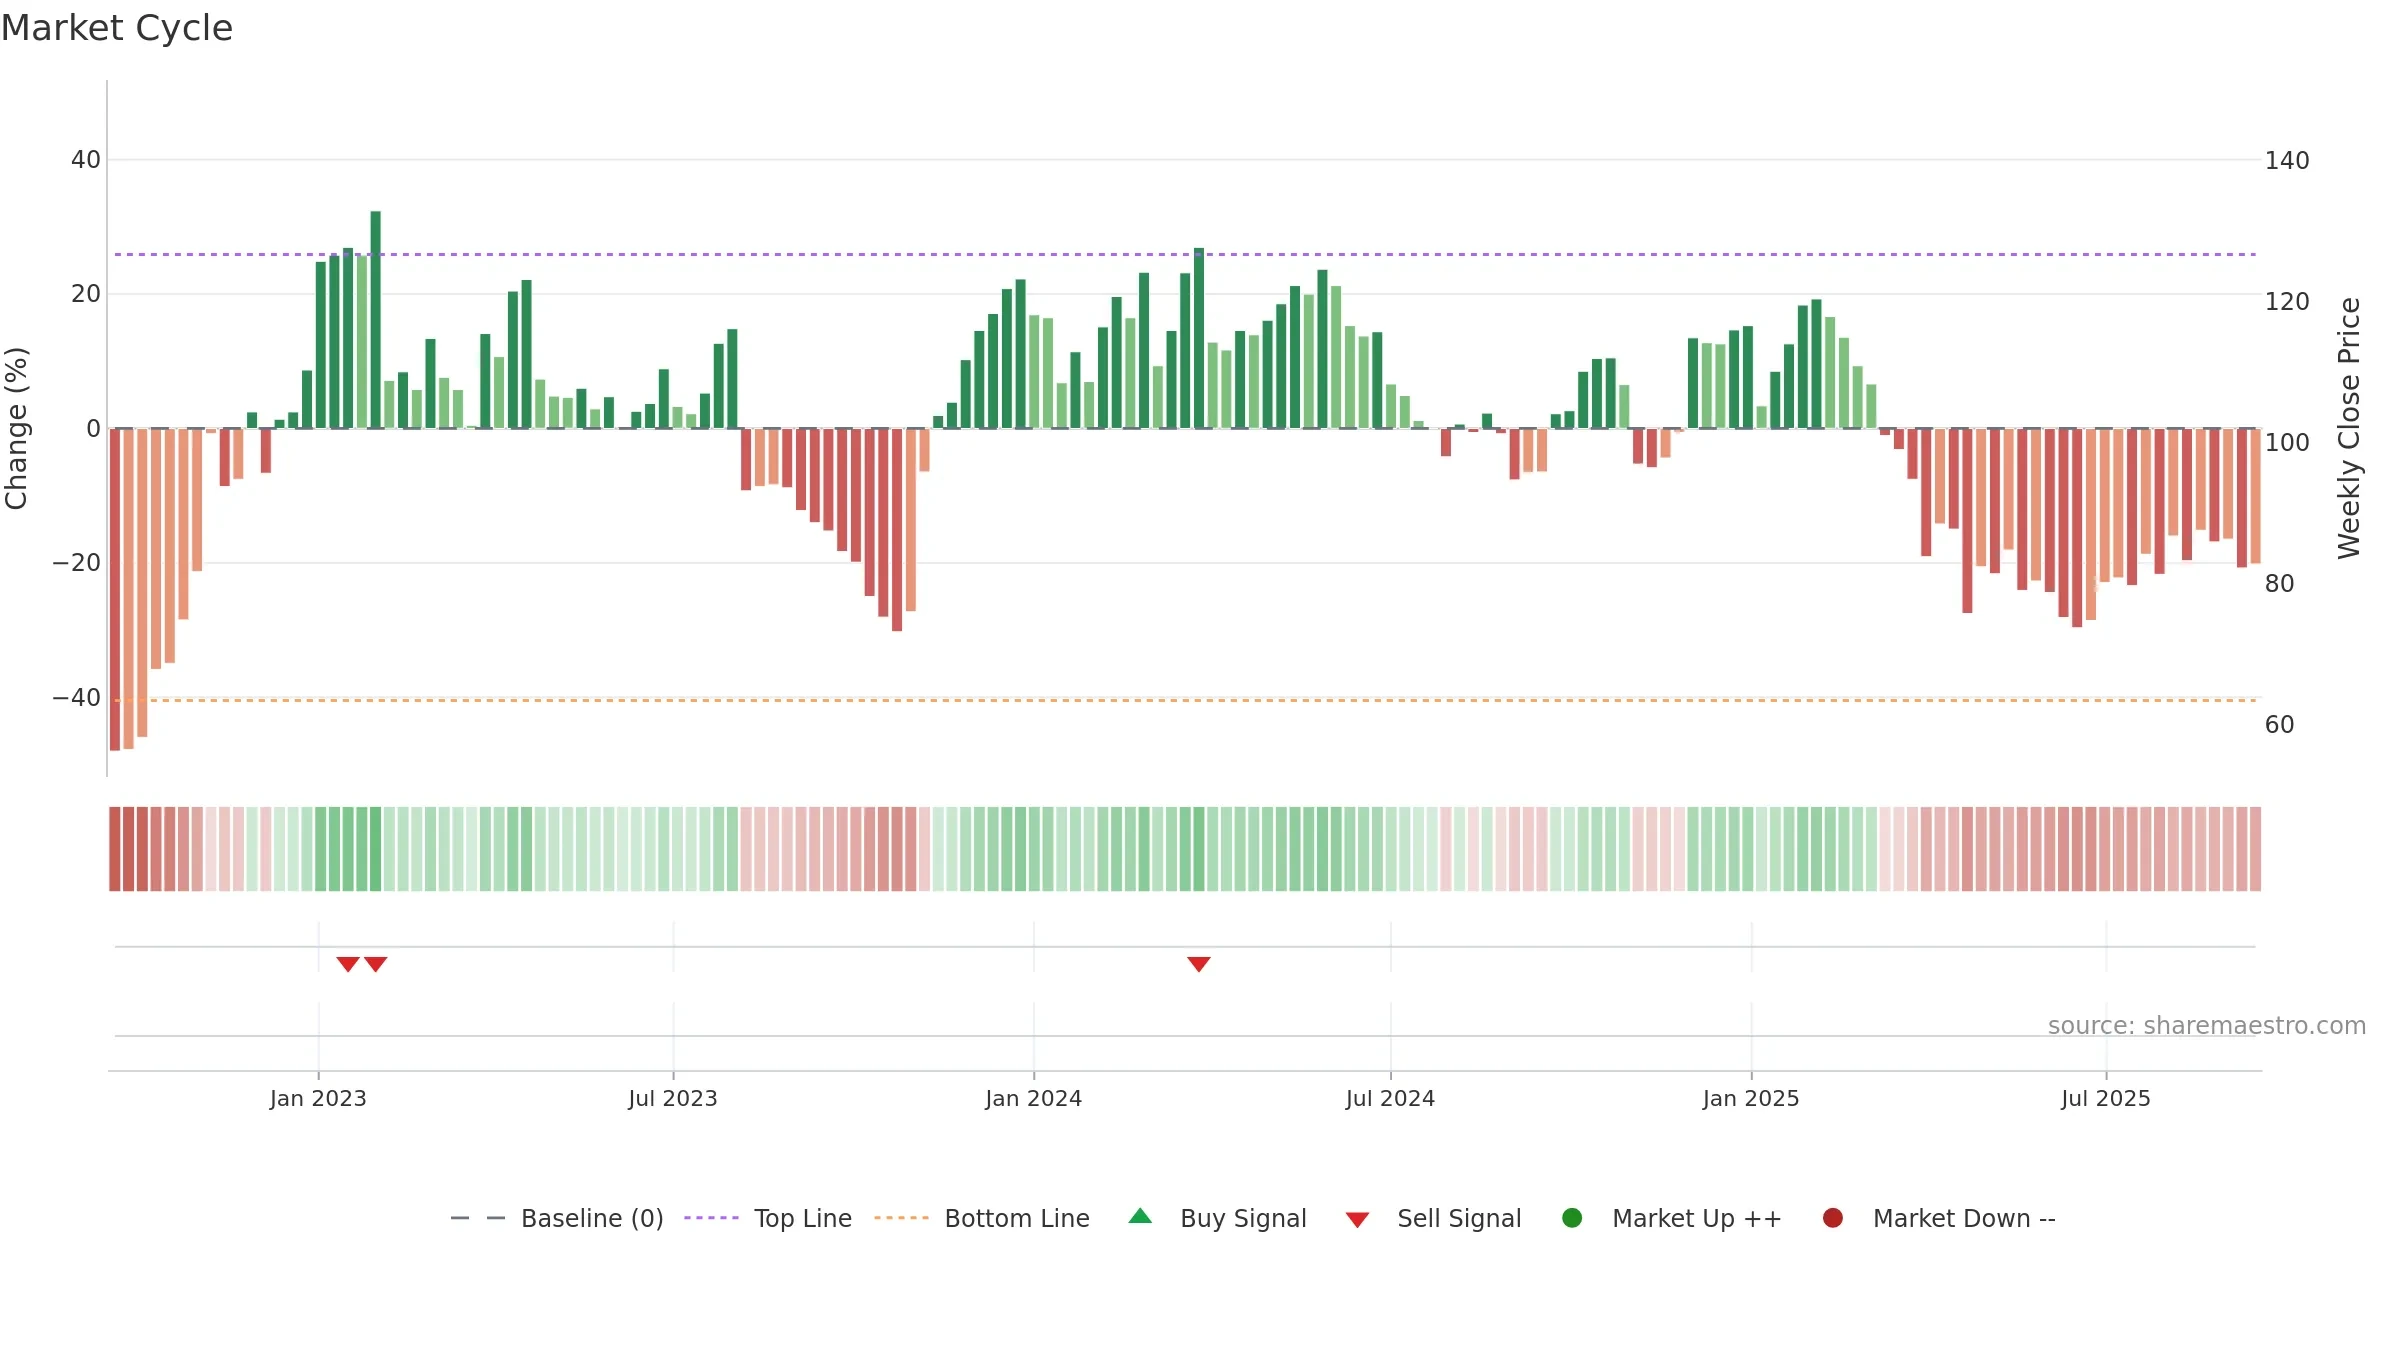
How to read this — Range-bound conditions; conviction is limited until a break or acceleration emerges.
Wait for a directional break or improving acceleration.
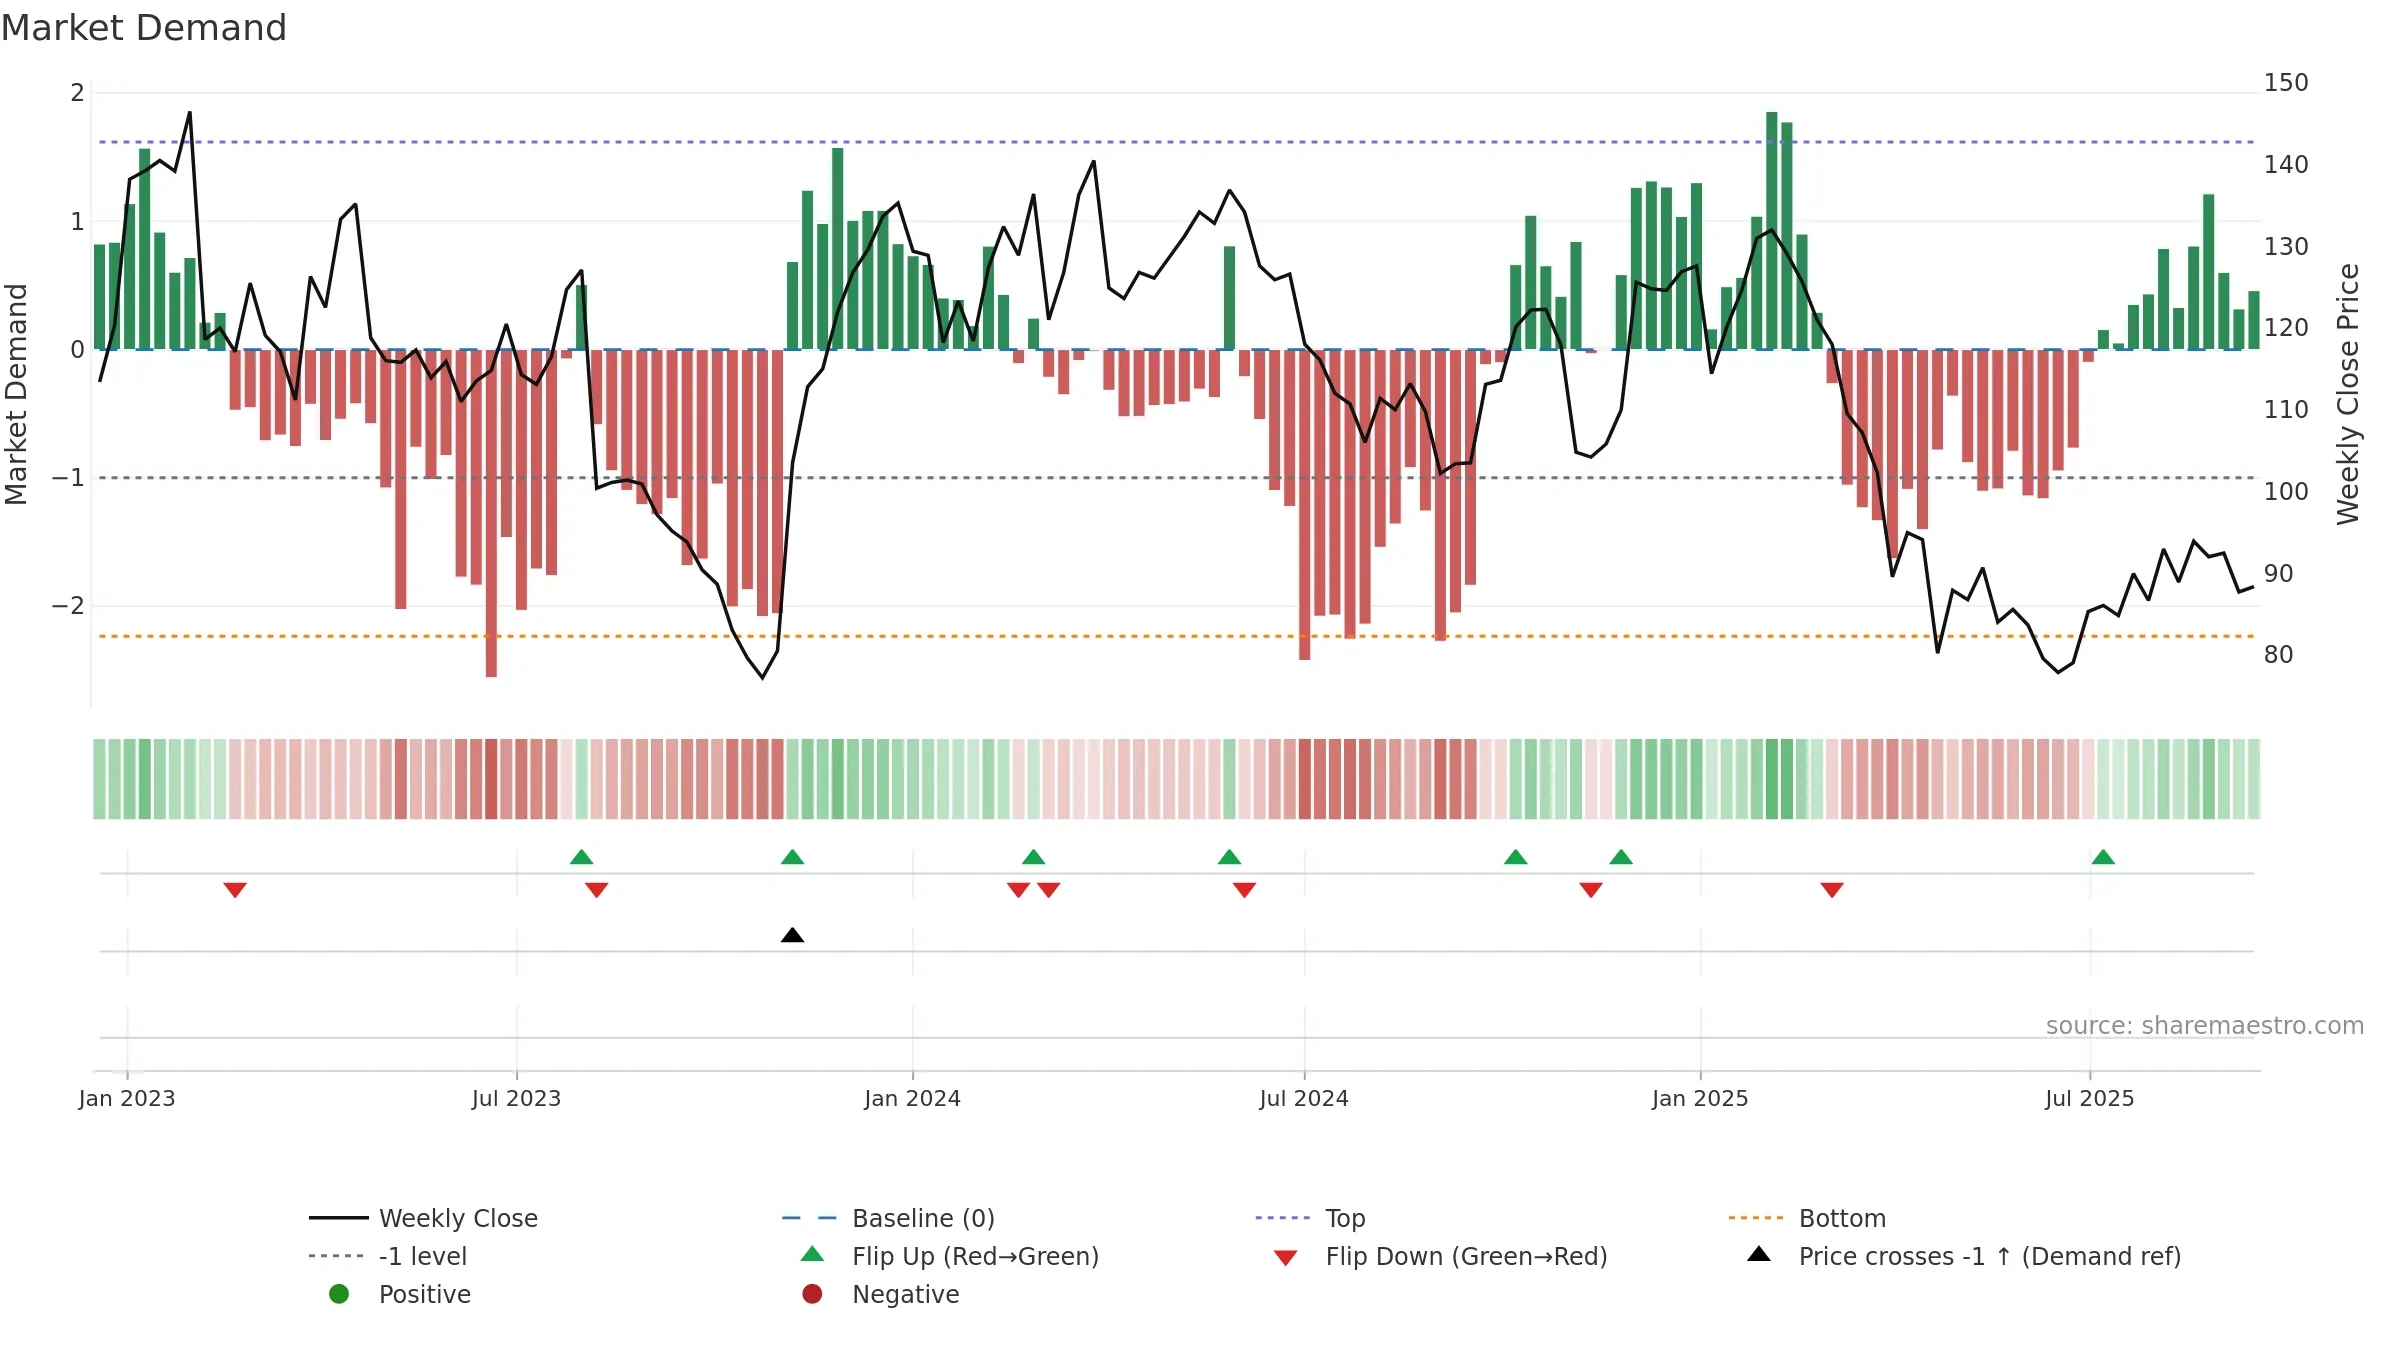
Price is above fair value; upside may be capped without catalysts.
Conclusion
Neutral setup. ★★★☆☆ confidence. Price window: 1. Trend: Range / Neutral; gauge 13. In combination, liquidity confirms the move.
- Liquidity confirms the price trend
- Buyers step in at depressed levels (accumulation)
- Price is not above key averages
- High return volatility raises whipsaw risk
Why: Price window 1.96% over 8w. Close is -5.91% below the prior-window high. Return volatility 4.46%. Volume trend falling. Liquidity convergence with price. Trend state range / neutral. Low-regime (≤0.25) upticks 5/7 (71.0%) • Accumulating. 4–8w crossover bearish. Momentum neutral and rising. Valuation limited upside without catalysts.
Tip: Most metrics include a hover tooltip where they appear in the report.