Semler Scientific, Inc.
SMLR NASDAQ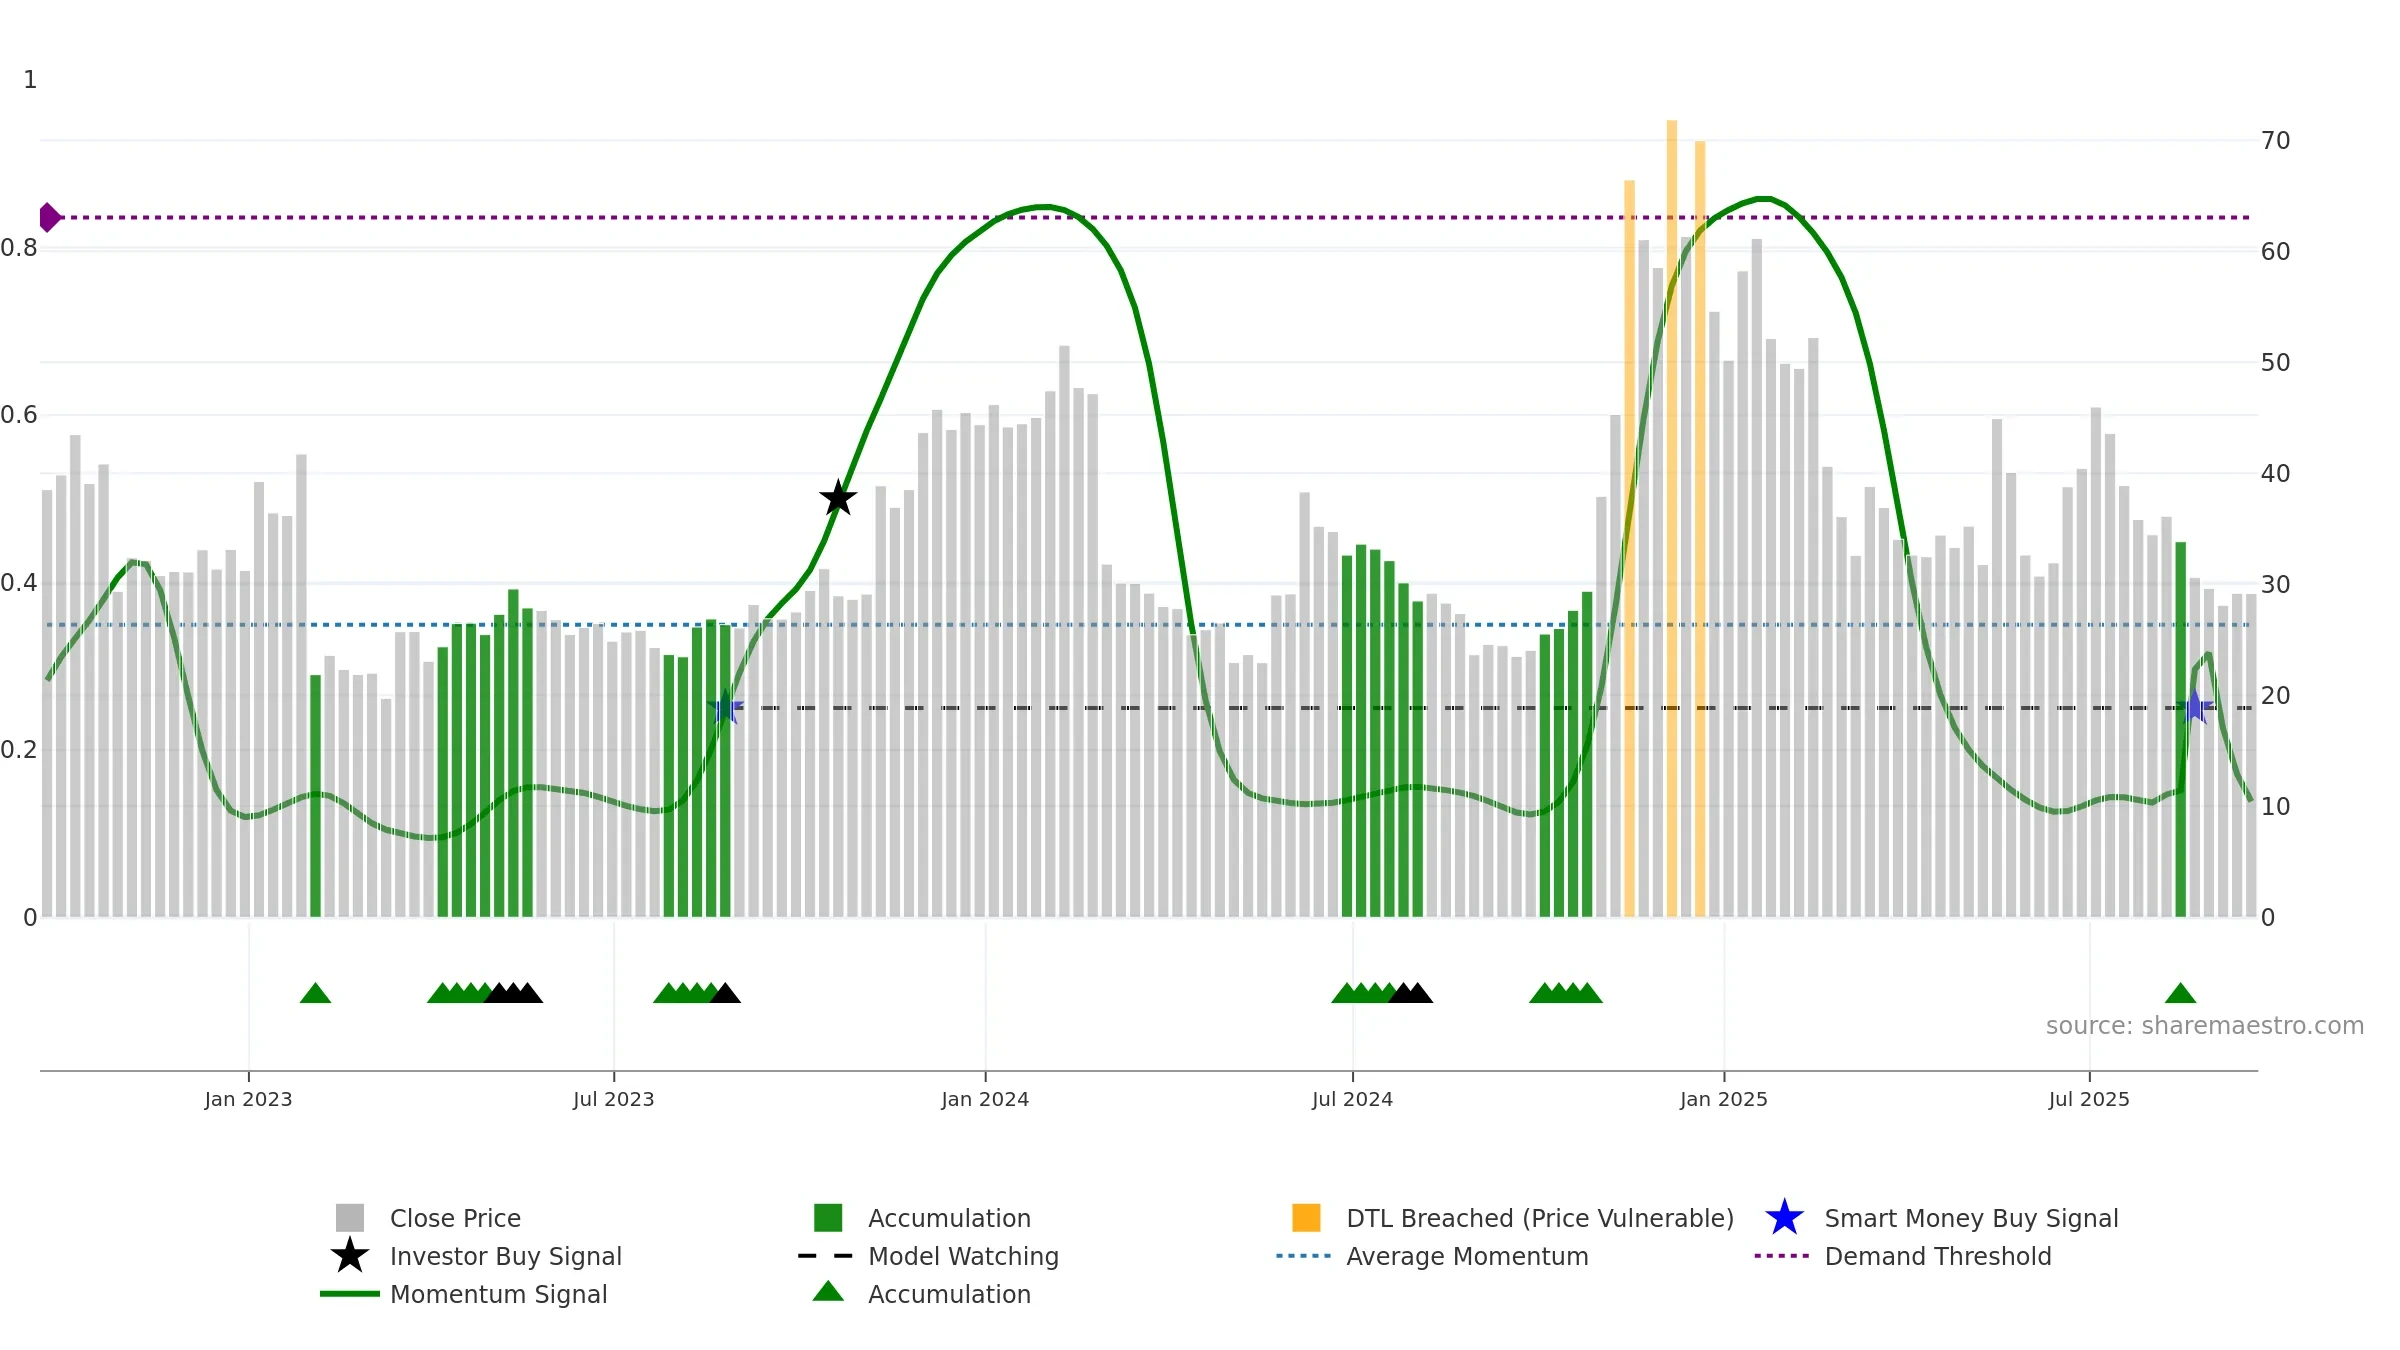
Weekly Report
Semler Scientific, Inc. closed at 29.1800 (1.14% WoW) . Data window ends Fri, 19 Sep 2025.
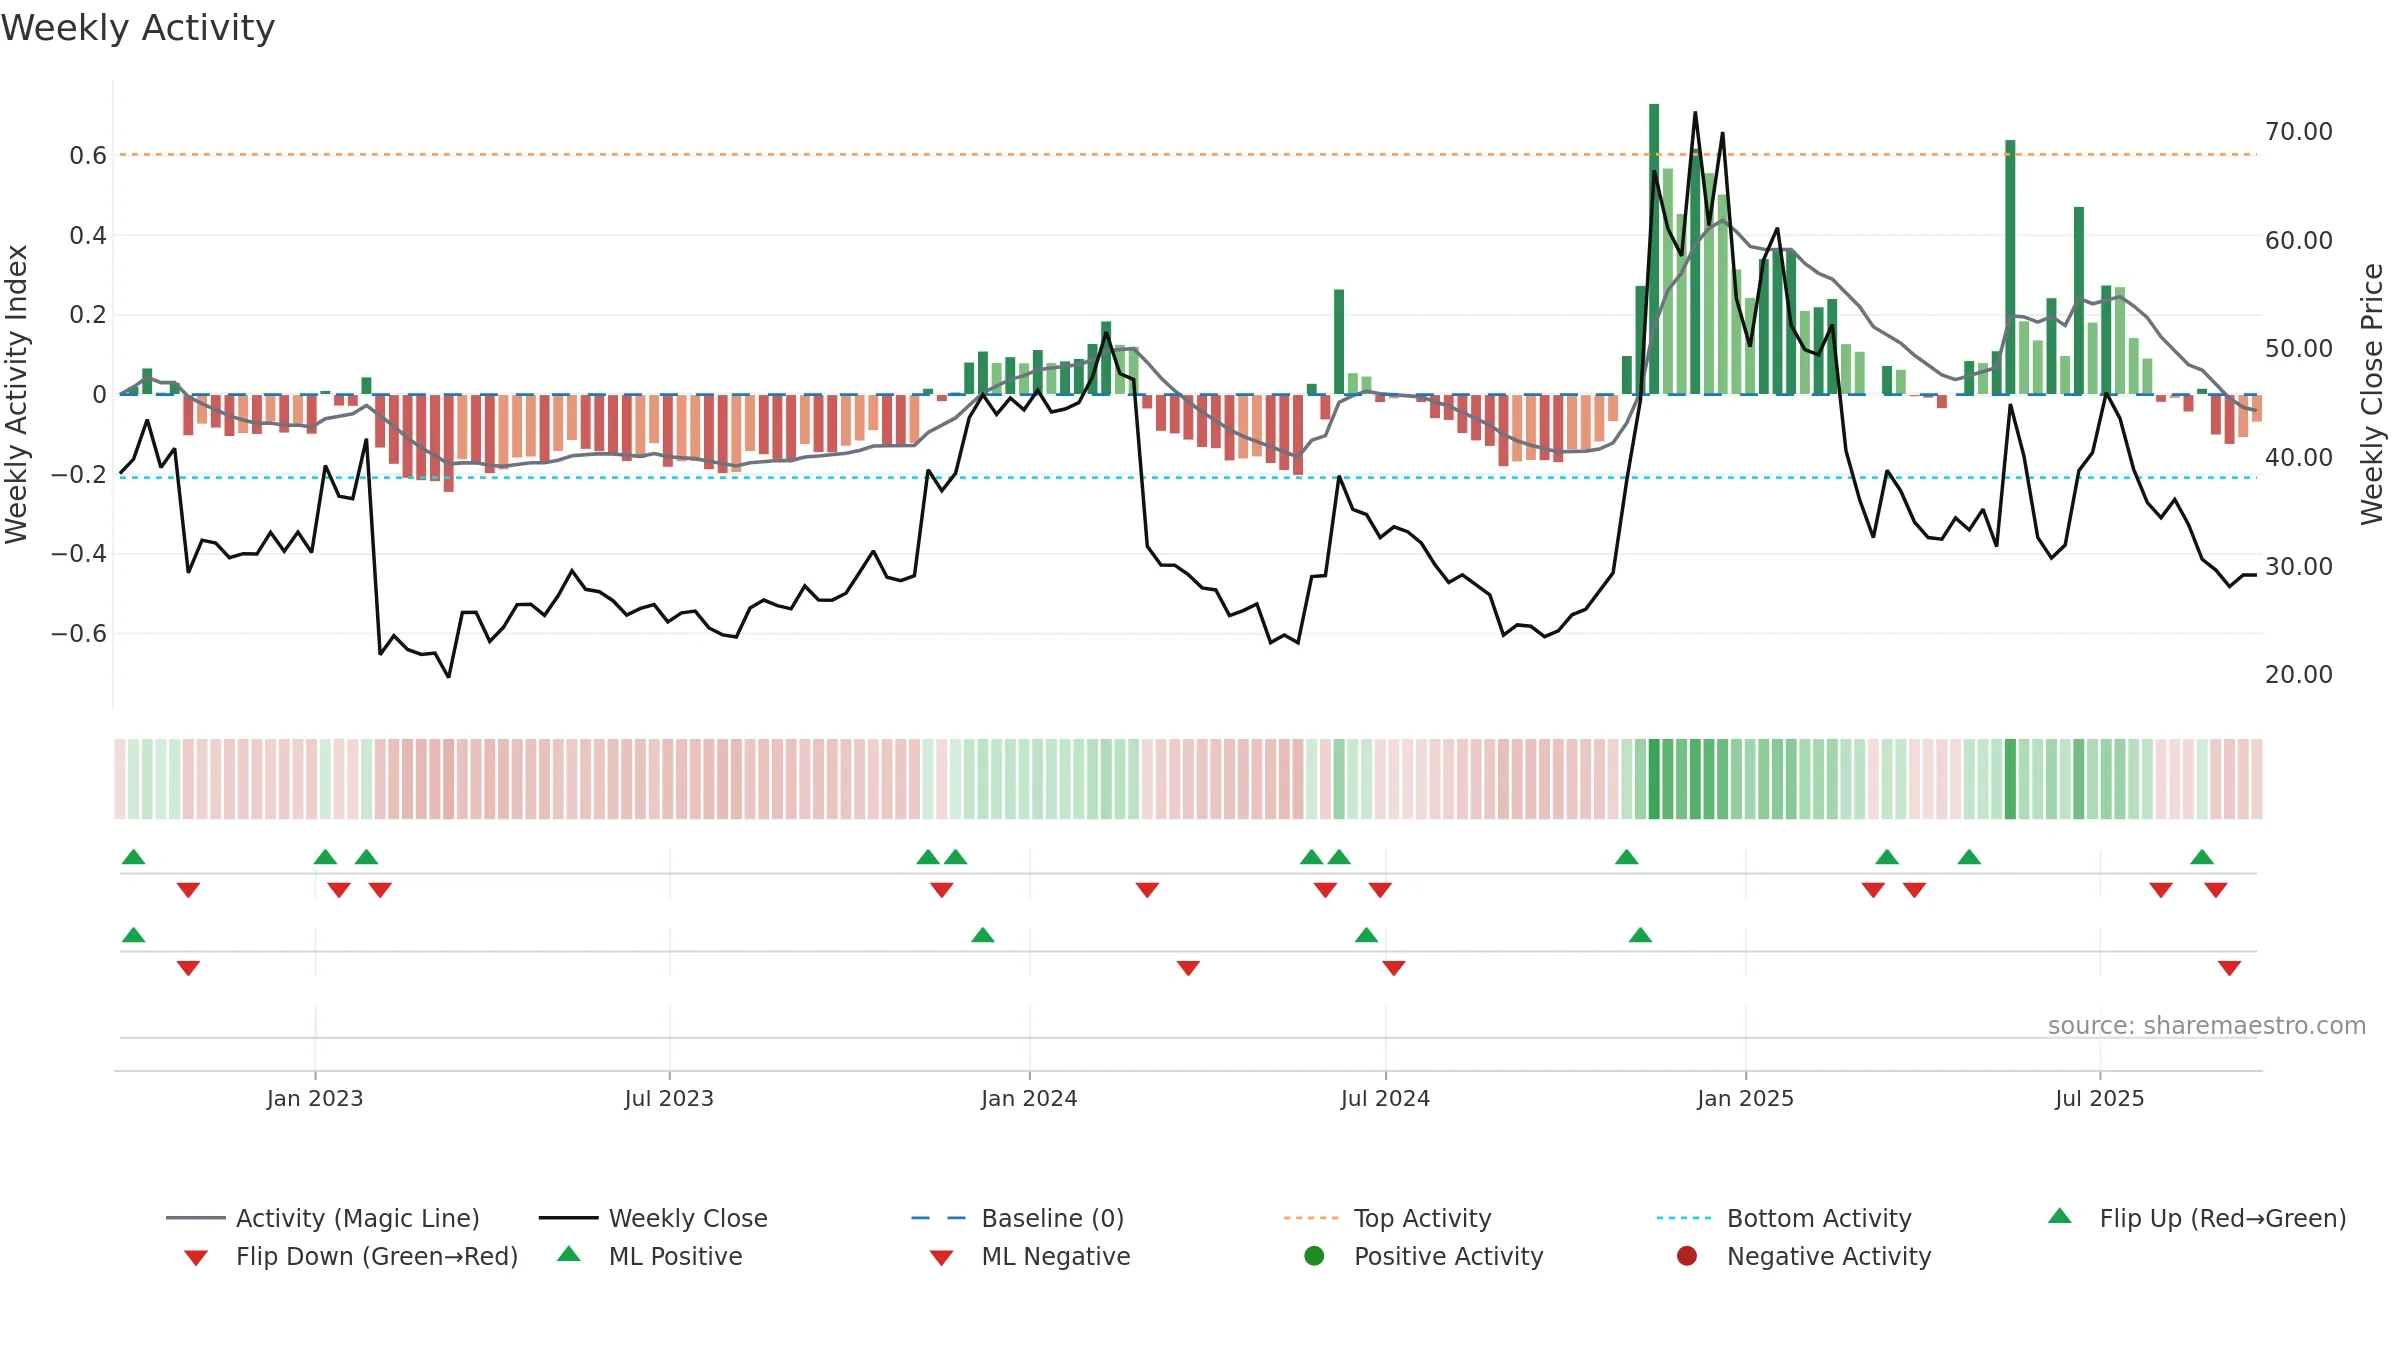
How to read this — Price slope is downward, indicating persistent supply pressure. Volume trend diverges from price — watch for fatigue or rotation. Returns are positively correlated with volume — strength tends to arrive on higher activity. Price sits below key averages, keeping pressure on the tape.
Down-slope argues for patience; rallies can fade sooner unless participation improves. Because liquidity isn’t confirming, prefer evidence of fresh demand before chasing moves.
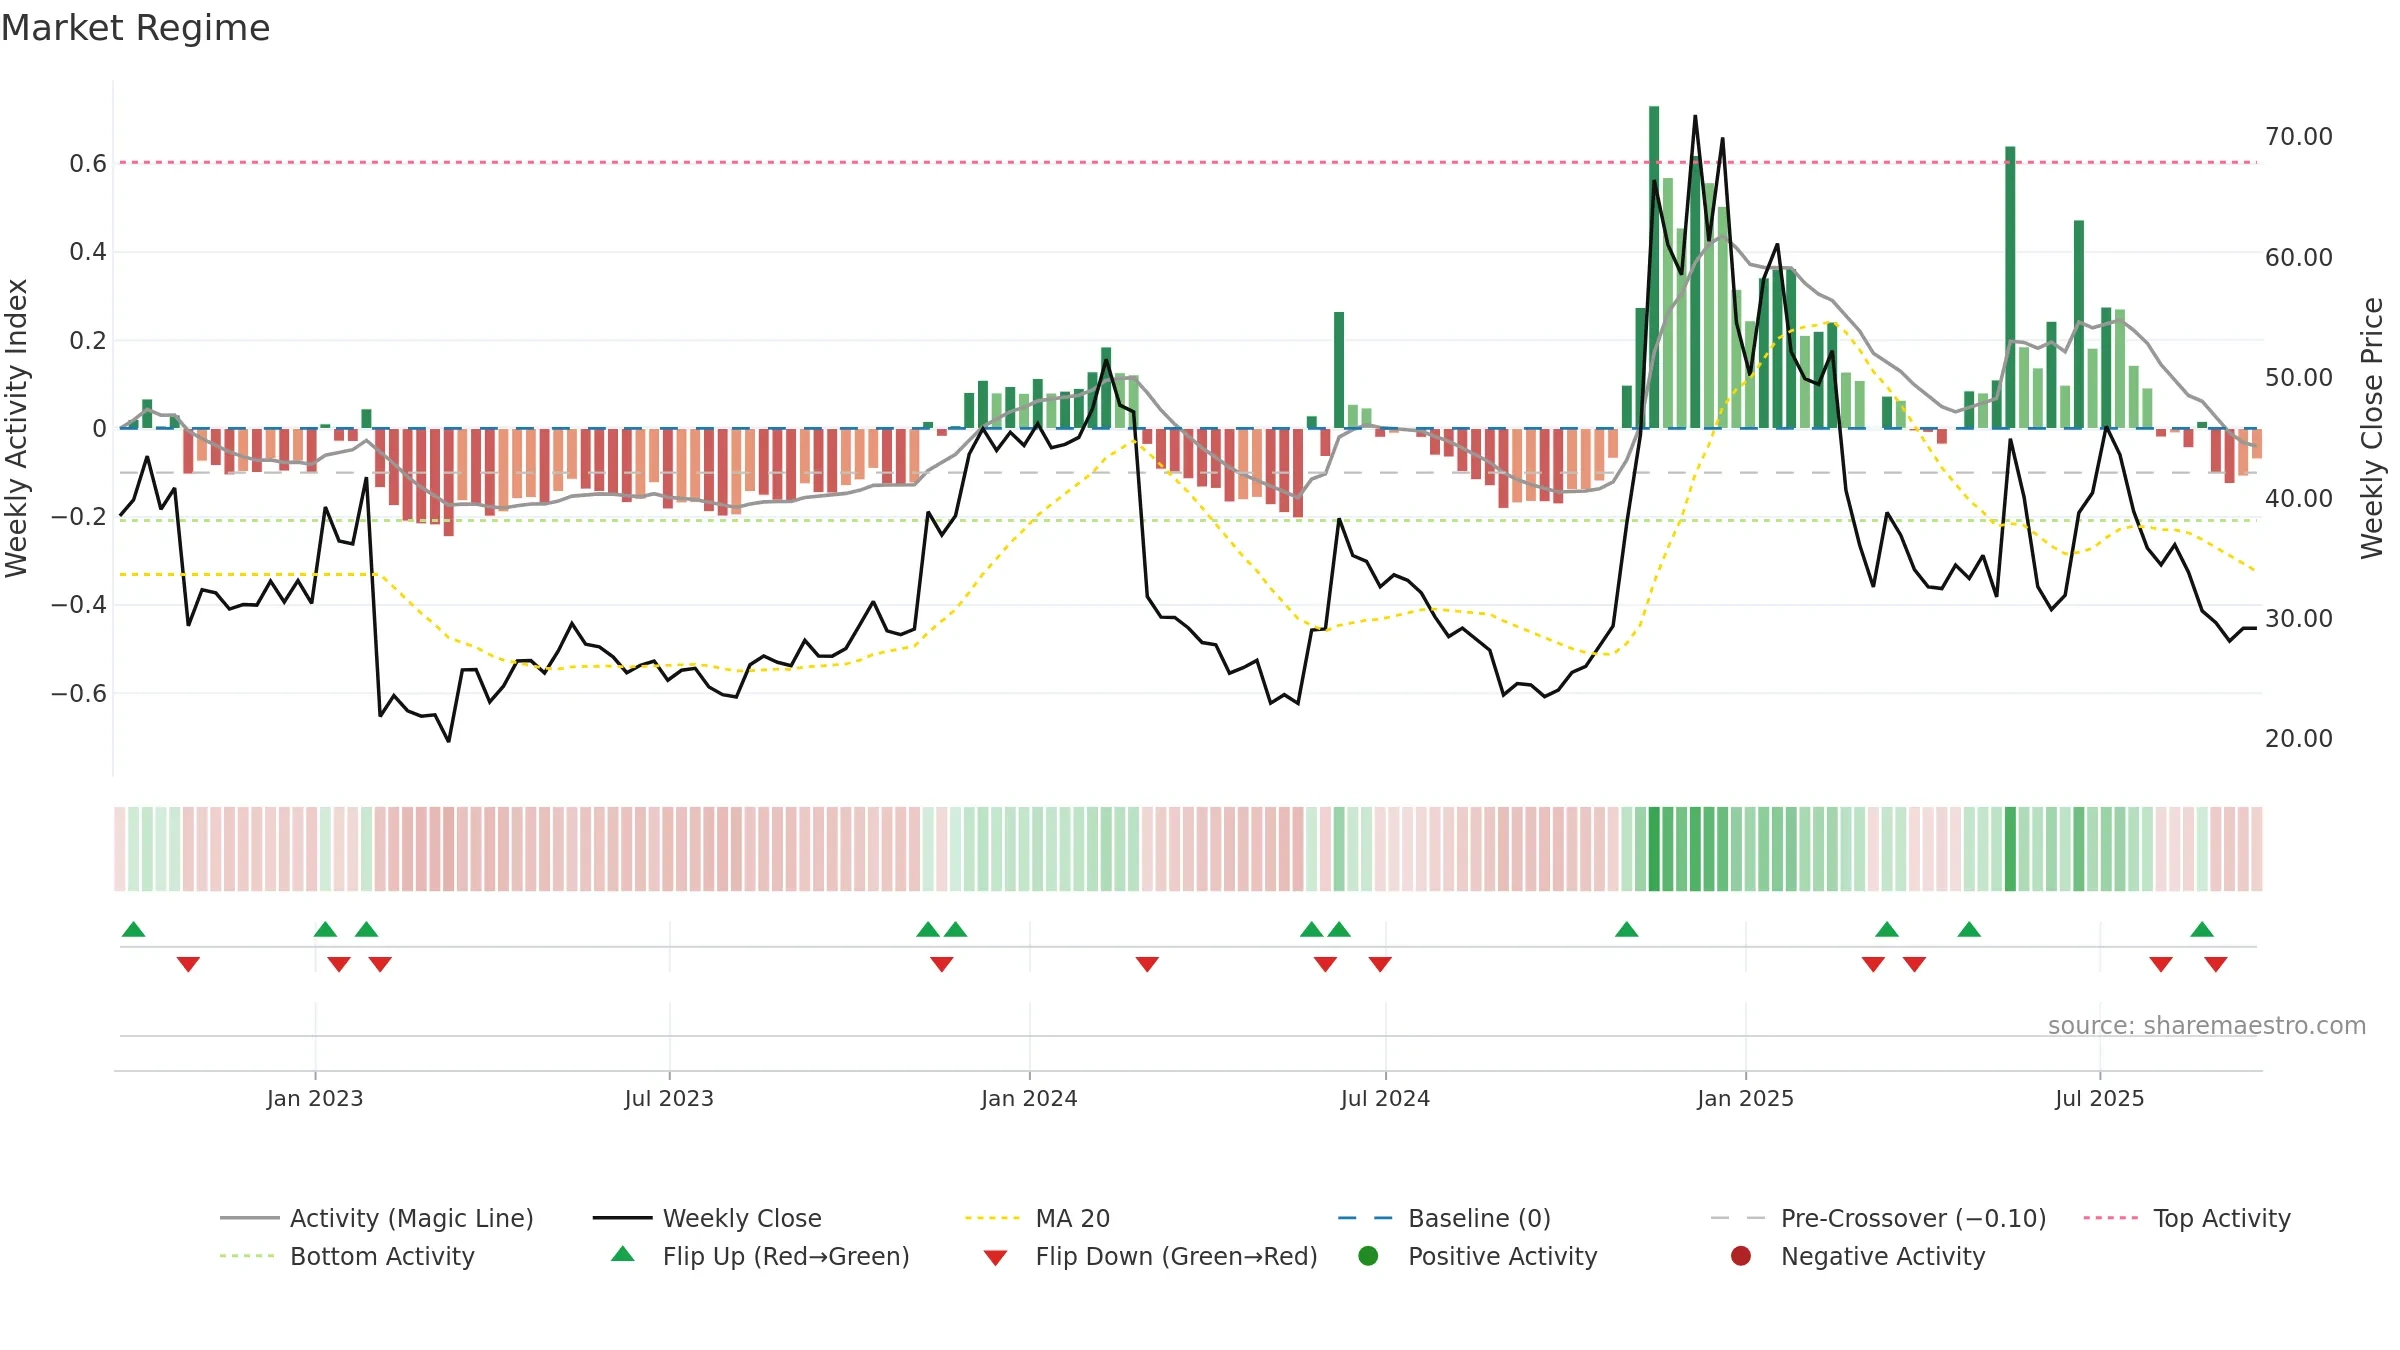
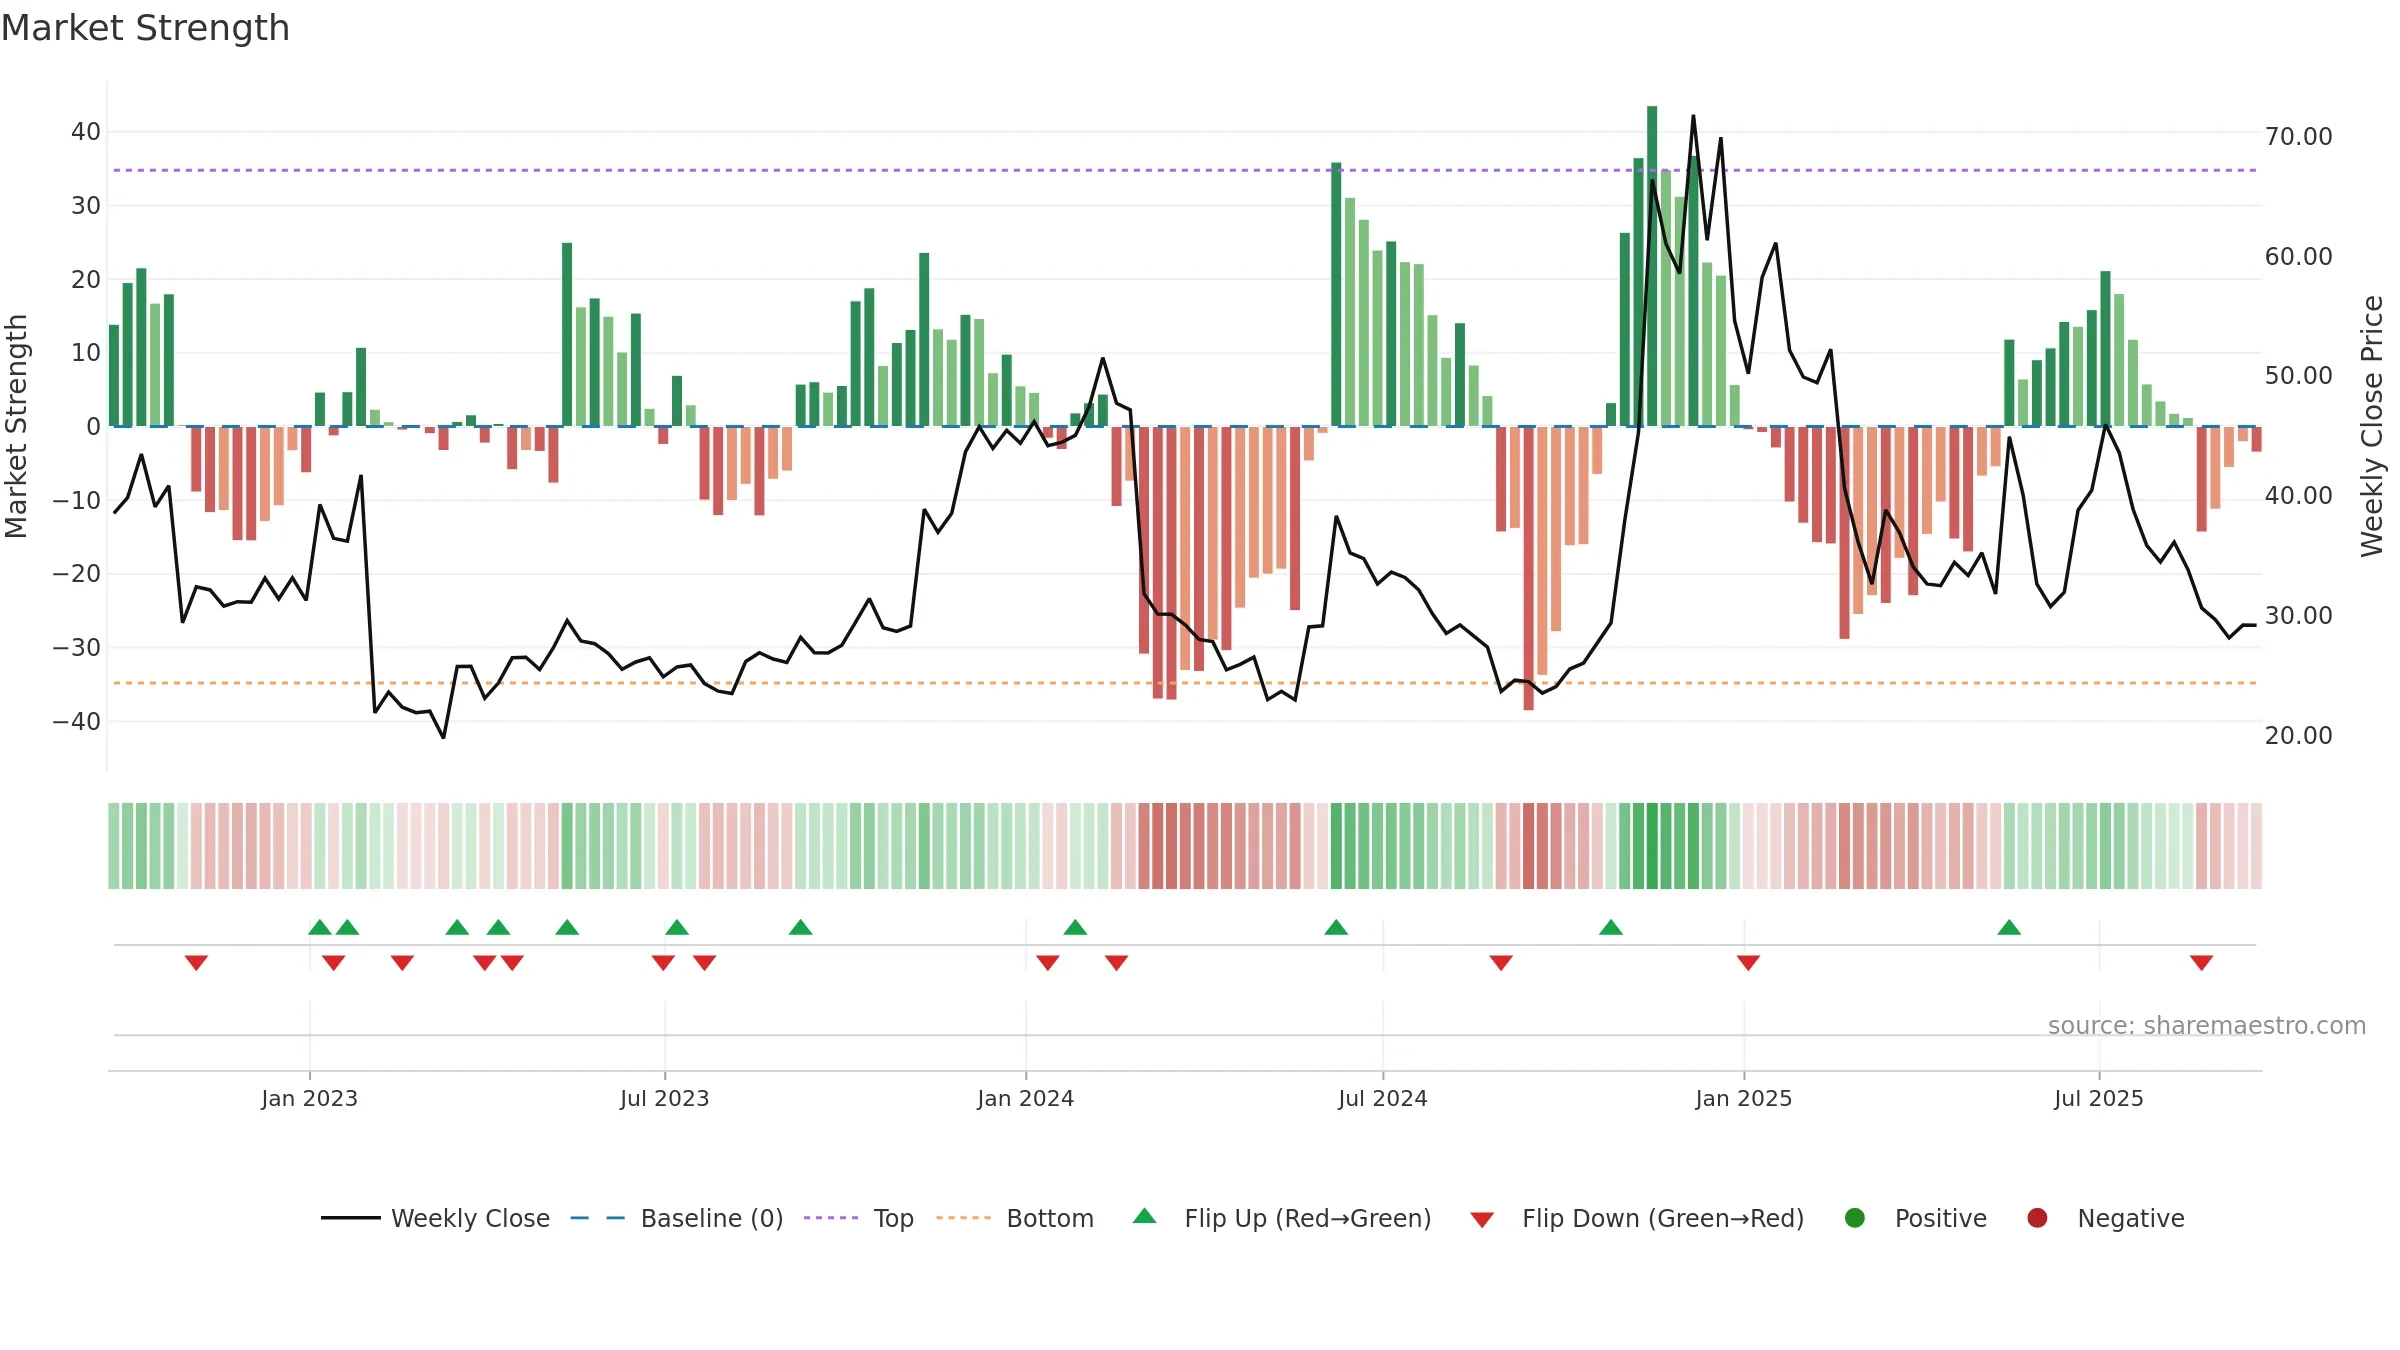
Gauge maps the trend signal to a 0–100 scale.
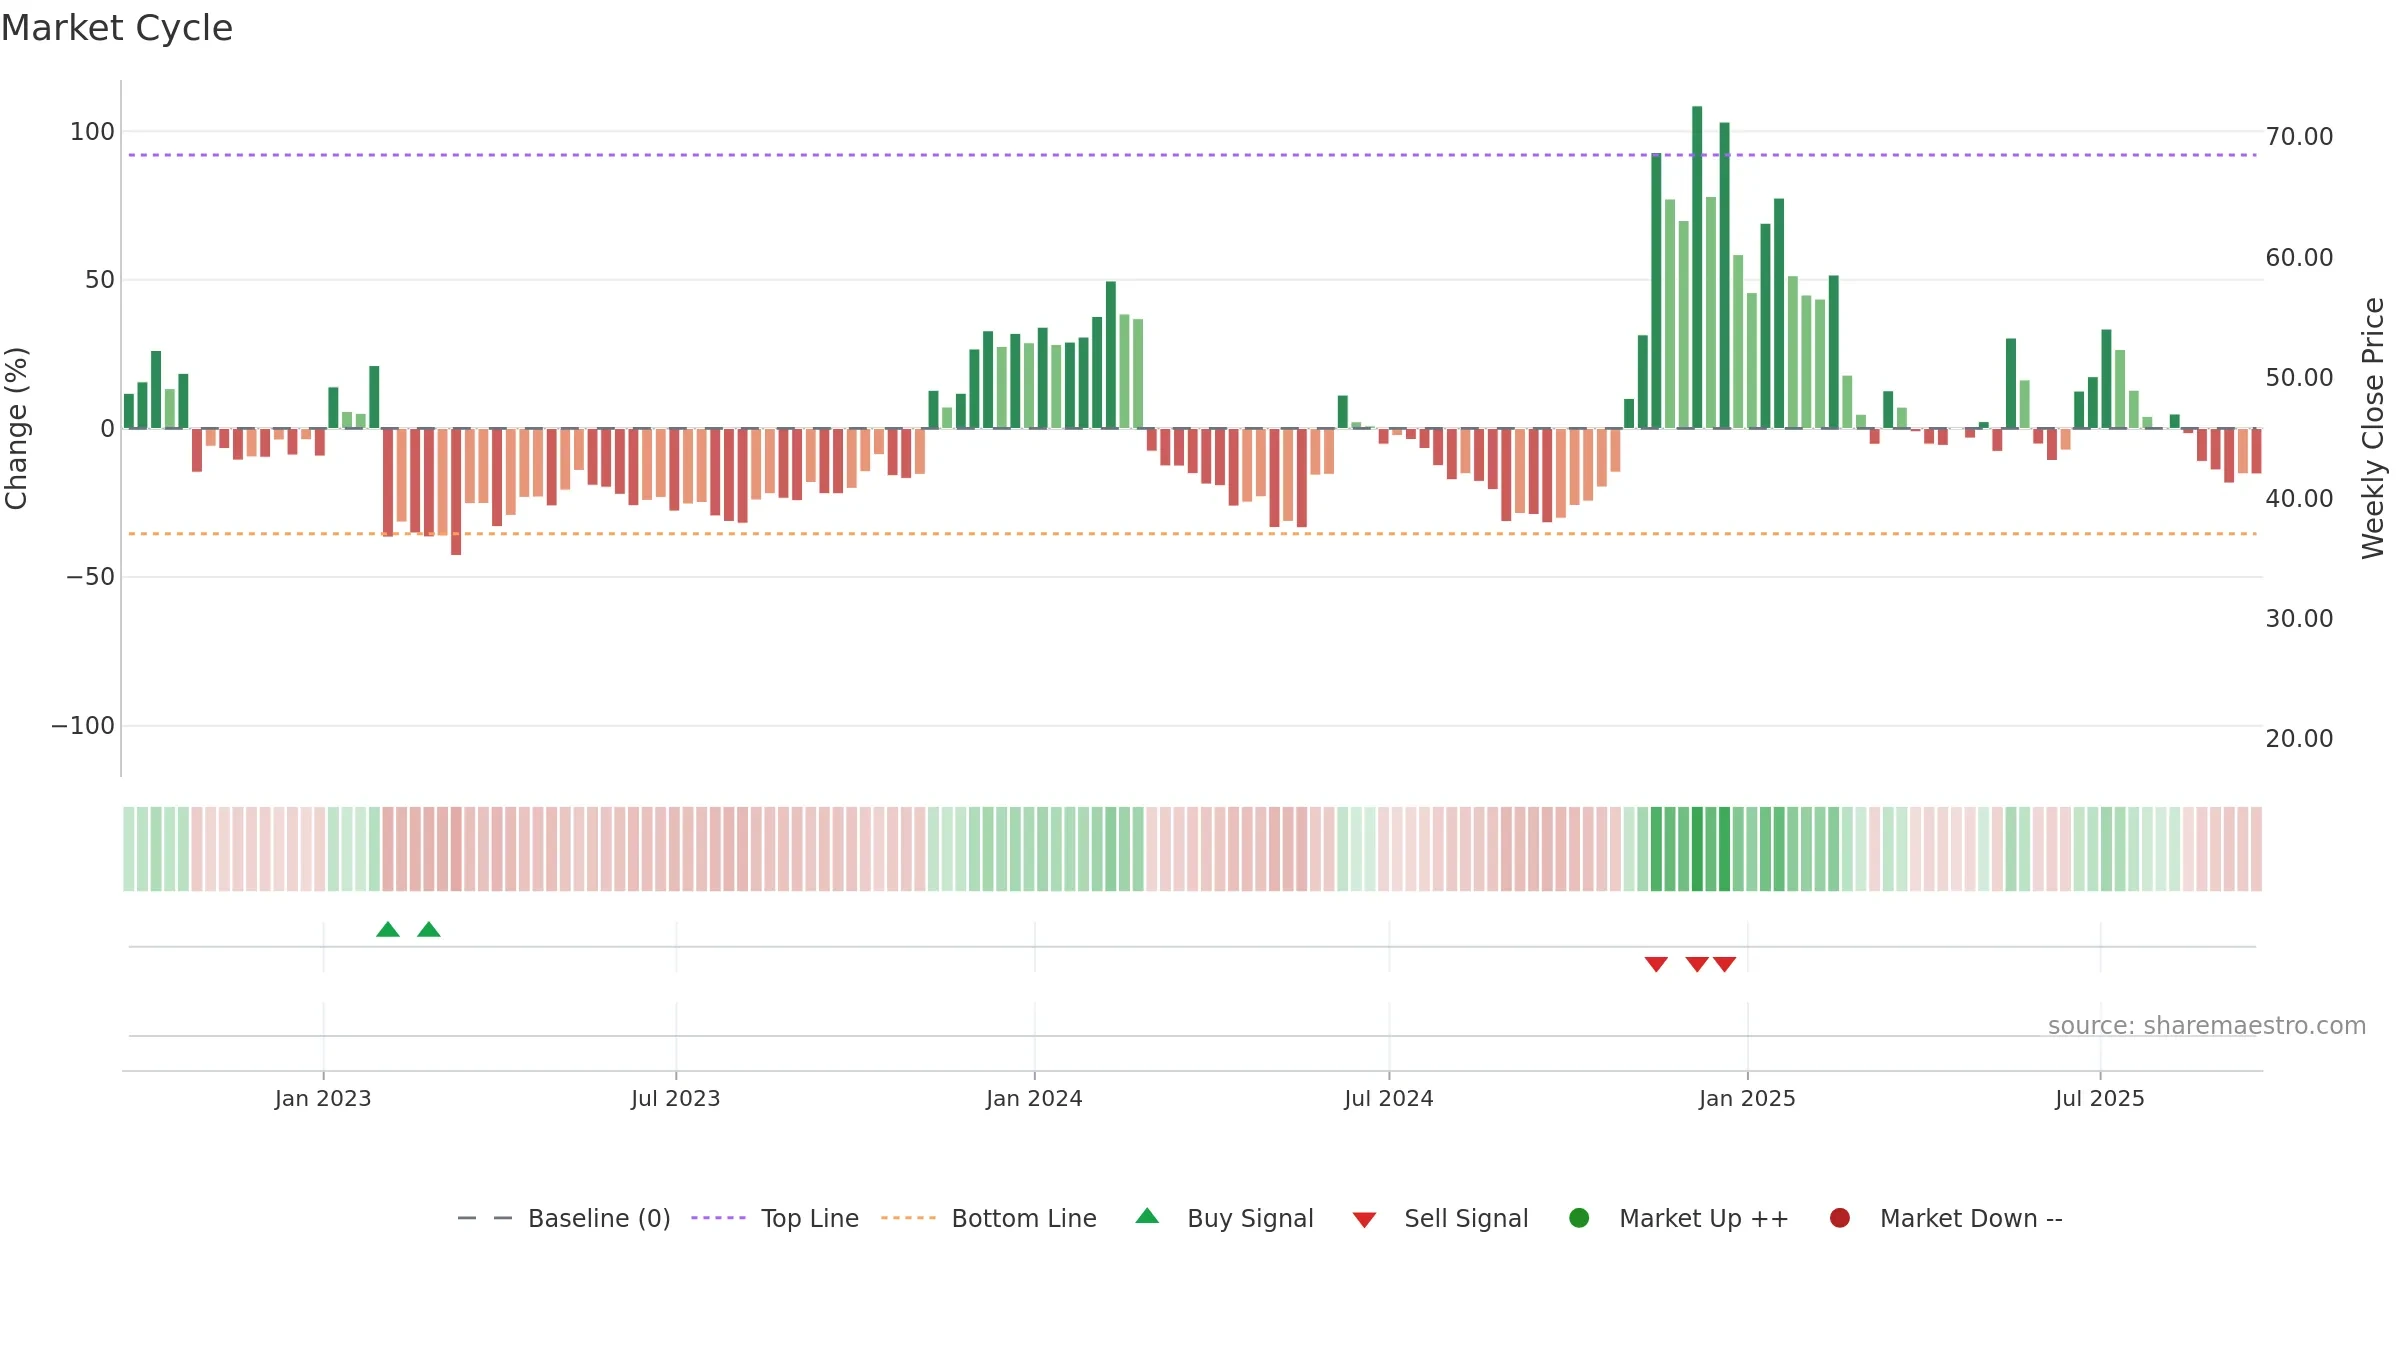
How to read this — Range-bound conditions; conviction is limited until a break or acceleration emerges.
Wait for a directional break or improving acceleration.
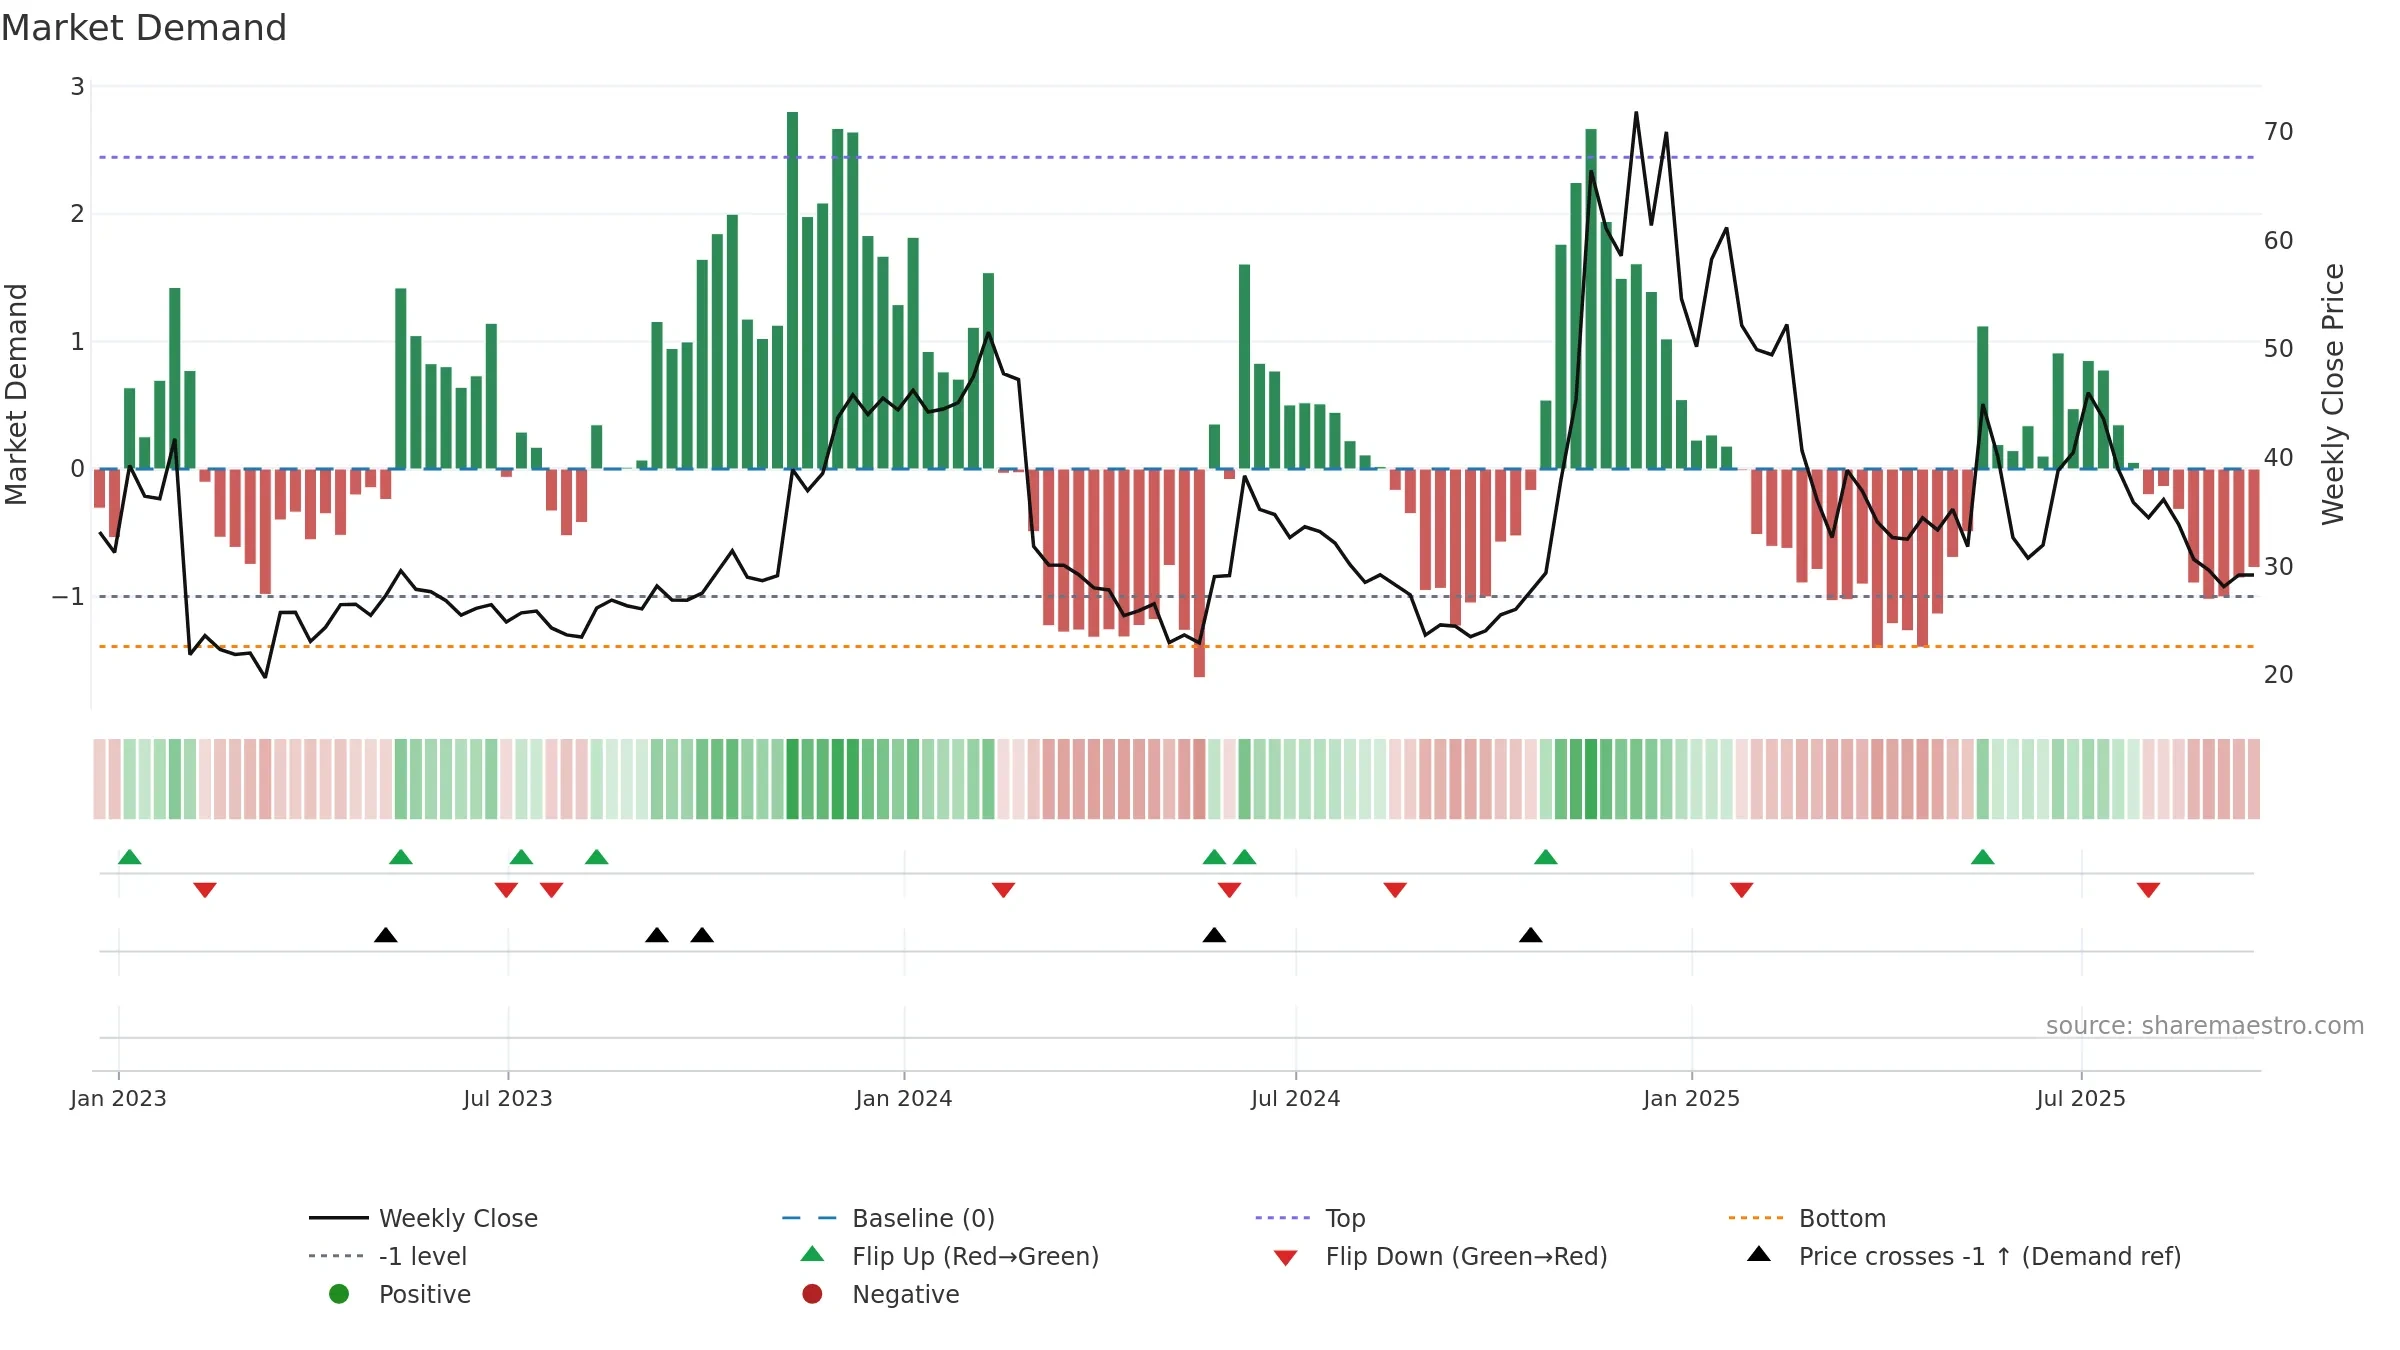
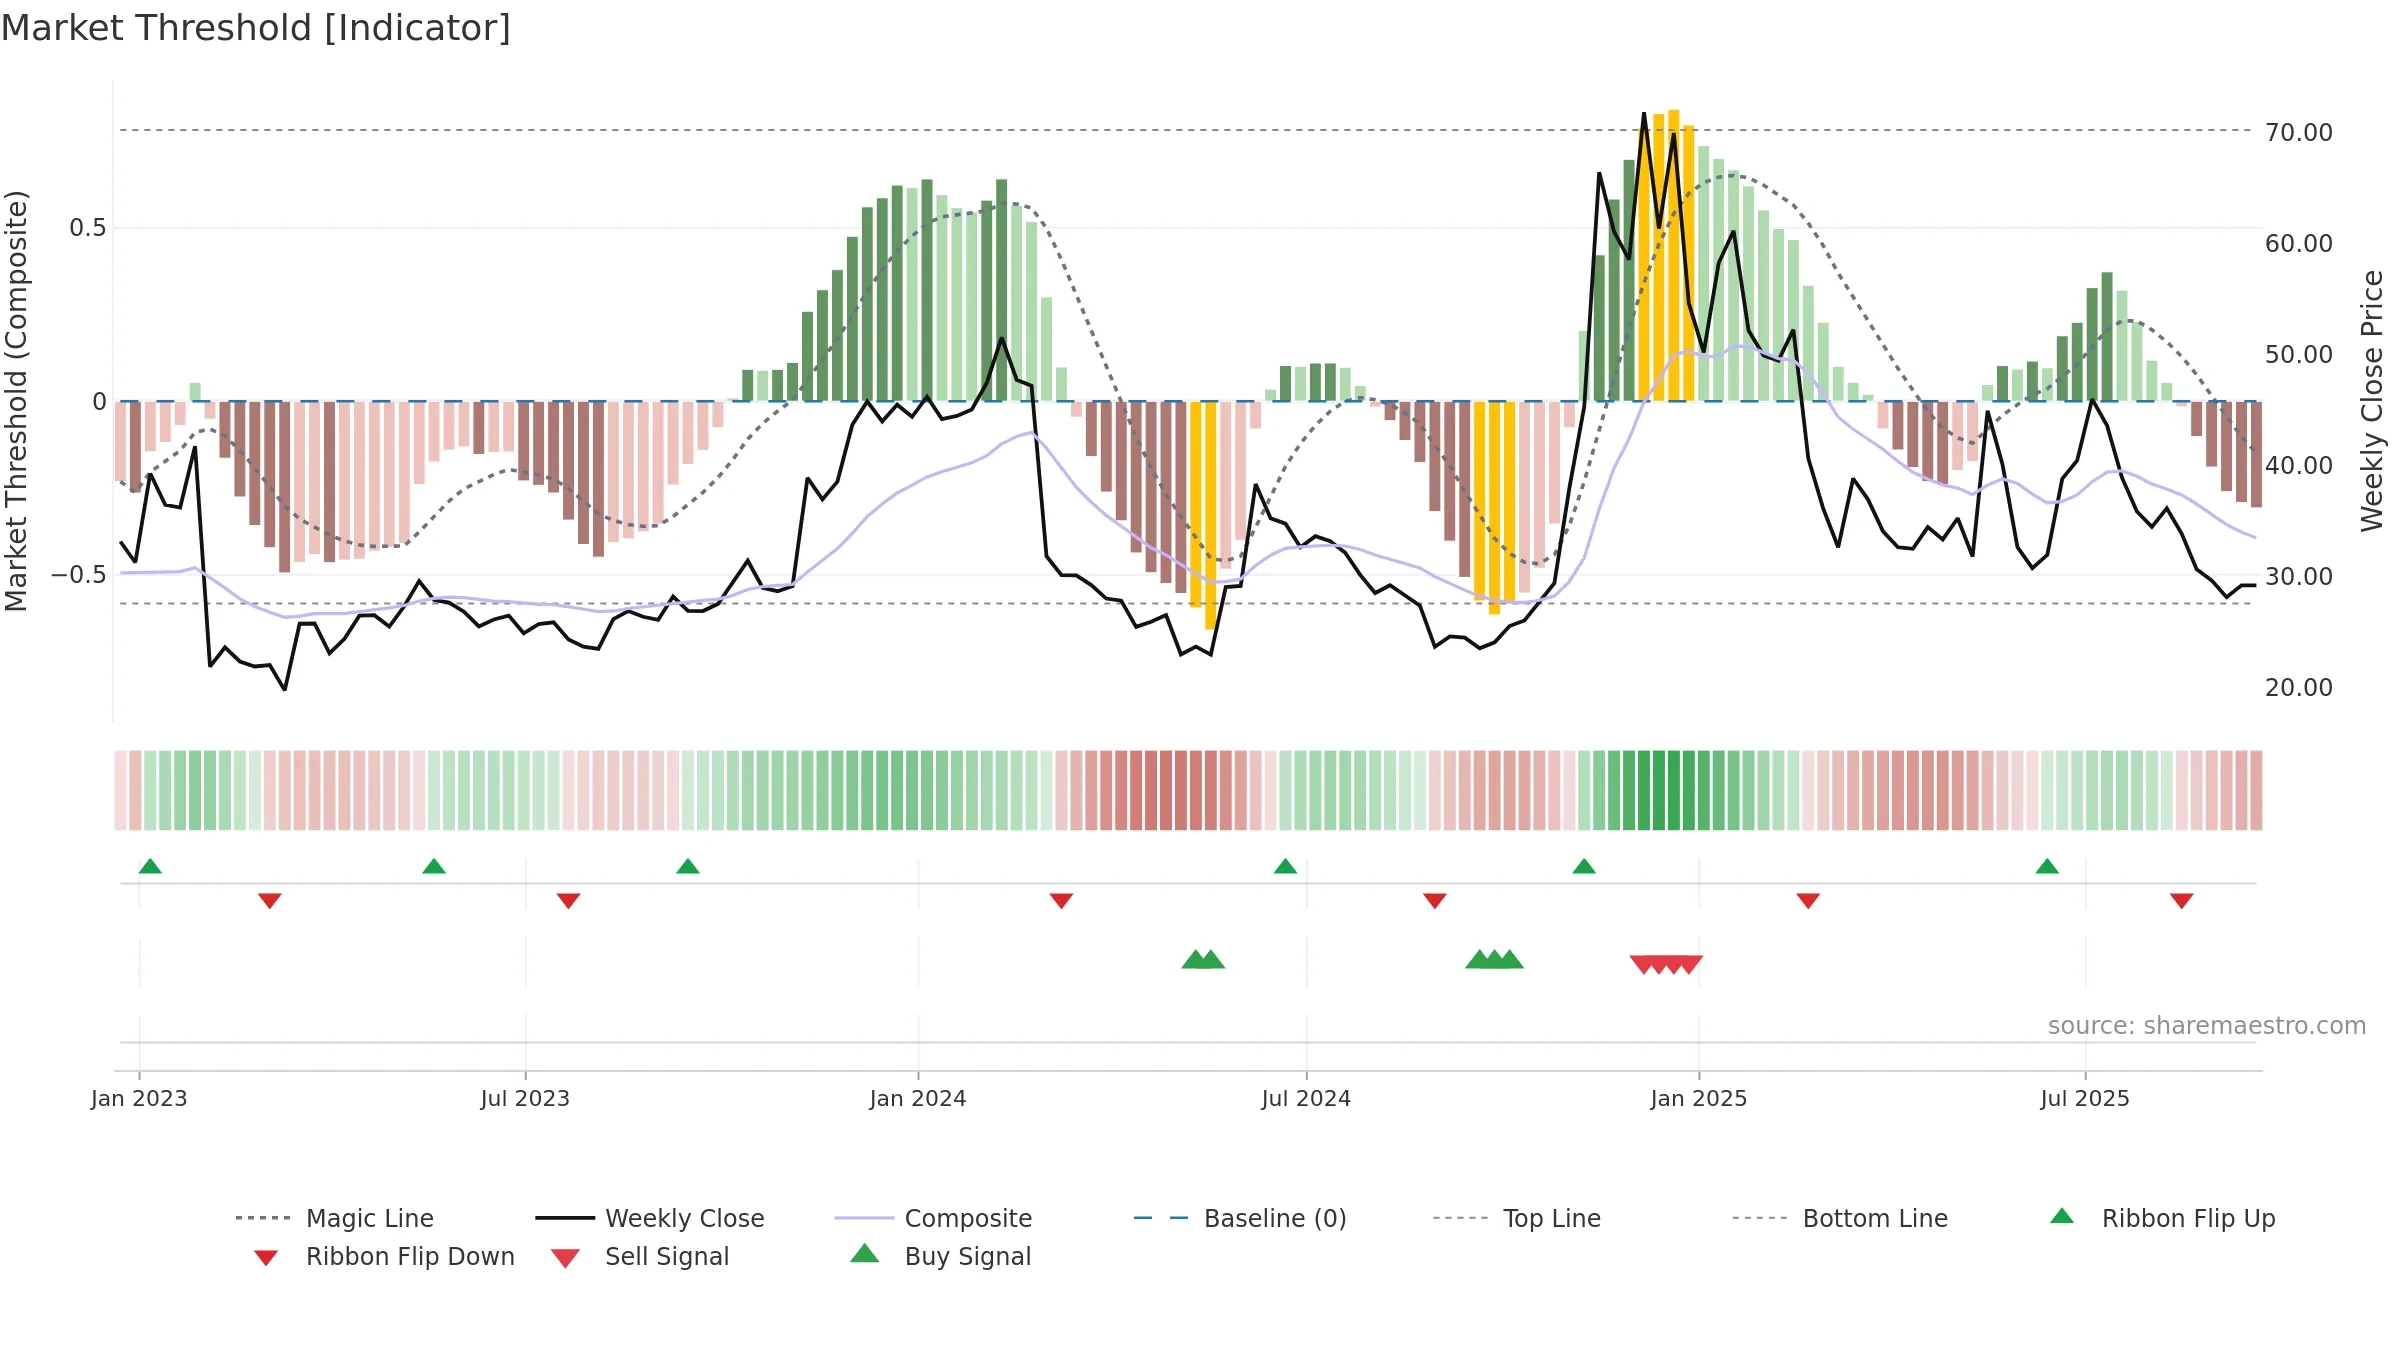
Price is above fair value; upside may be capped without catalysts.
Conclusion
Negative setup. ★★☆☆☆ confidence. Price window: -15. Trend: Range / Neutral; gauge 13. In combination, liquidity diverges from price.
- Buyers step in at depressed levels (accumulation)
- Momentum is weak/falling
- Price is not above key averages
- Liquidity diverges from price
- Negative multi-week performance
Why: Price window -15.32% over 8w. Close is -19.24% below the prior-window high. Return volatility 2.25%. Volume trend rising. Liquidity divergence with price. Trend state range / neutral. Low-regime (≤0.25) upticks 3/5 (60.0%) • Accumulating. Momentum bearish and rising. Valuation limited upside without catalysts.
Tip: Most metrics include a hover tooltip where they appear in the report.