AirJoule Technologies Corporation
AIRJ NASDAQ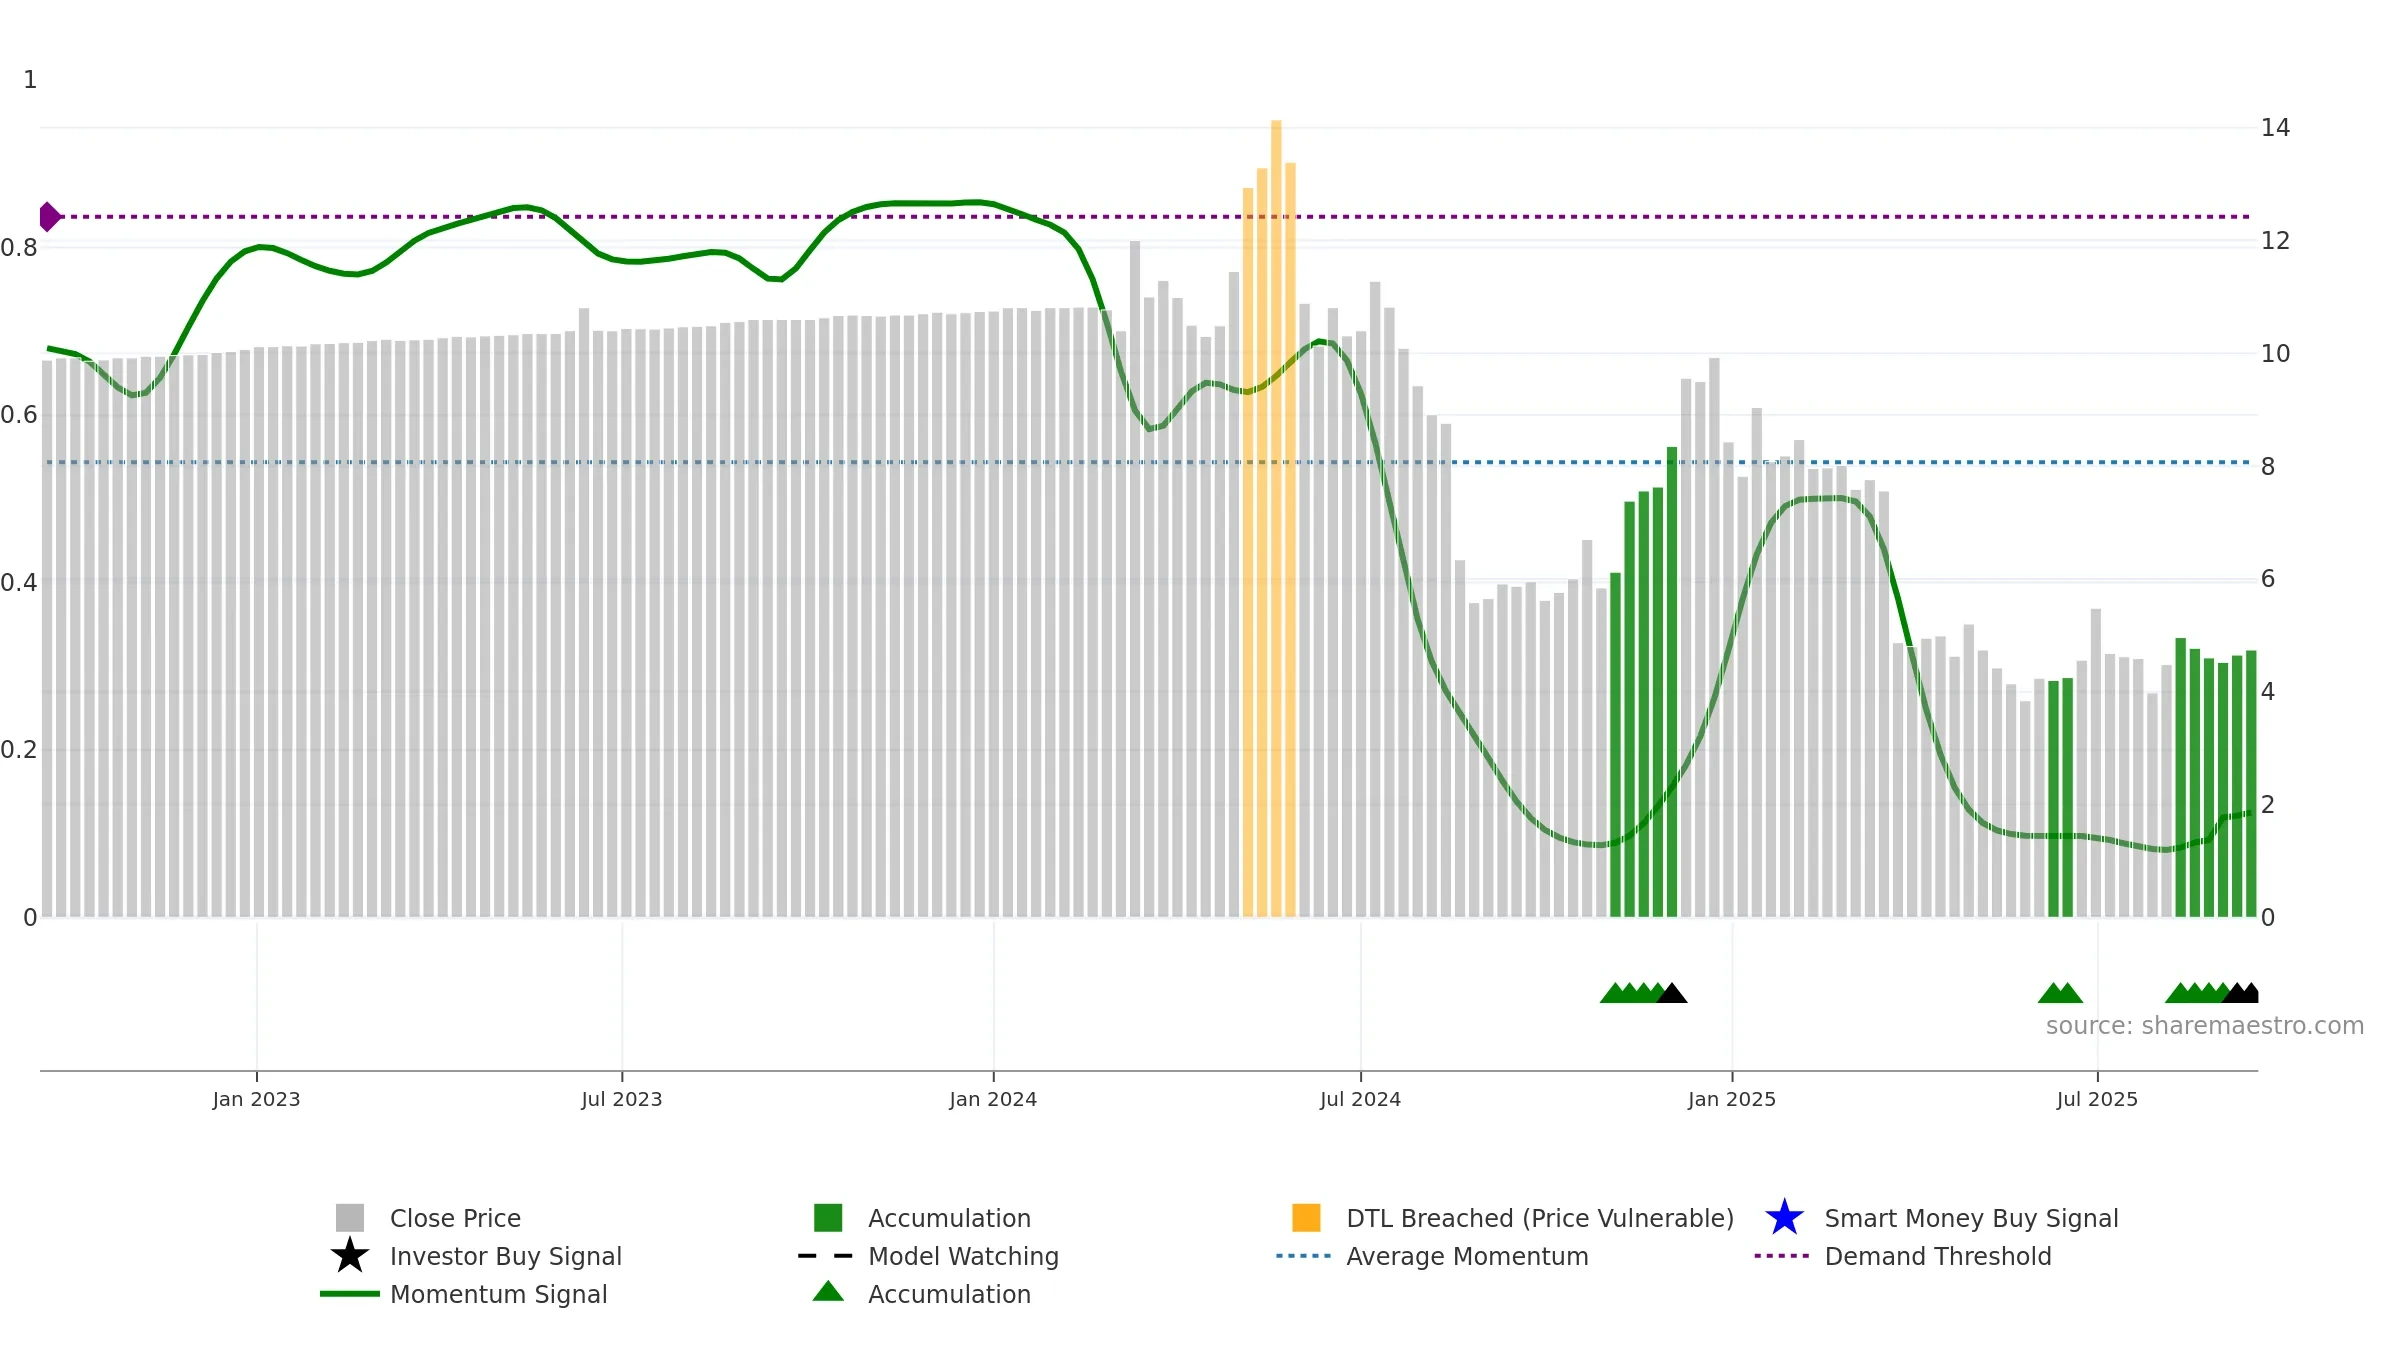
Weekly Report
AirJoule Technologies Corporation closed at 4.7400 (1.72% WoW) . Data window ends Mon, 15 Sep 2025.
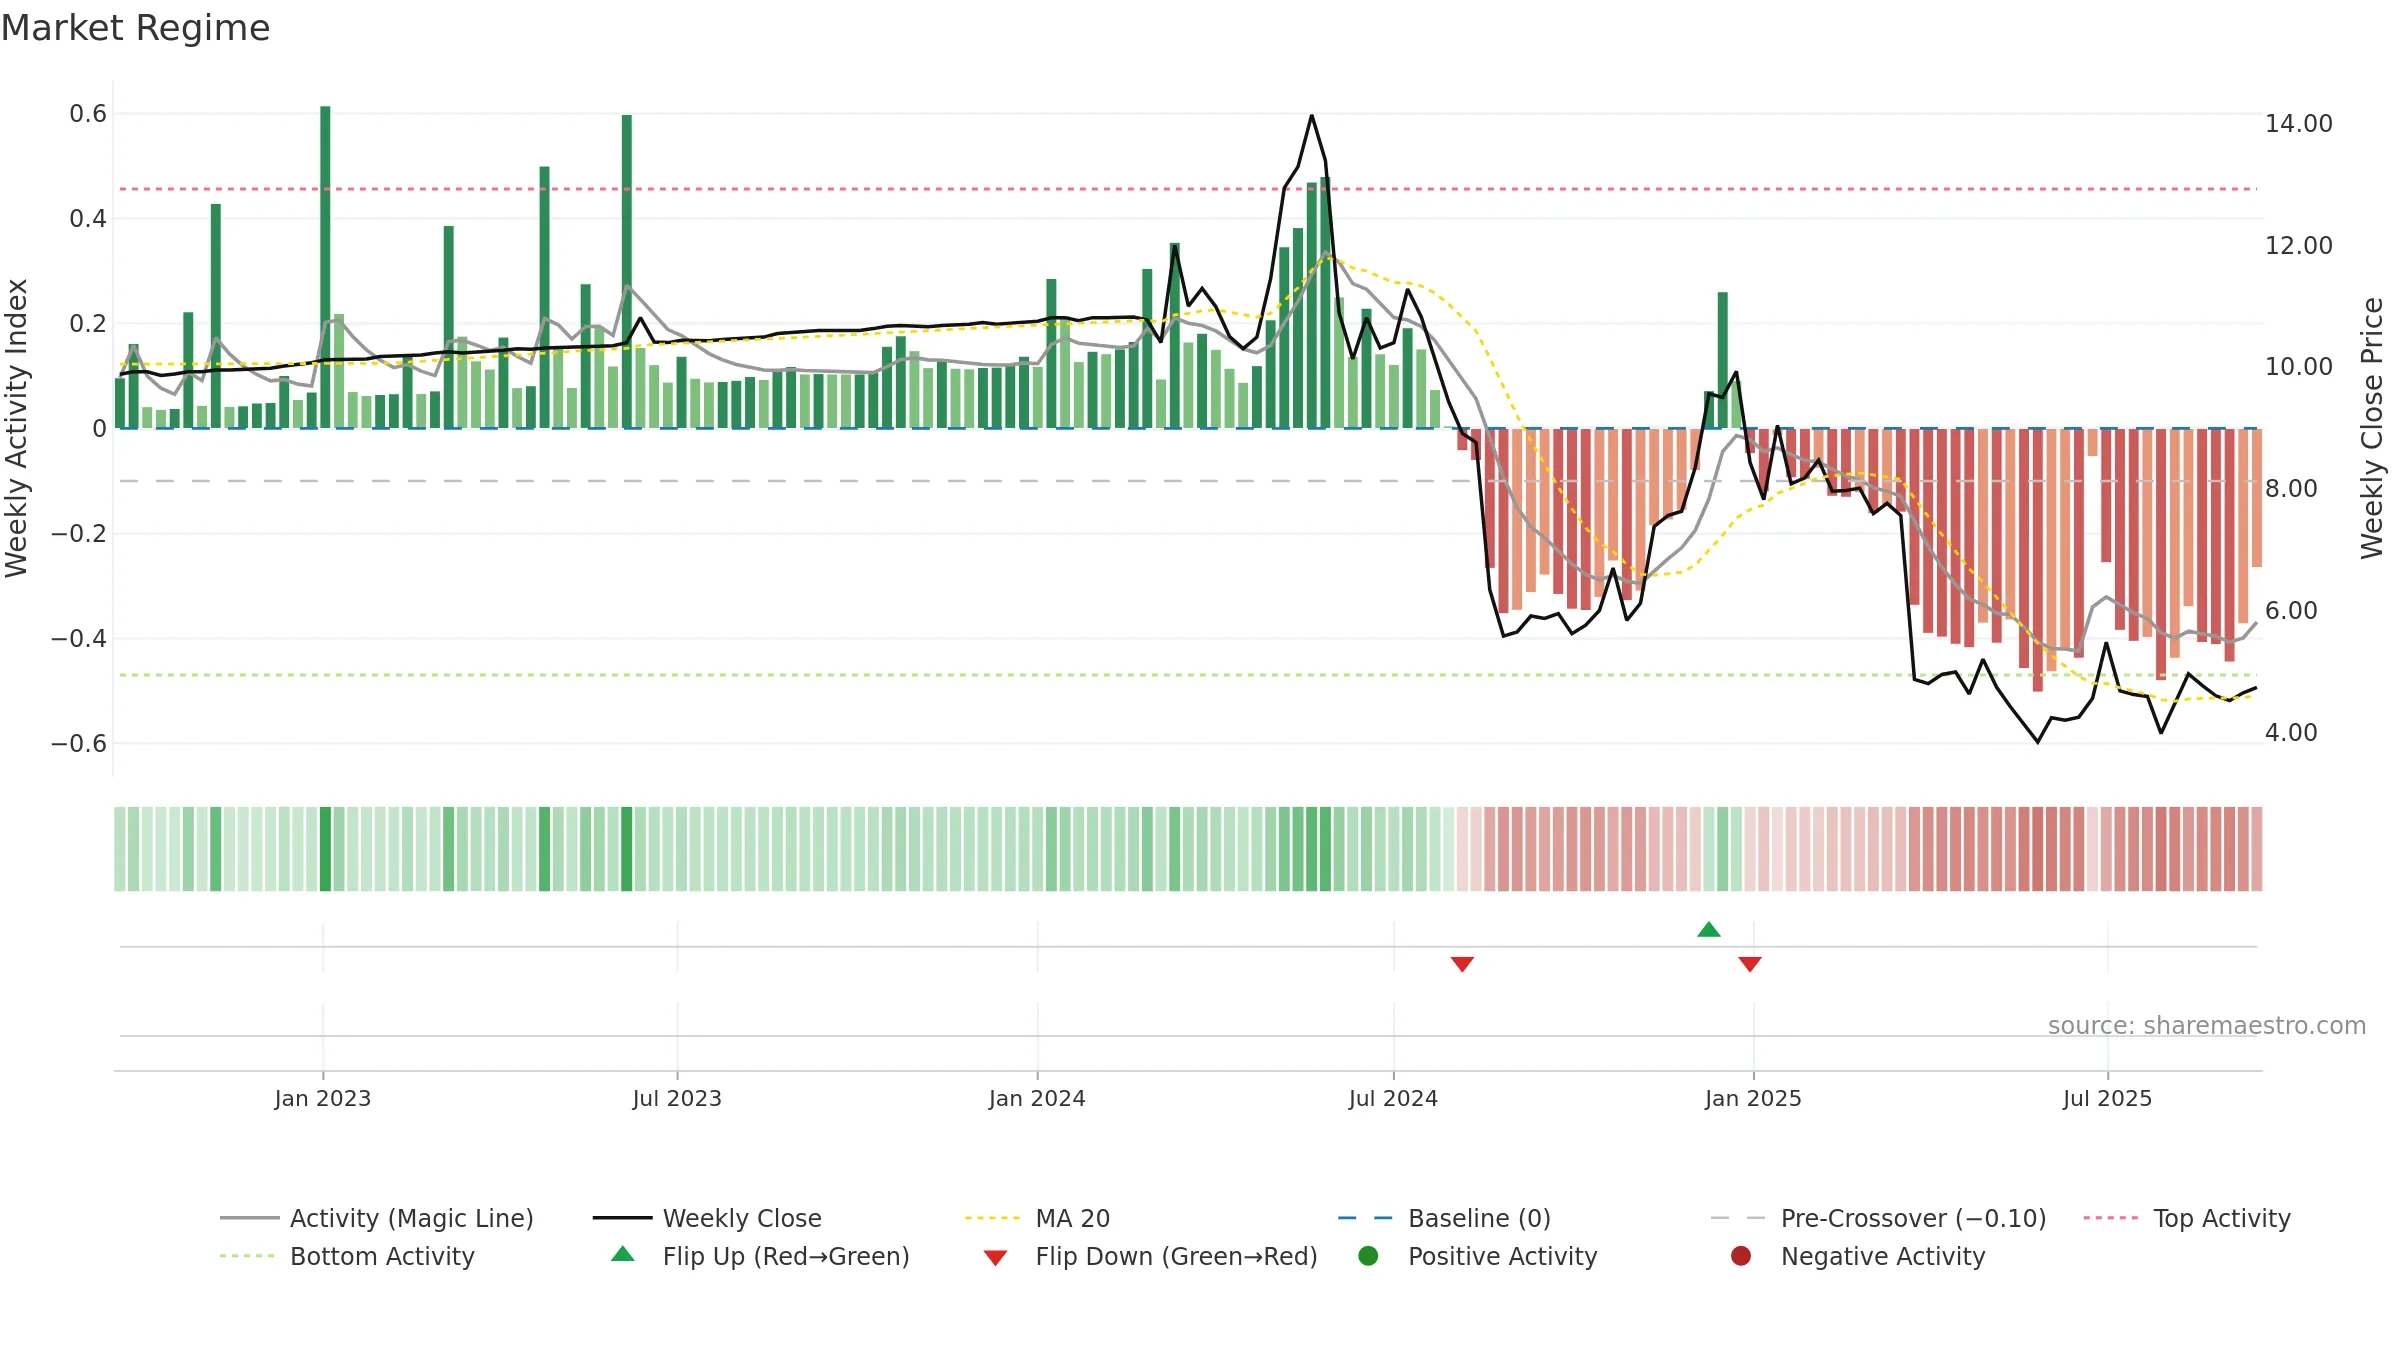
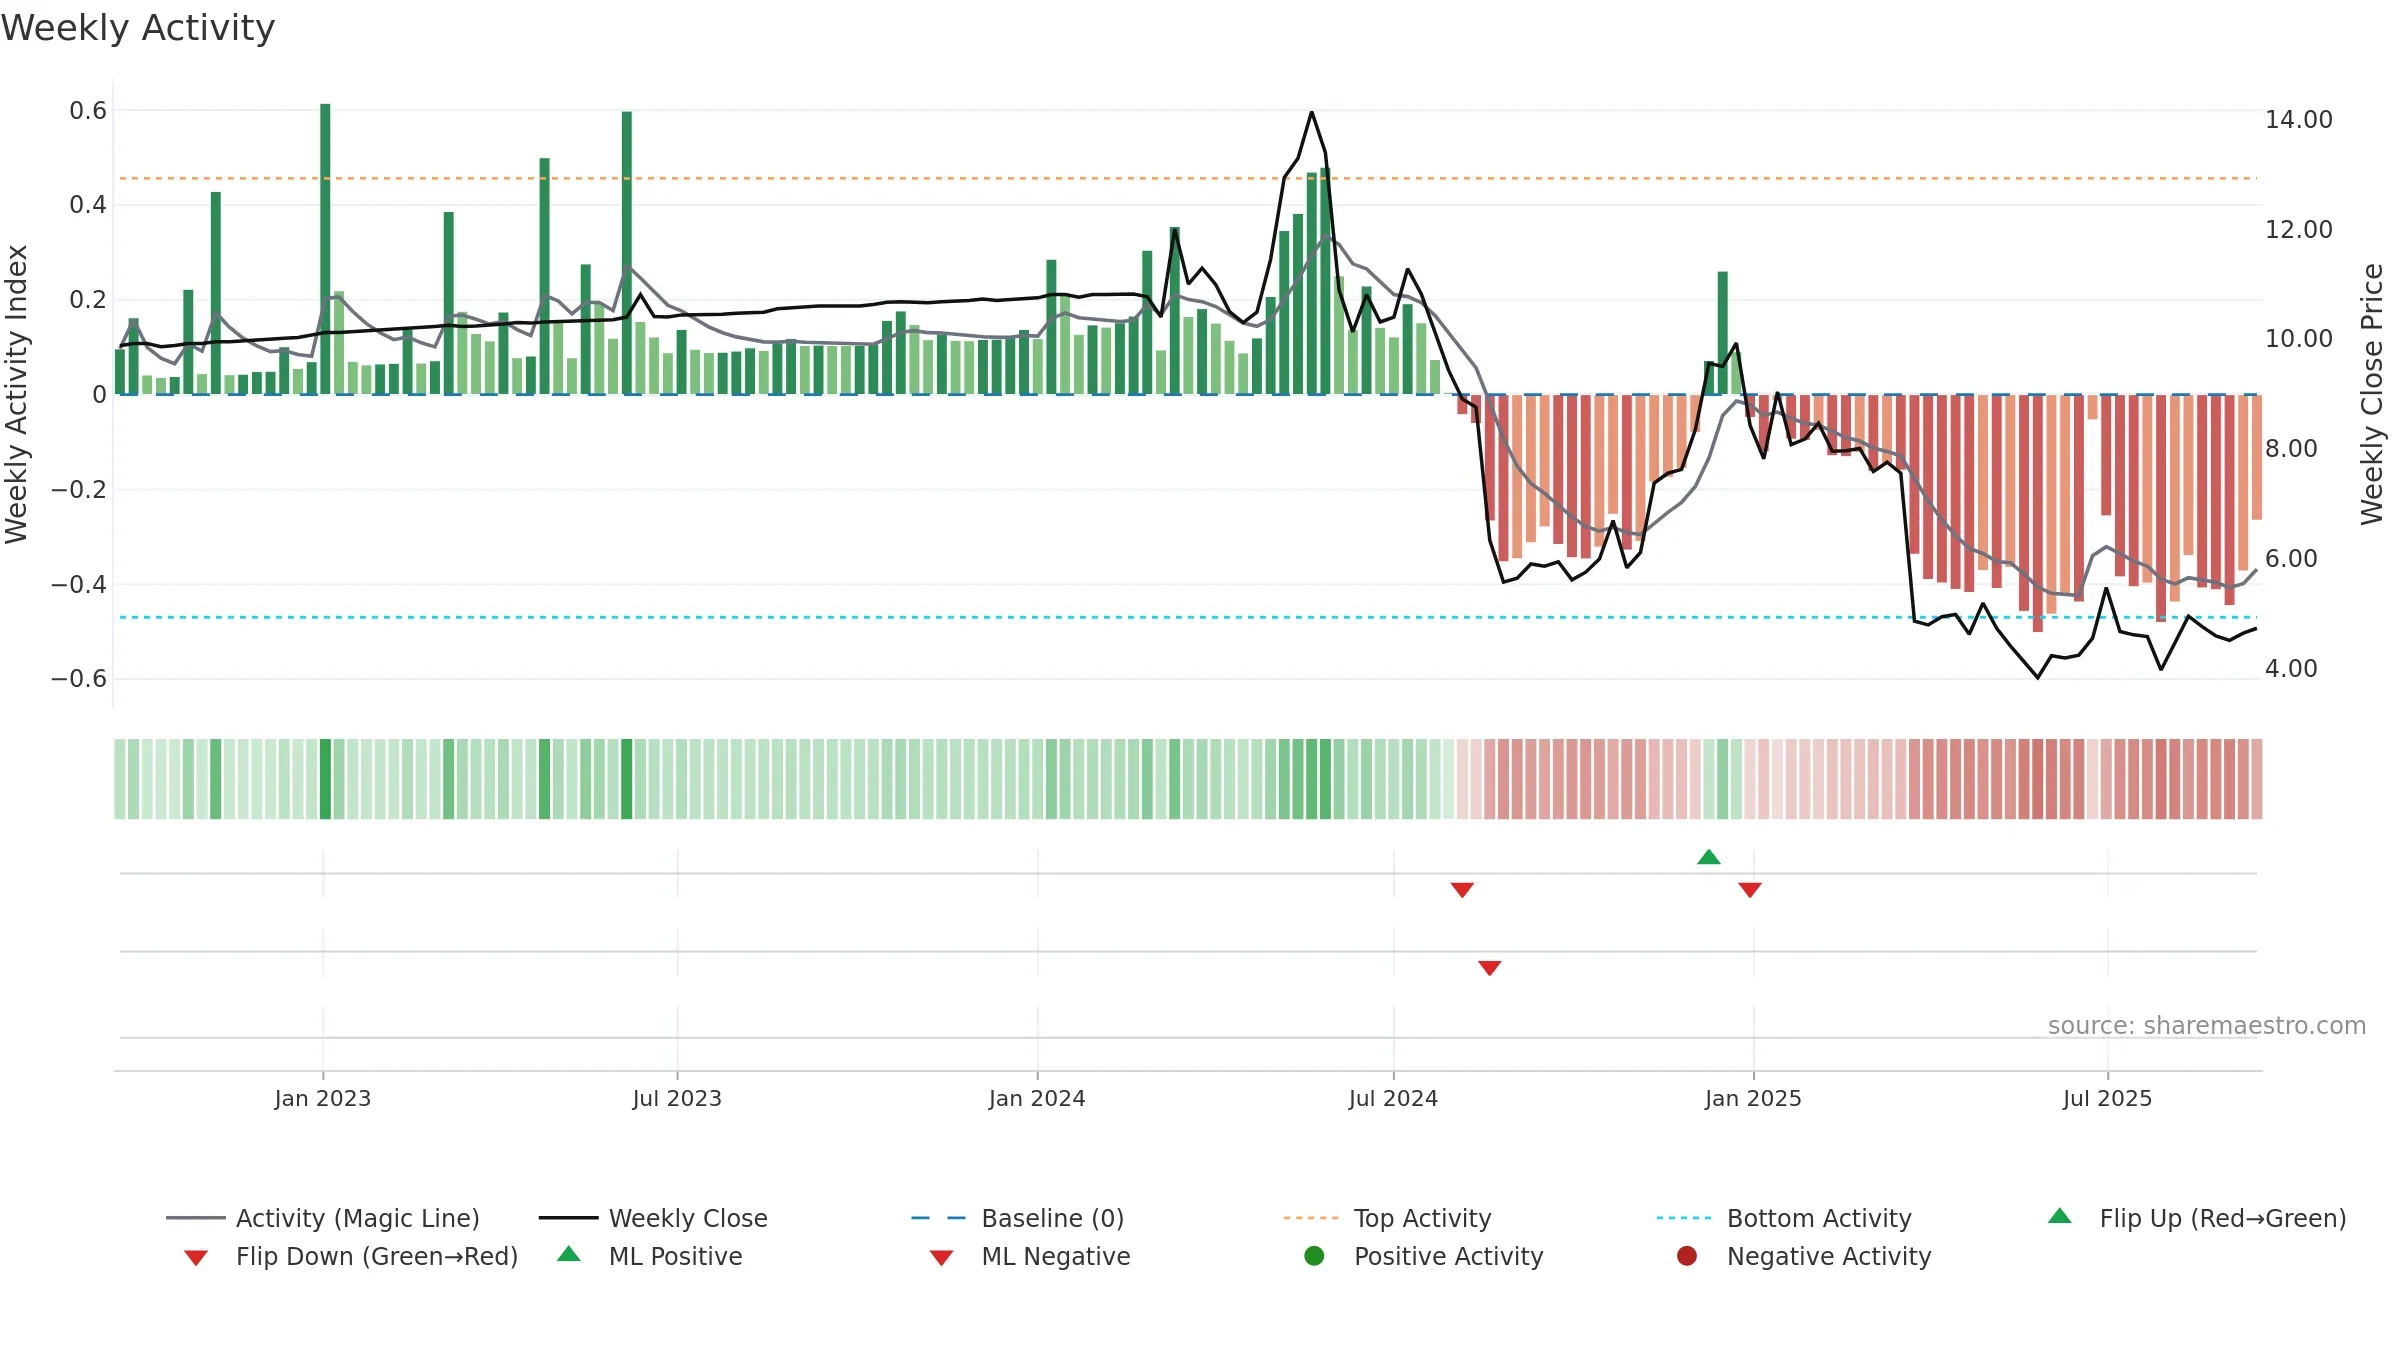
How to read this — Price slope is upward, indicating persistent buying over the window. Elevated weekly volatility increases whipsaw risk. Volume and price are moving in the same direction — a constructive confirmation. Price holds above key averages, indicating constructive participation.
Up-slope supports buying interest; pullbacks may be contained if activity stays firm.
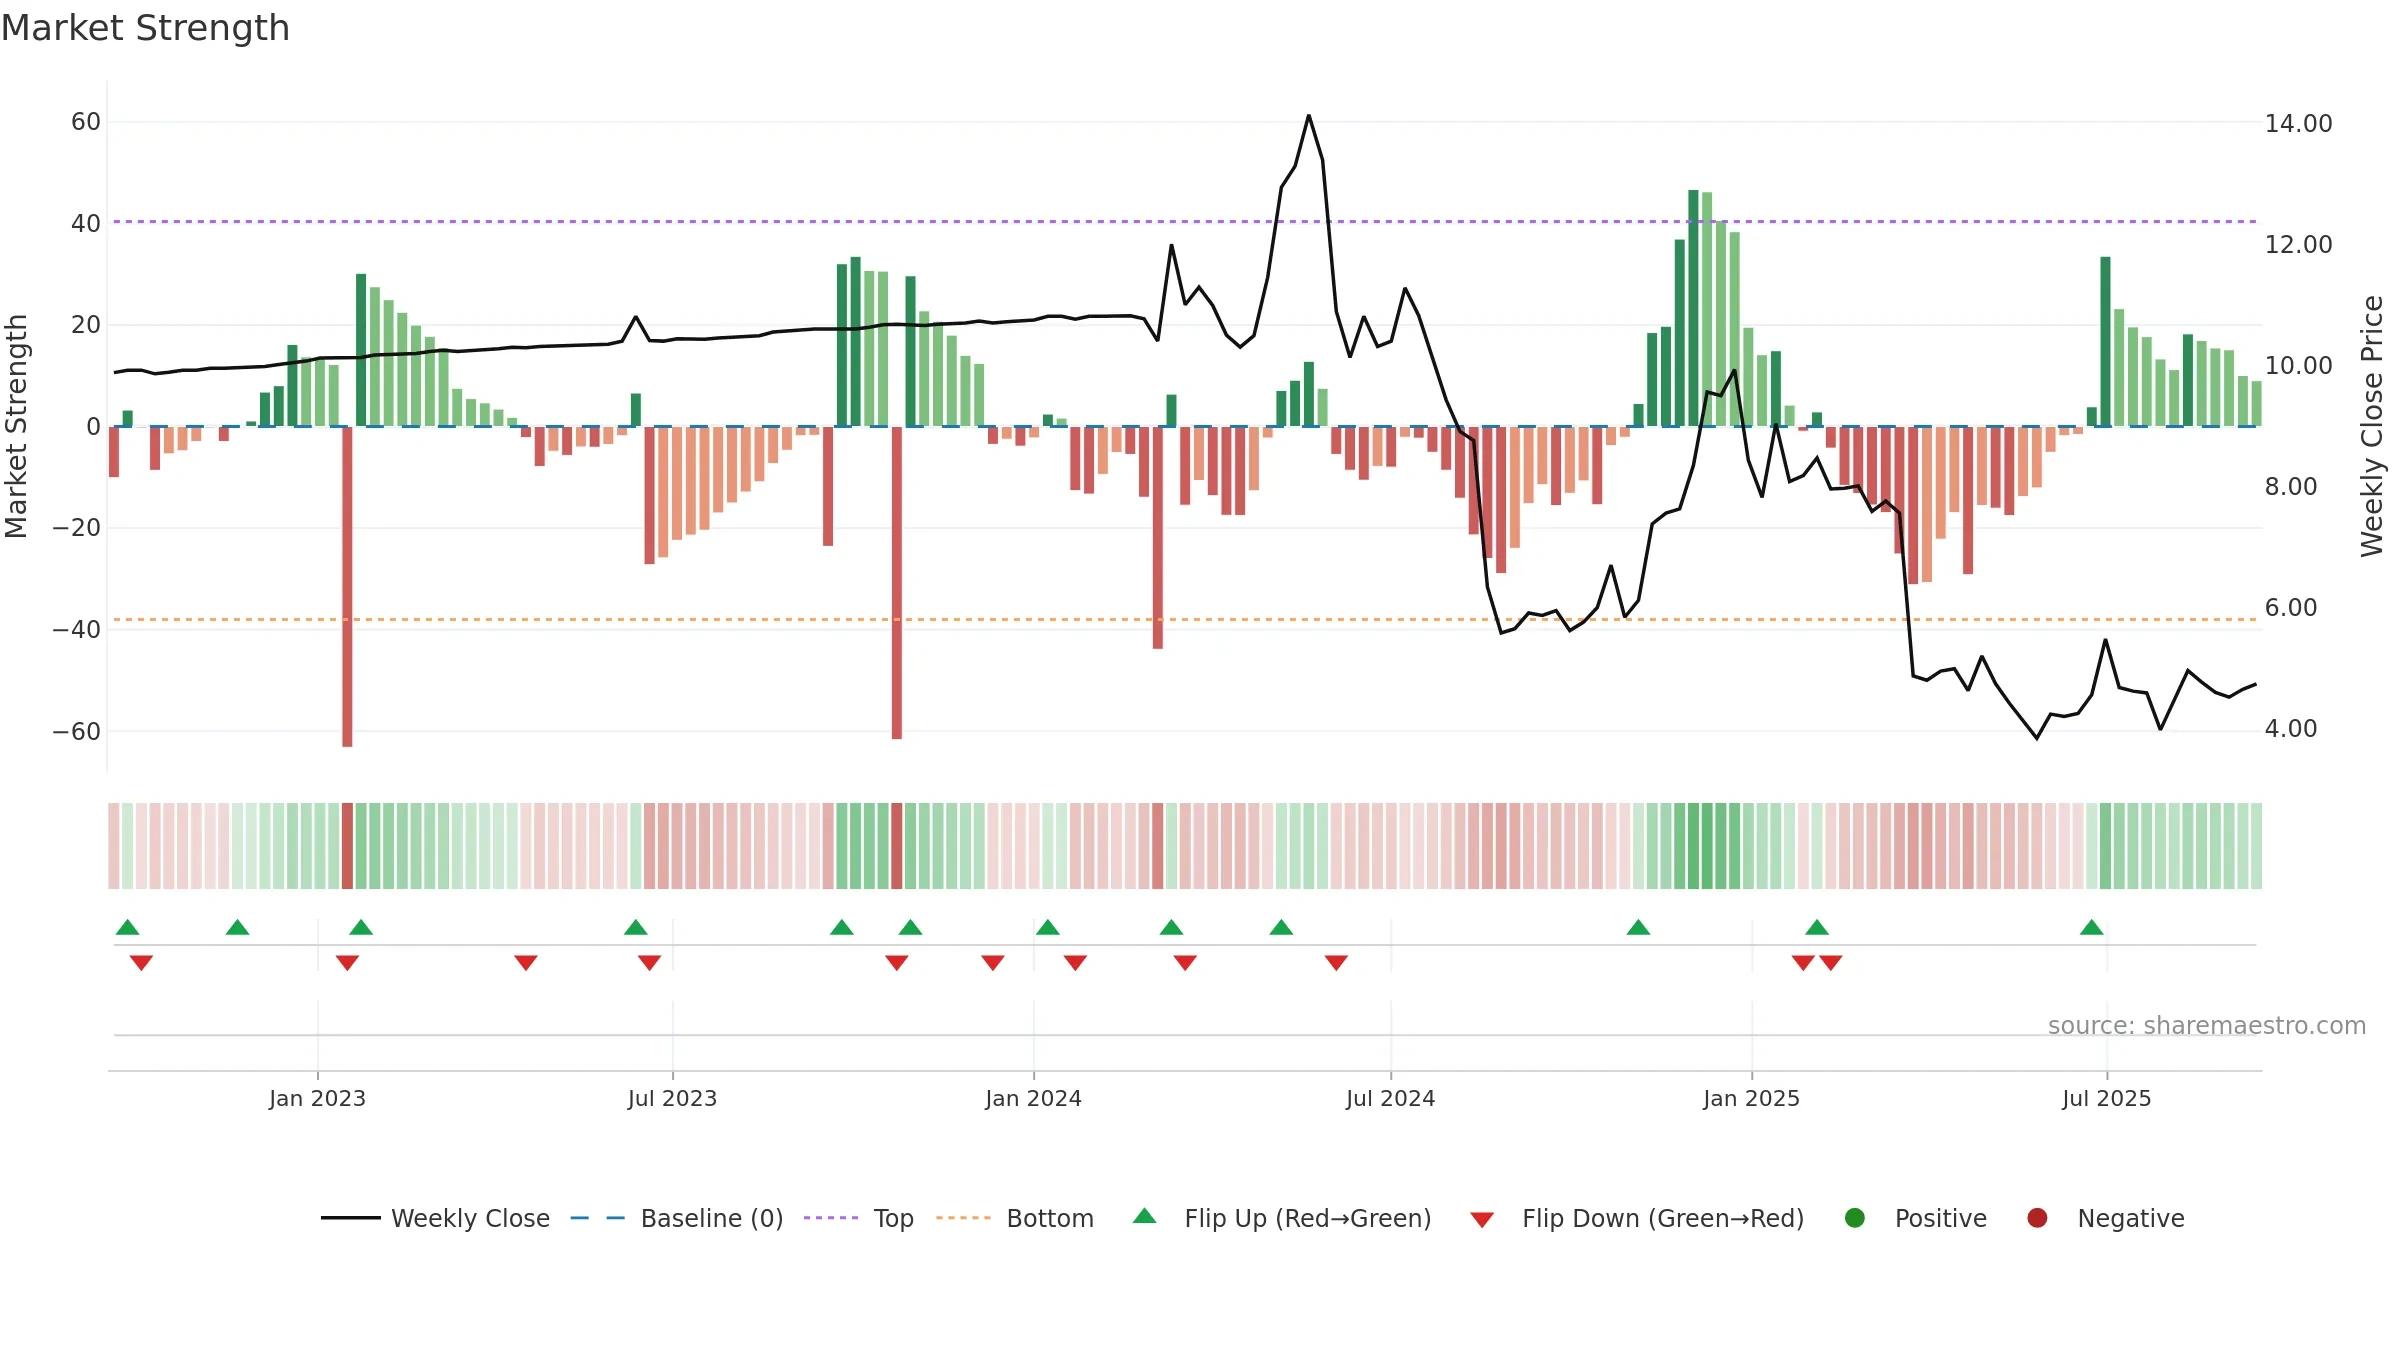
Gauge maps the trend signal to a 0–100 scale.
How to read this — Bearish backdrop but short-term momentum is improving; confirmation still needed.
Early improvement — look for a reclaim of 0.50→0.60 to validate.
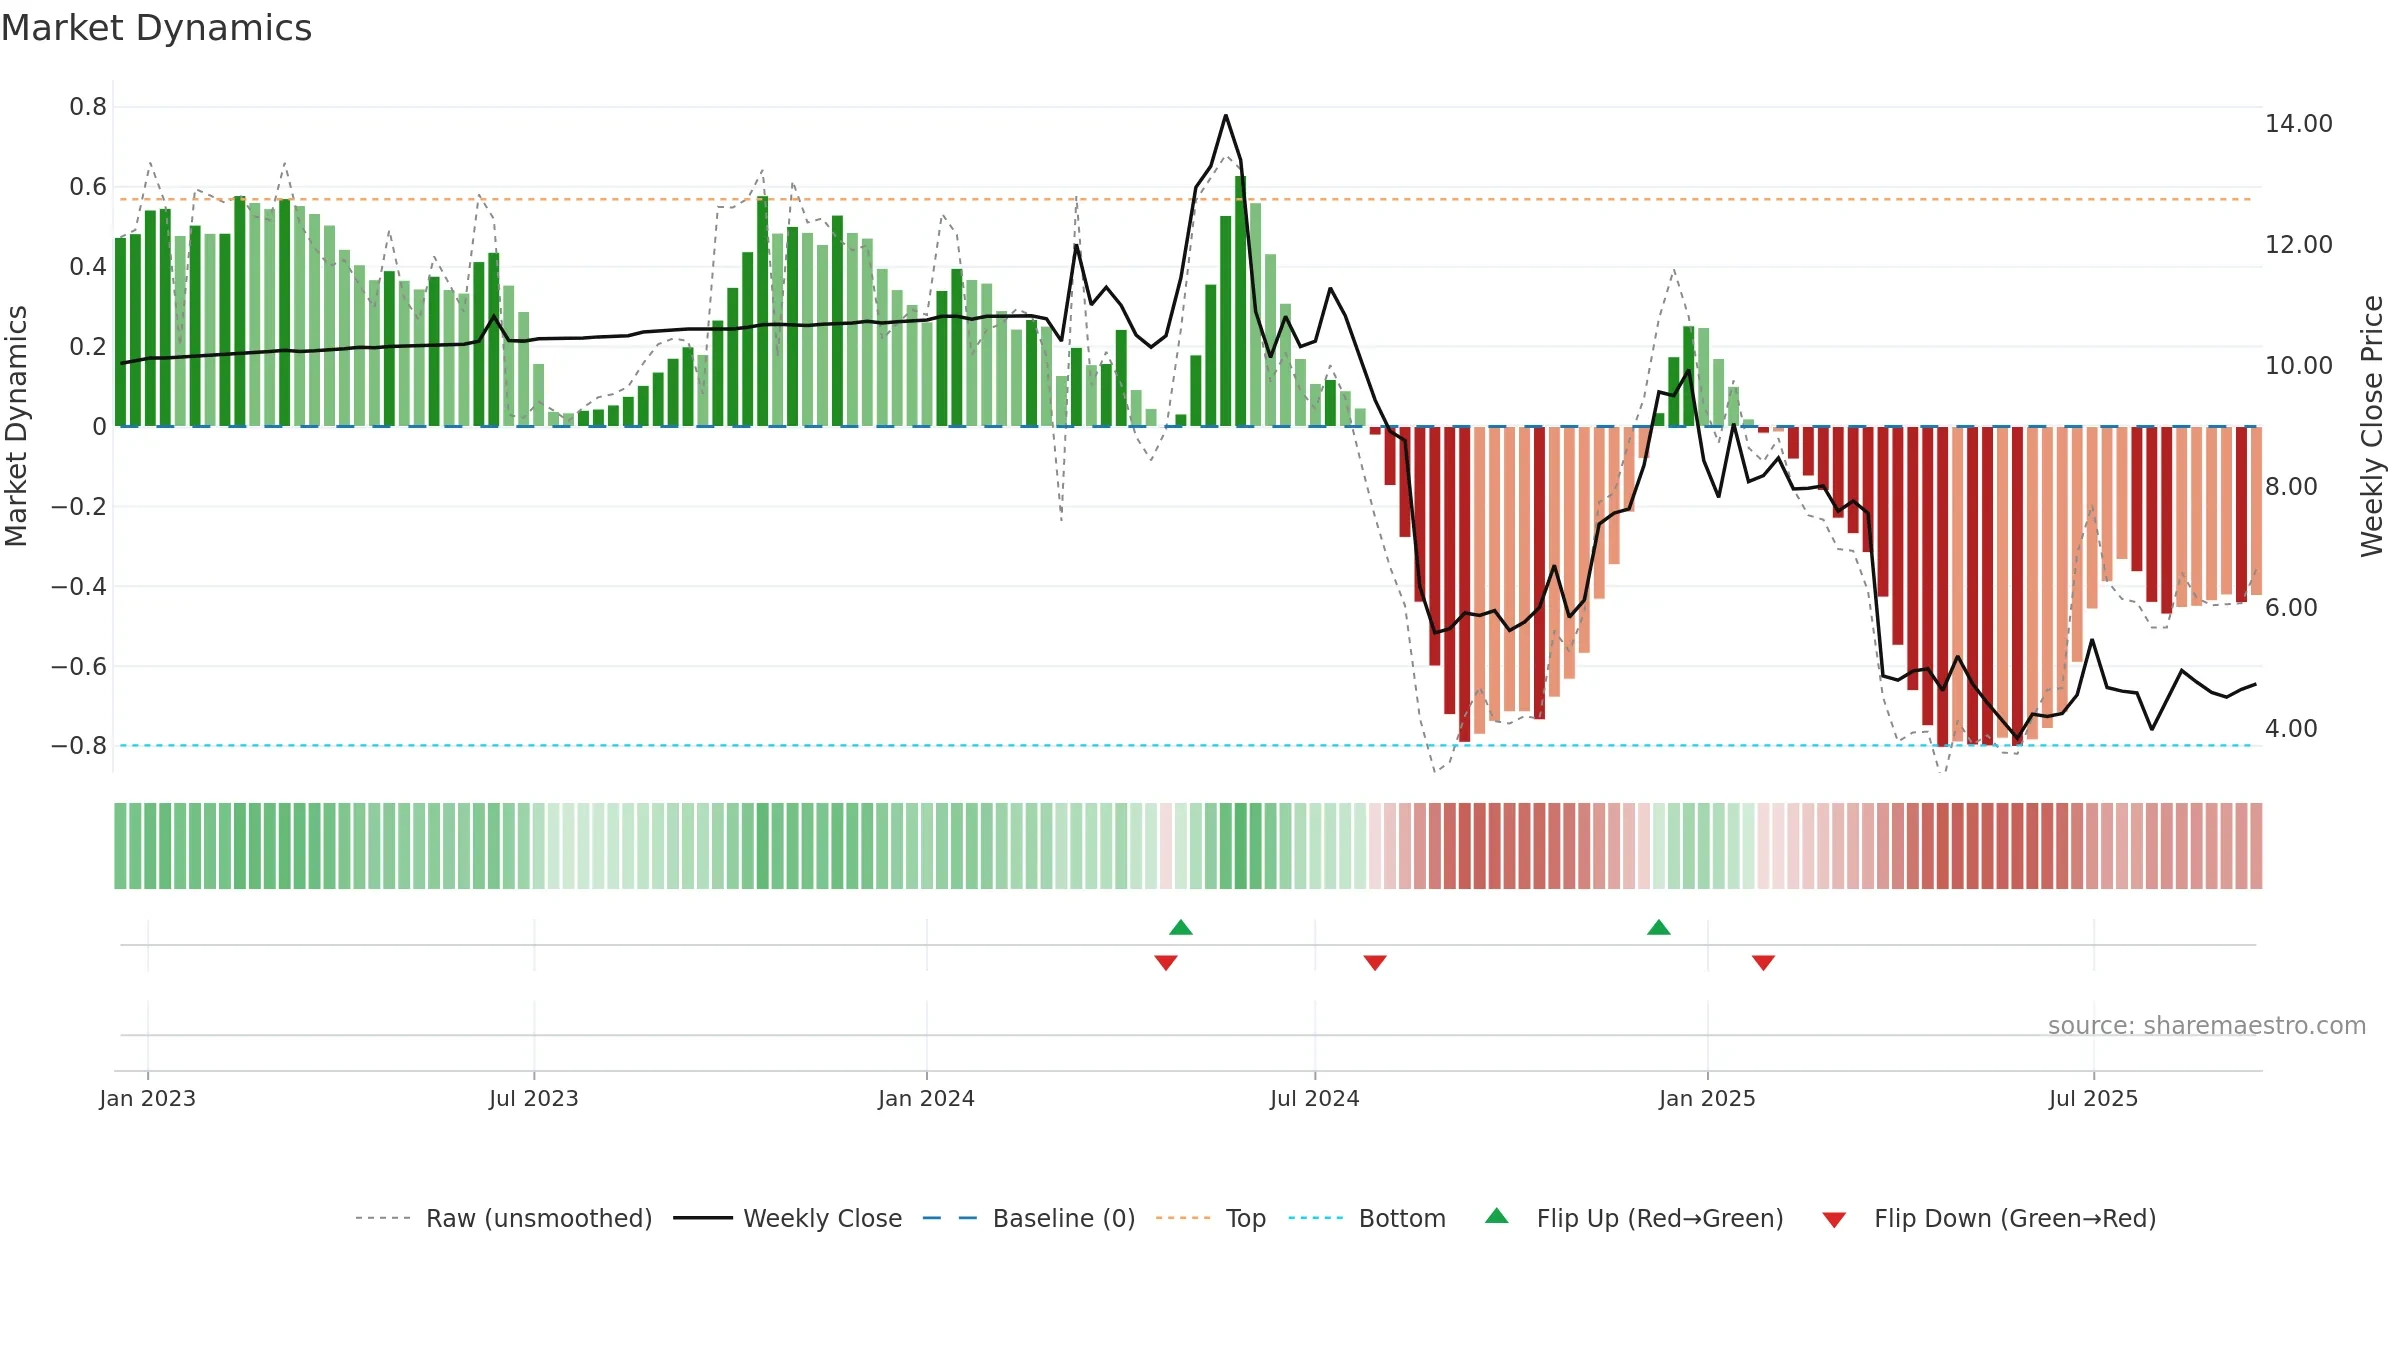
The flag is positive: favourable upside skew with supportive conditions.
Conclusion
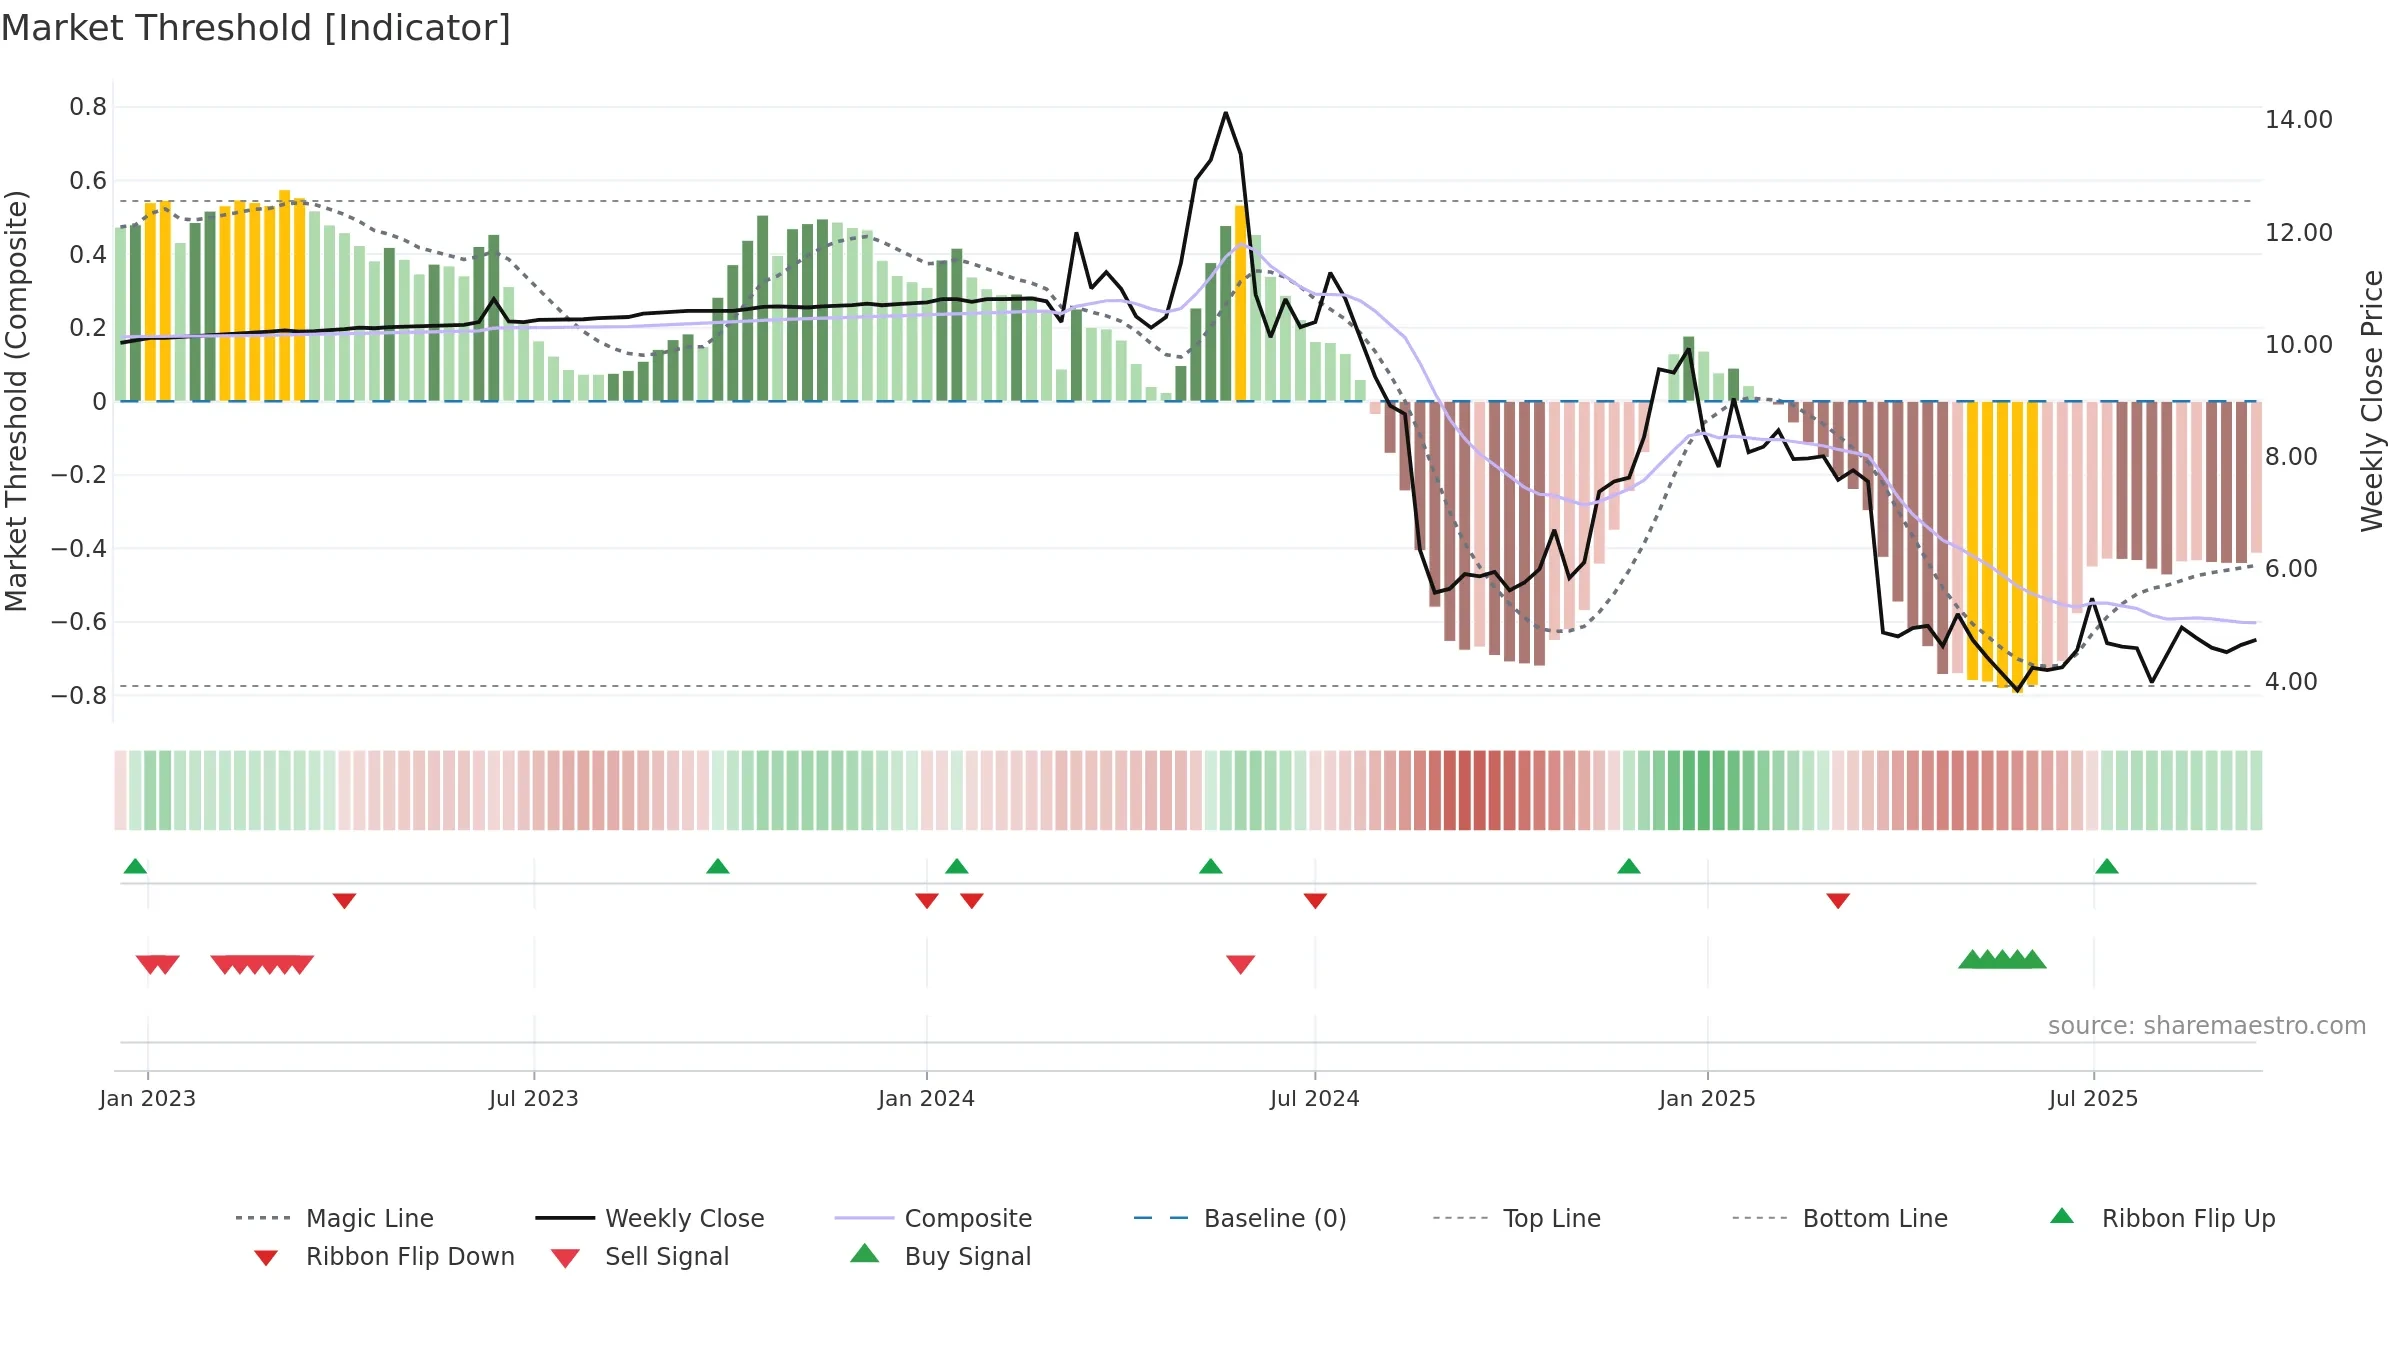
Positive setup. ★★★★☆ confidence. Price window: 19. Trend: Bottoming Attempt; gauge 12. In combination, liquidity confirms the move.
- Early improvement from bearish zone (bottoming attempt)
- Price holds above 8w & 26w averages
- Liquidity confirms the price trend
- Solid multi-week performance
- High return volatility raises whipsaw risk
Why: Price window 19.10% over 8w. Close is -4.44% below the prior-window high. Return volatility 7.18%. Volume trend rising. Liquidity convergence with price. Trend state bottoming attempt. Low-regime (≤0.25) upticks 6/7 (86.0%) • Accumulating. Momentum neutral and rising. Valuation stance positive.
Tip: Most metrics include a hover tooltip where they appear in the report.