Herc Holdings Inc.
HRI NYSE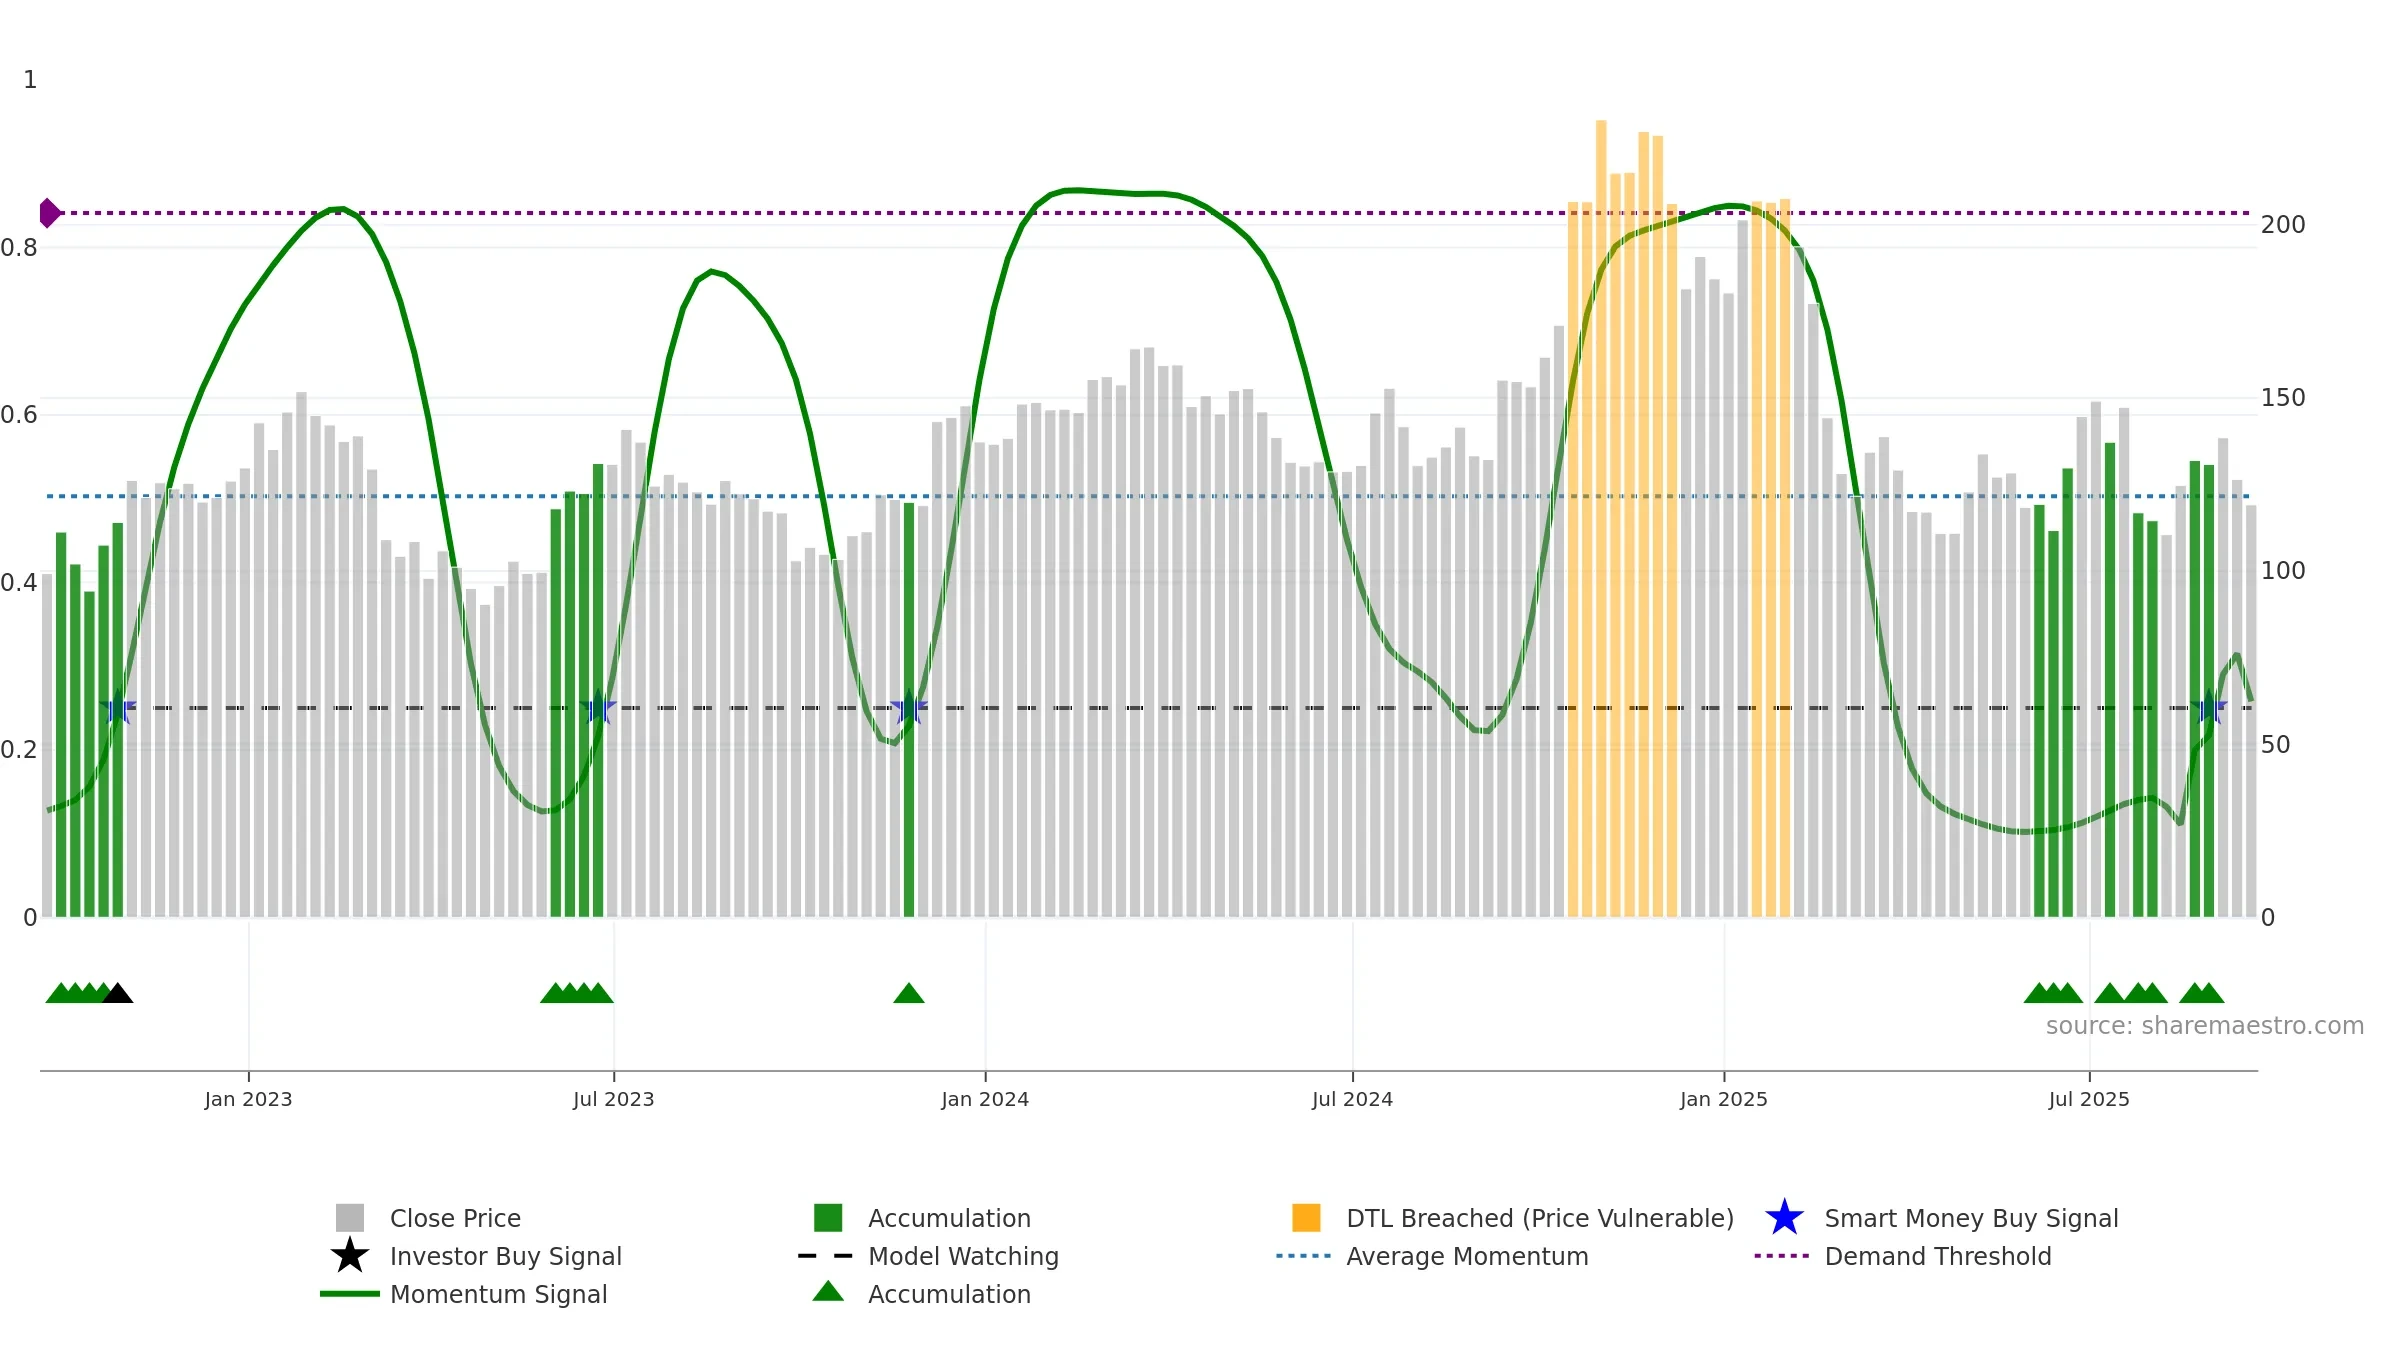
Weekly Report
Herc Holdings Inc. closed at 119.1000 (-6.07% WoW) . Data window ends Fri, 19 Sep 2025.
How to read this — Price slope is upward, indicating persistent buying over the window. Elevated weekly volatility increases whipsaw risk. Volume and price are moving in the same direction — a constructive confirmation. Returns are positively correlated with volume — strength tends to arrive on higher activity. Price sits below key averages, keeping pressure on the tape.
Up-slope supports buying interest; pullbacks may be contained if activity stays firm.
Gauge maps the trend signal to a 0–100 scale.
How to read this — Range-bound conditions; conviction is limited until a break or acceleration emerges.
Wait for a directional break or improving acceleration.
The flag is positive: favourable upside skew with supportive conditions.
Conclusion
Negative setup. ★★☆☆☆ confidence. Price window: 3. Trend: Range / Neutral; gauge 25. In combination, liquidity confirms the move.
- Liquidity confirms the price trend
- Buyers step in at depressed levels (accumulation)
- Momentum is weak/falling
- Price is not above key averages
- High return volatility raises whipsaw risk
Why: Price window 3.99% over 8w. Close is -13.99% below the prior-window high. Return volatility 5.28%. Volume trend rising. Liquidity convergence with price. Trend state range / neutral. Low-regime (≤0.25) upticks 3/5 (60.0%) • Accumulating. Momentum bearish and rising. Valuation stance positive.
Tip: Most metrics include a hover tooltip where they appear in the report.