Minieye Technology Co Ltd
2431 HKG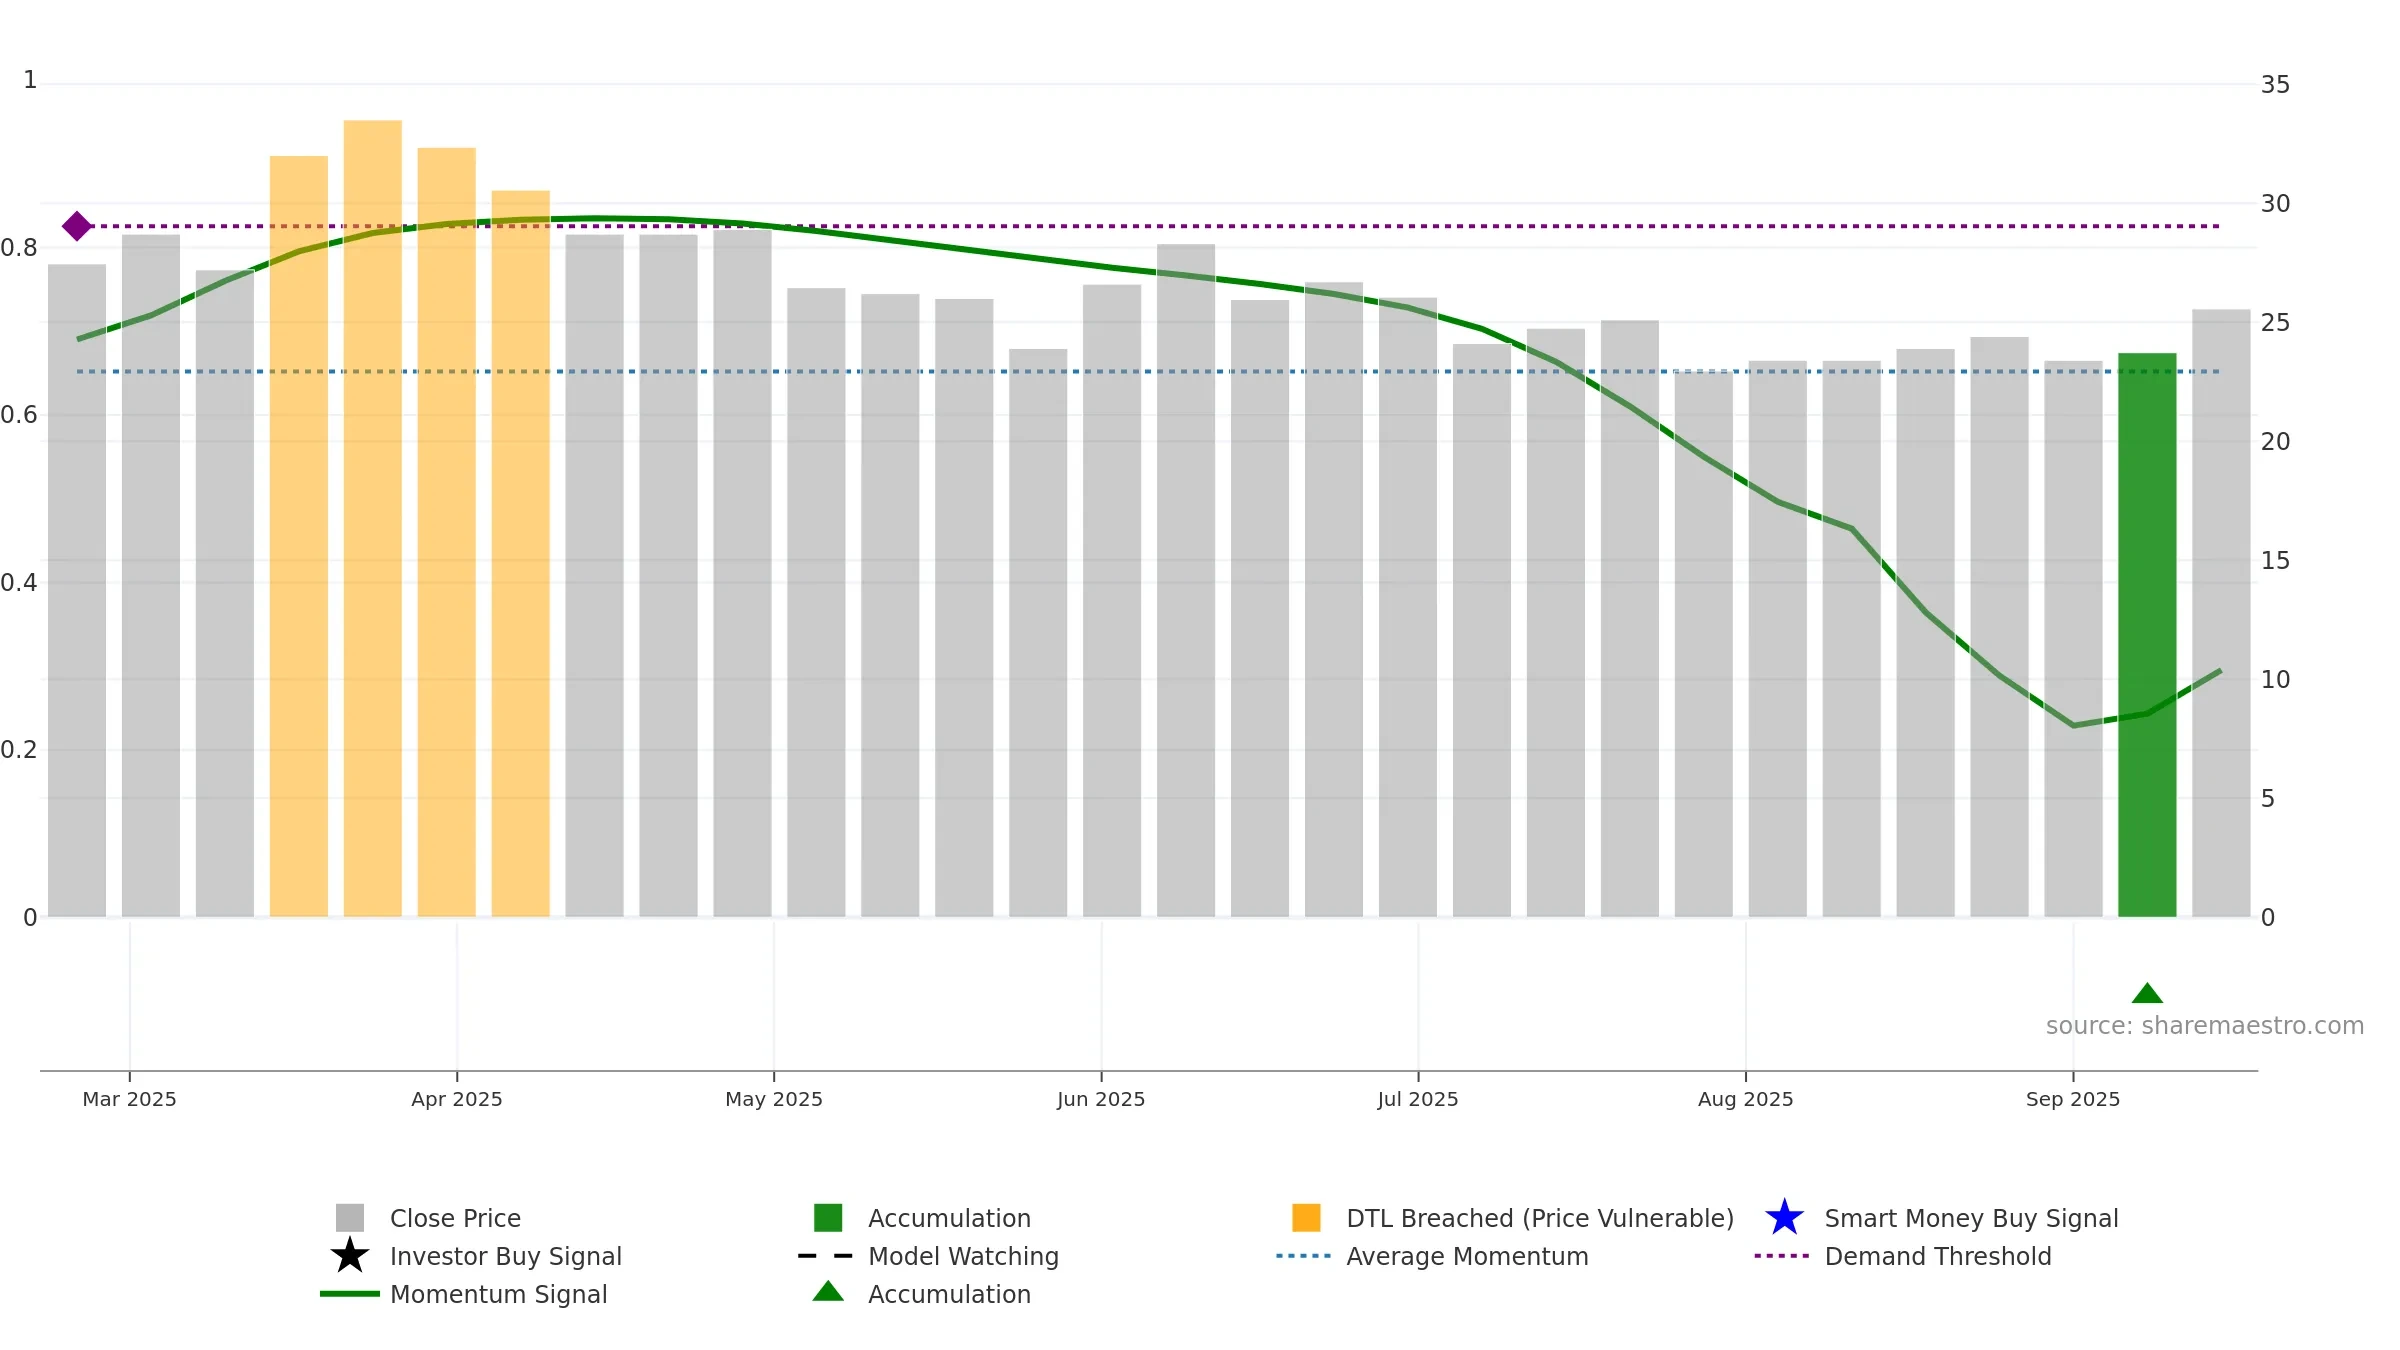

Weekly Report
Minieye Technology Co Ltd closed at 25.5600 (2.98% WoW) . Data window ends Mon, 15 Sep 2025.
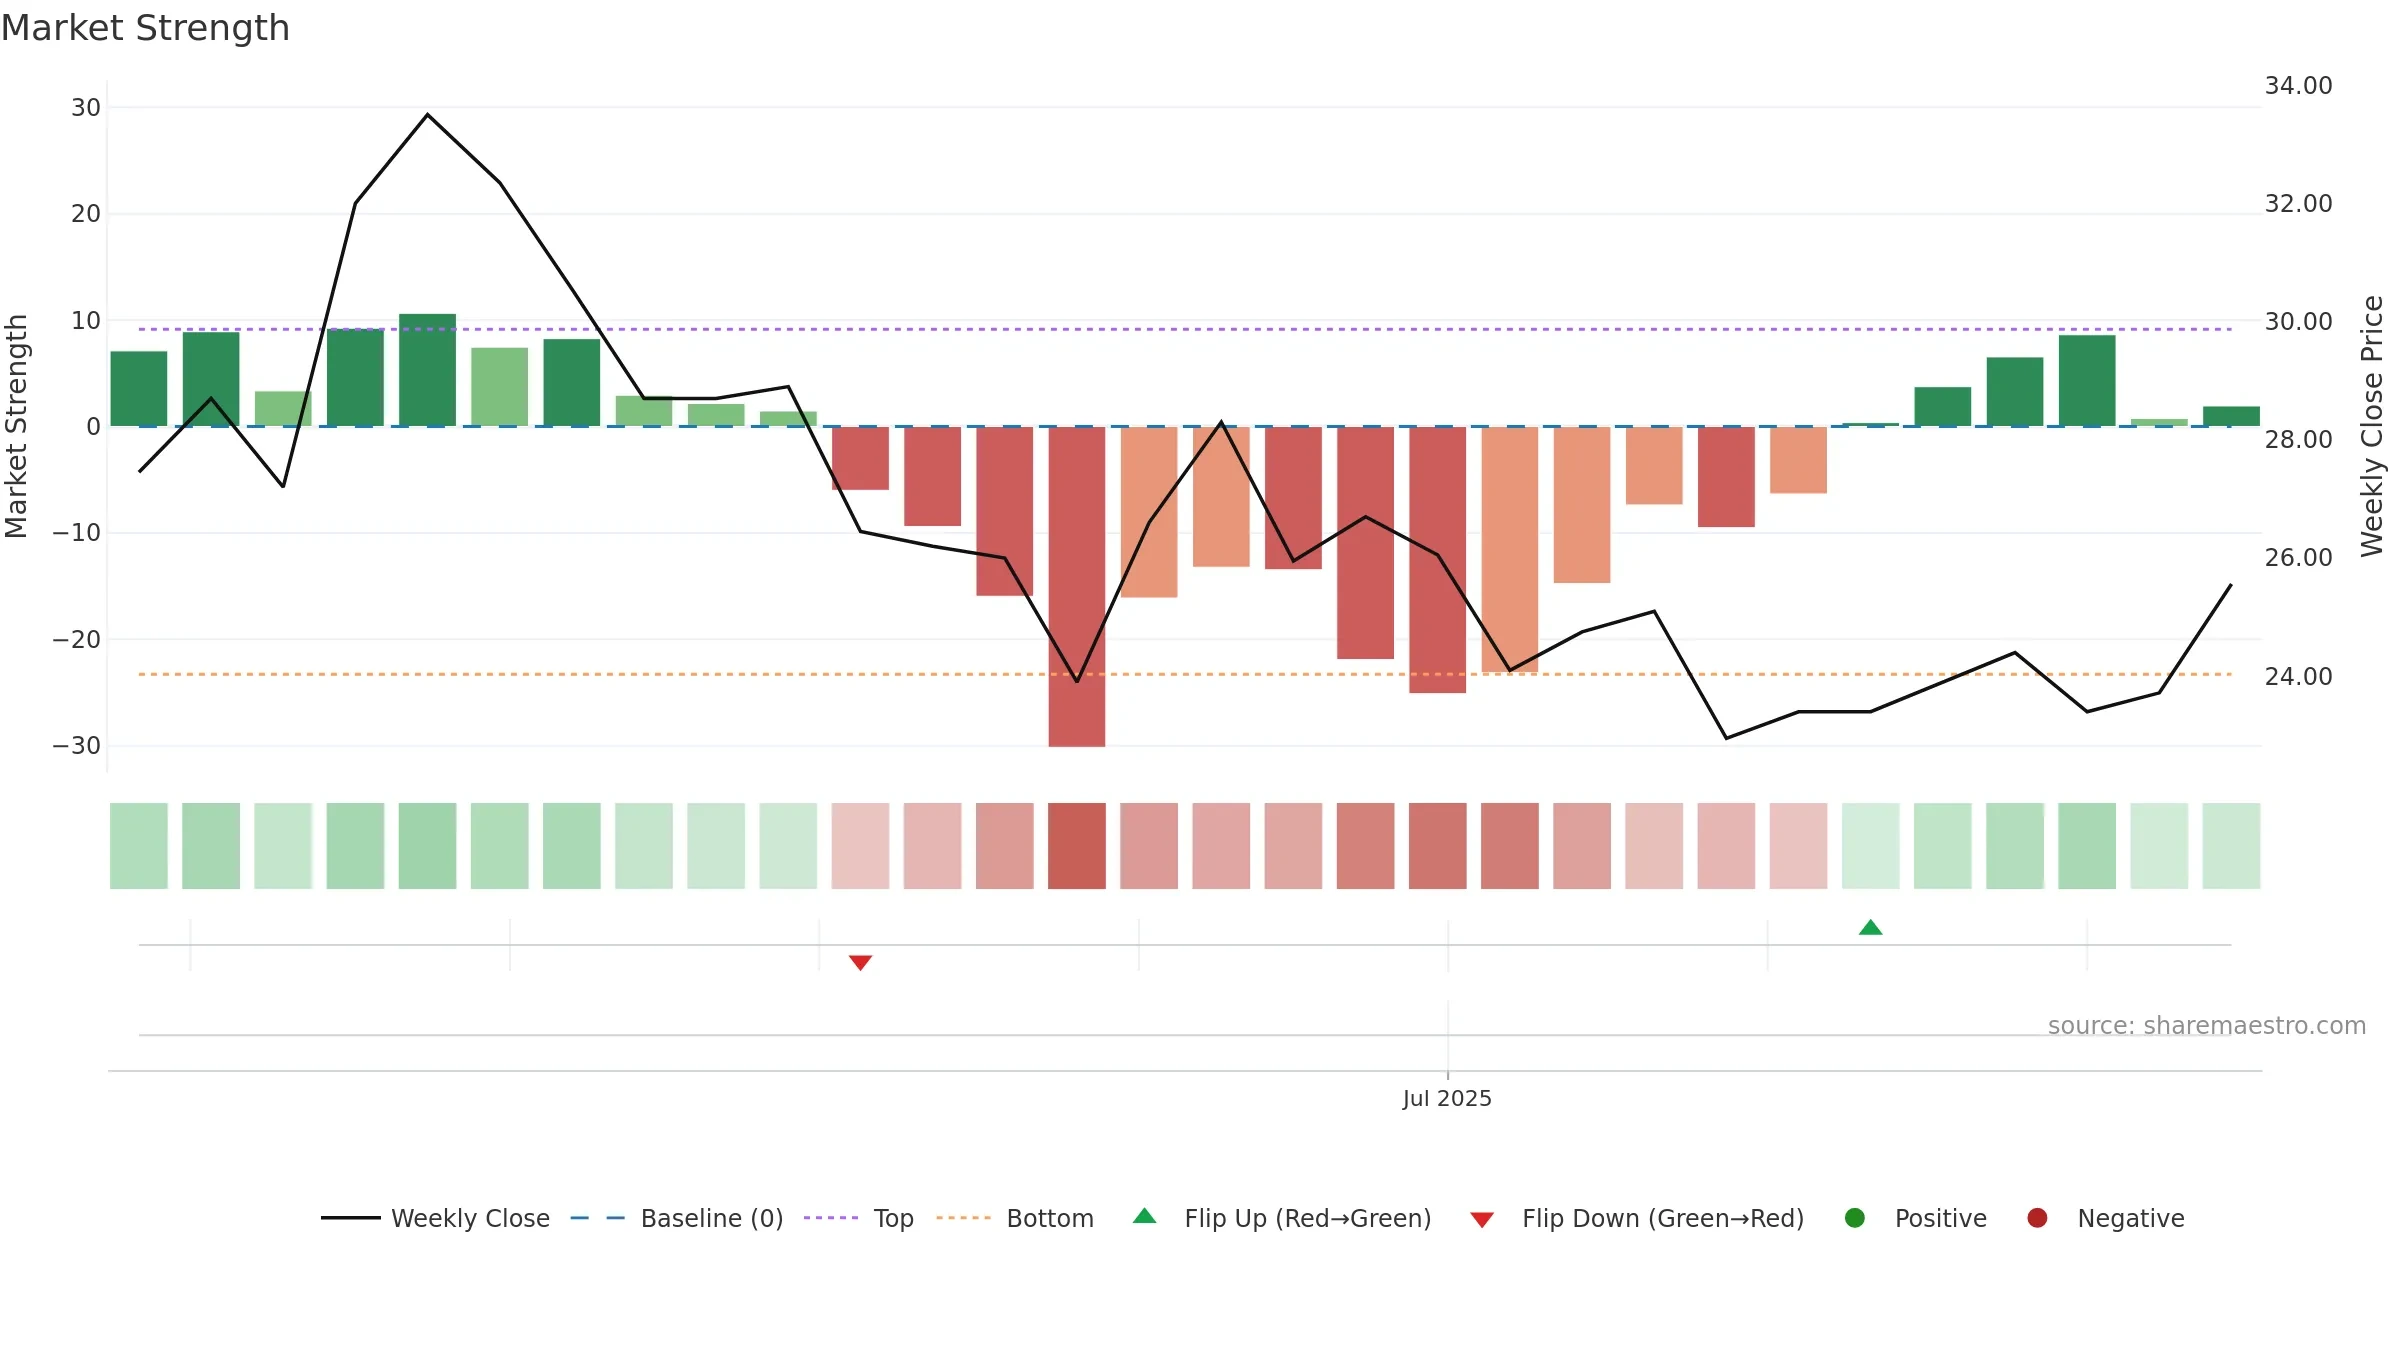
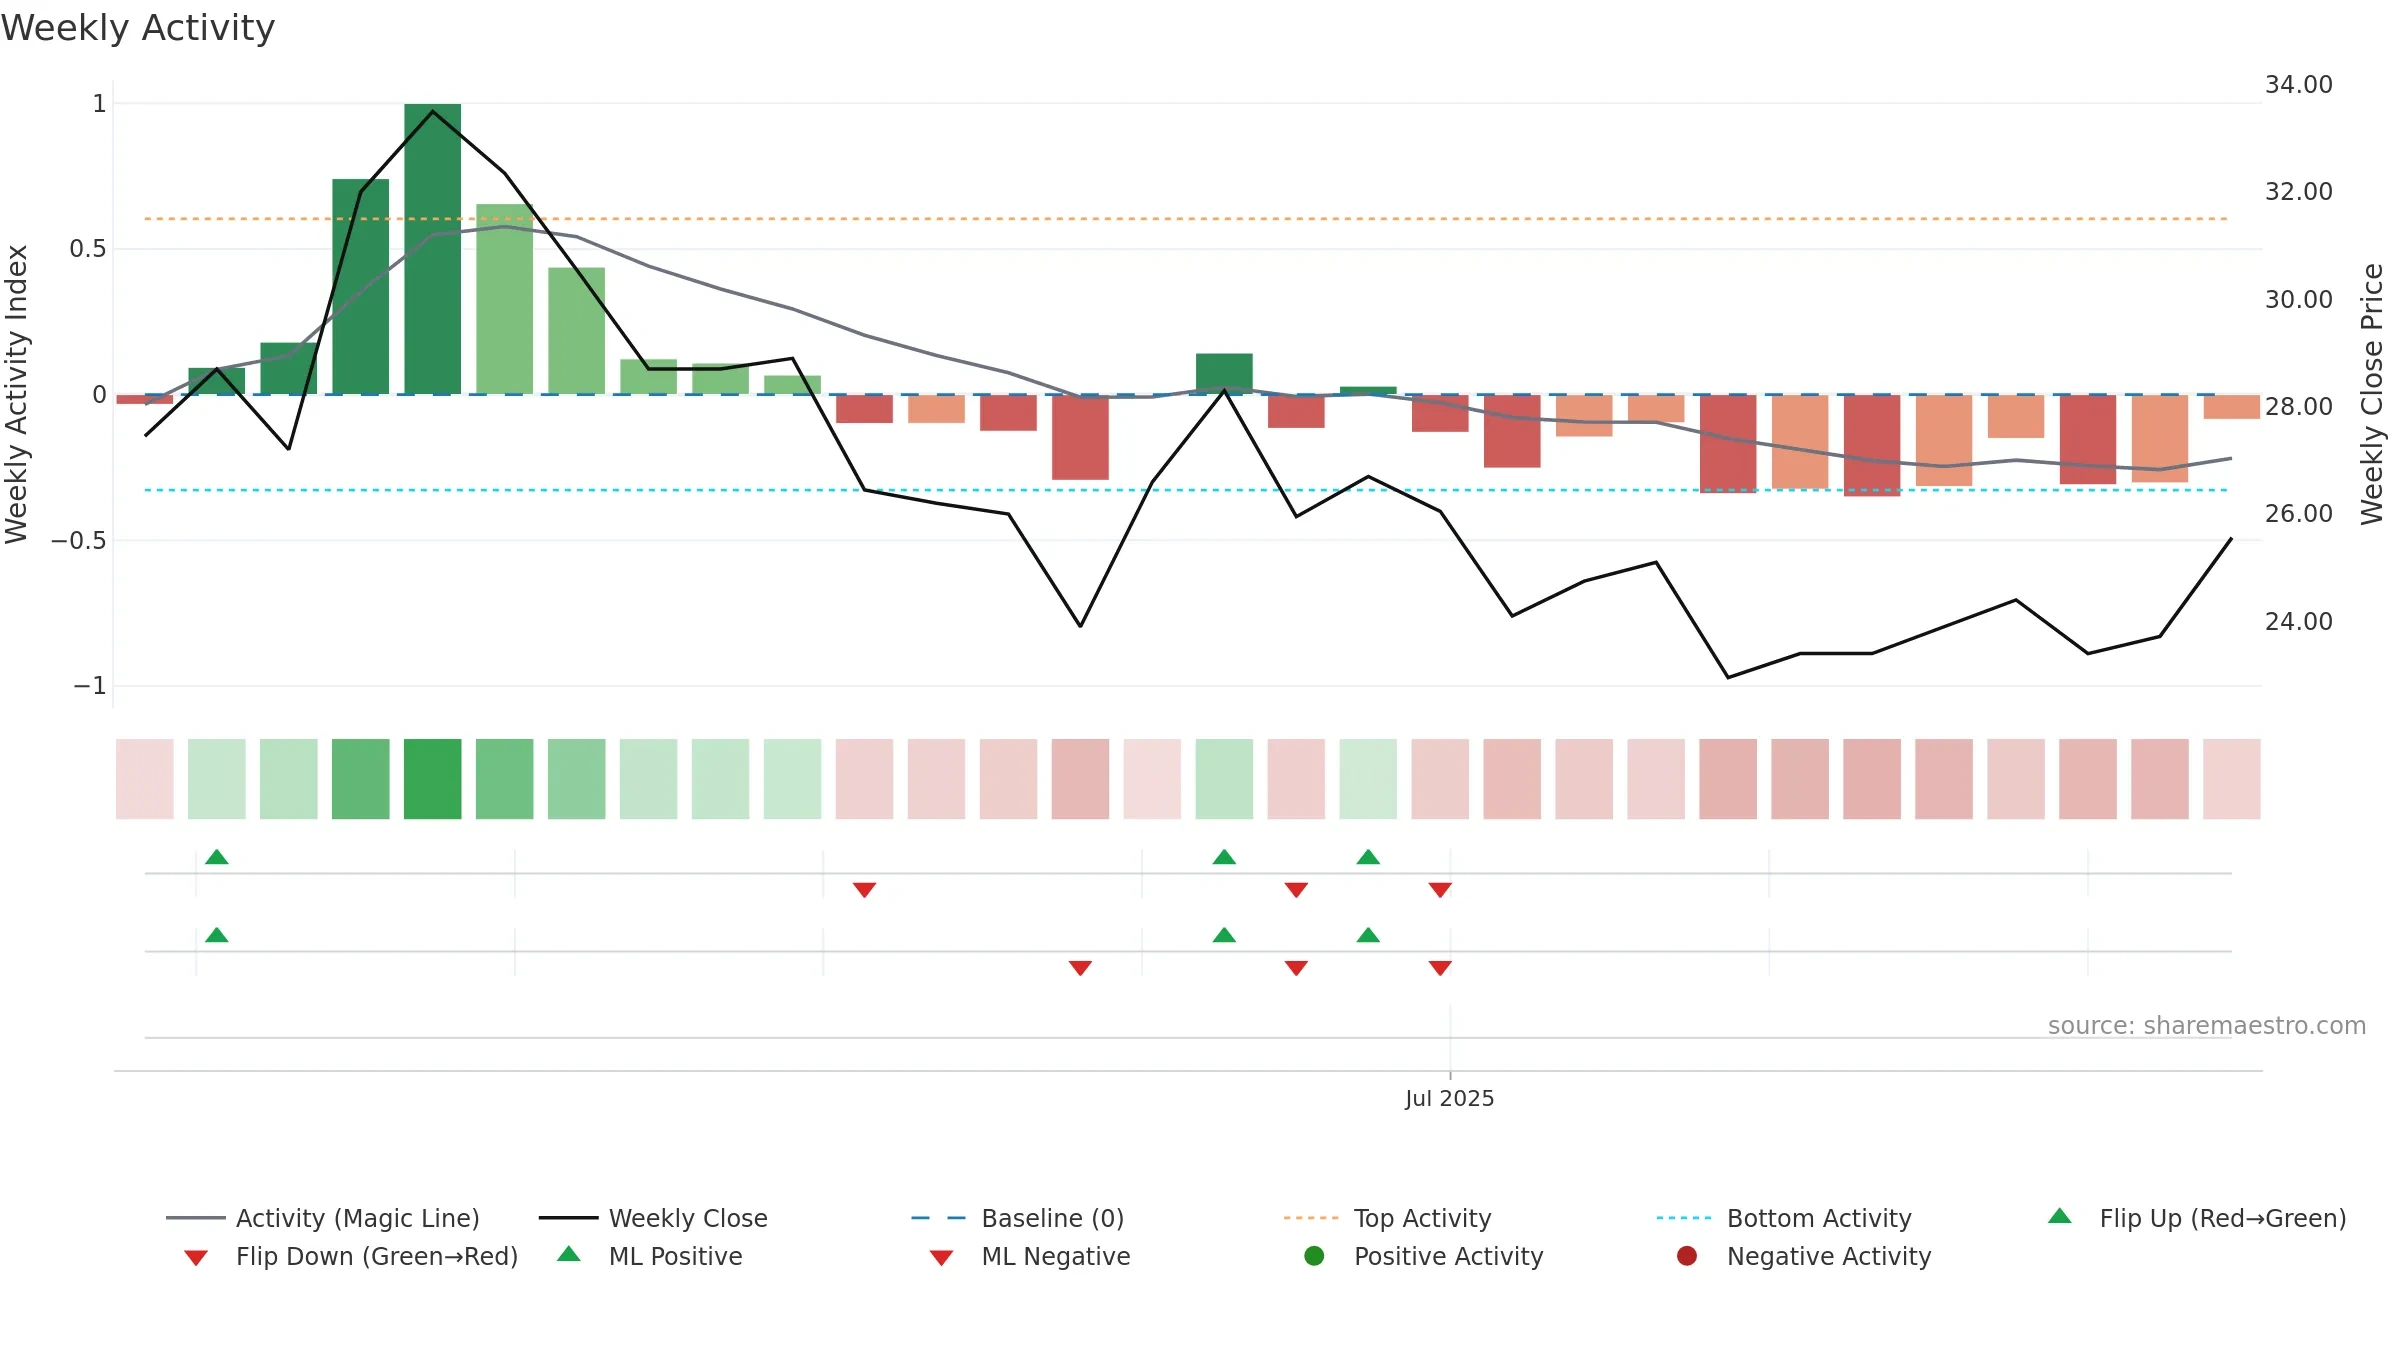
How to read this — Price slope is upward, indicating persistent buying over the window. Volume and price are moving in the same direction — a constructive confirmation. Price is stretched above its baseline; consolidation risk rises if activity fades.
Up-slope supports buying interest; pullbacks may be contained if activity stays firm.
Gauge maps the trend signal to a 0–100 scale.
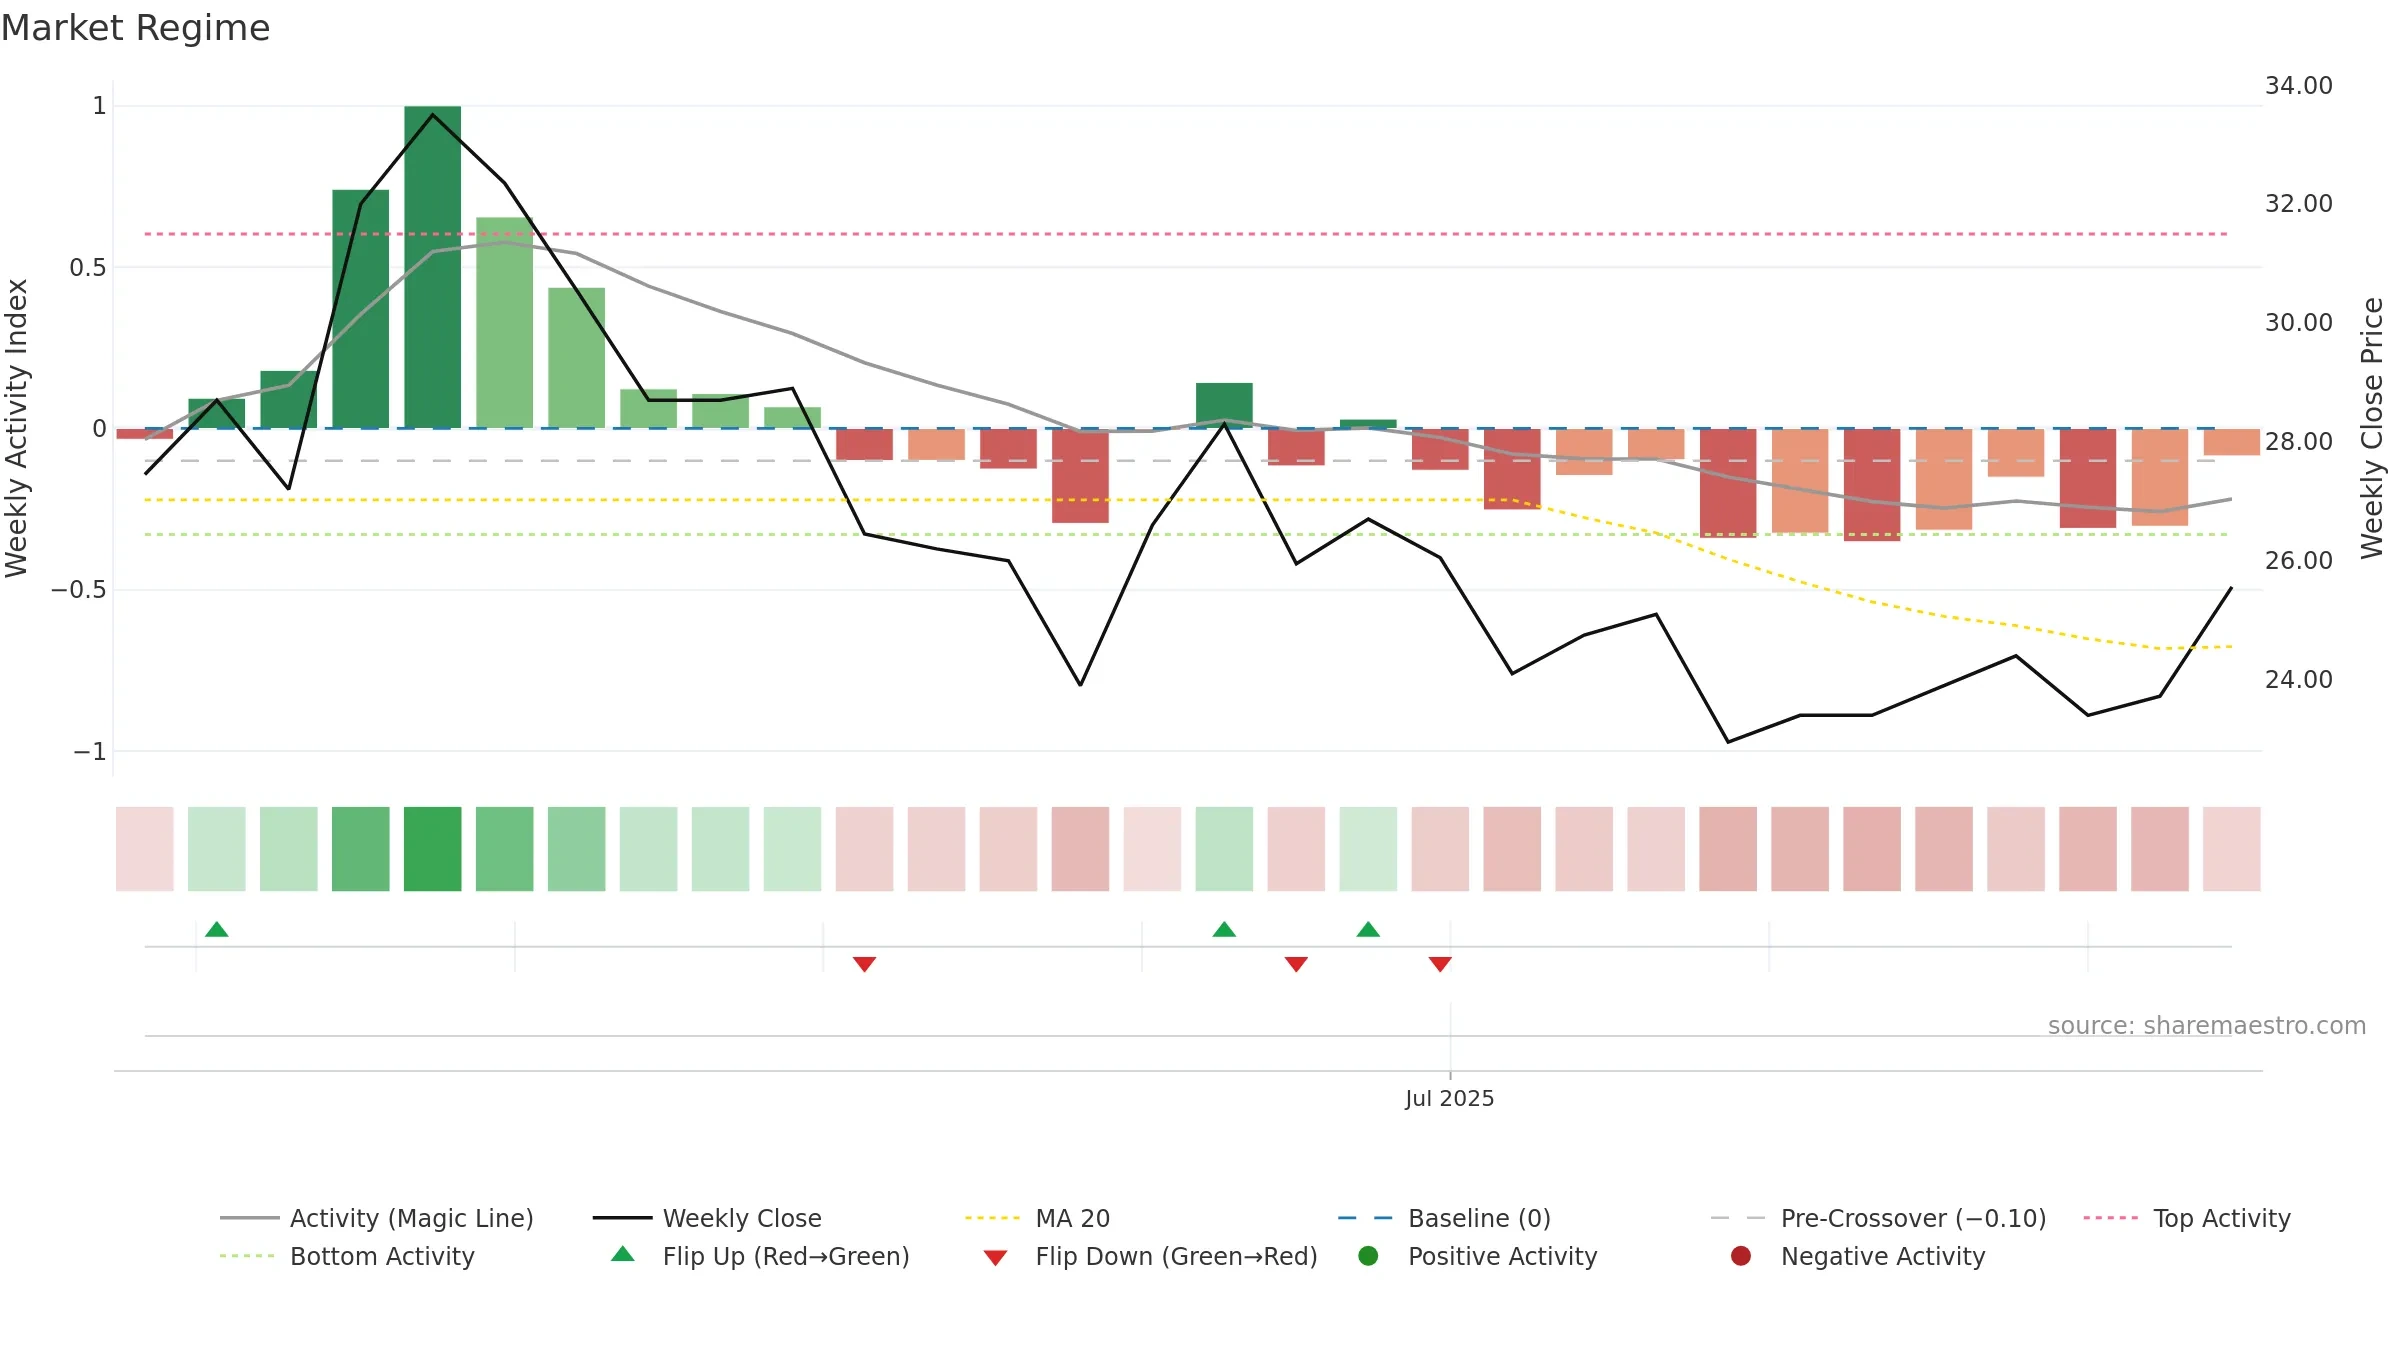
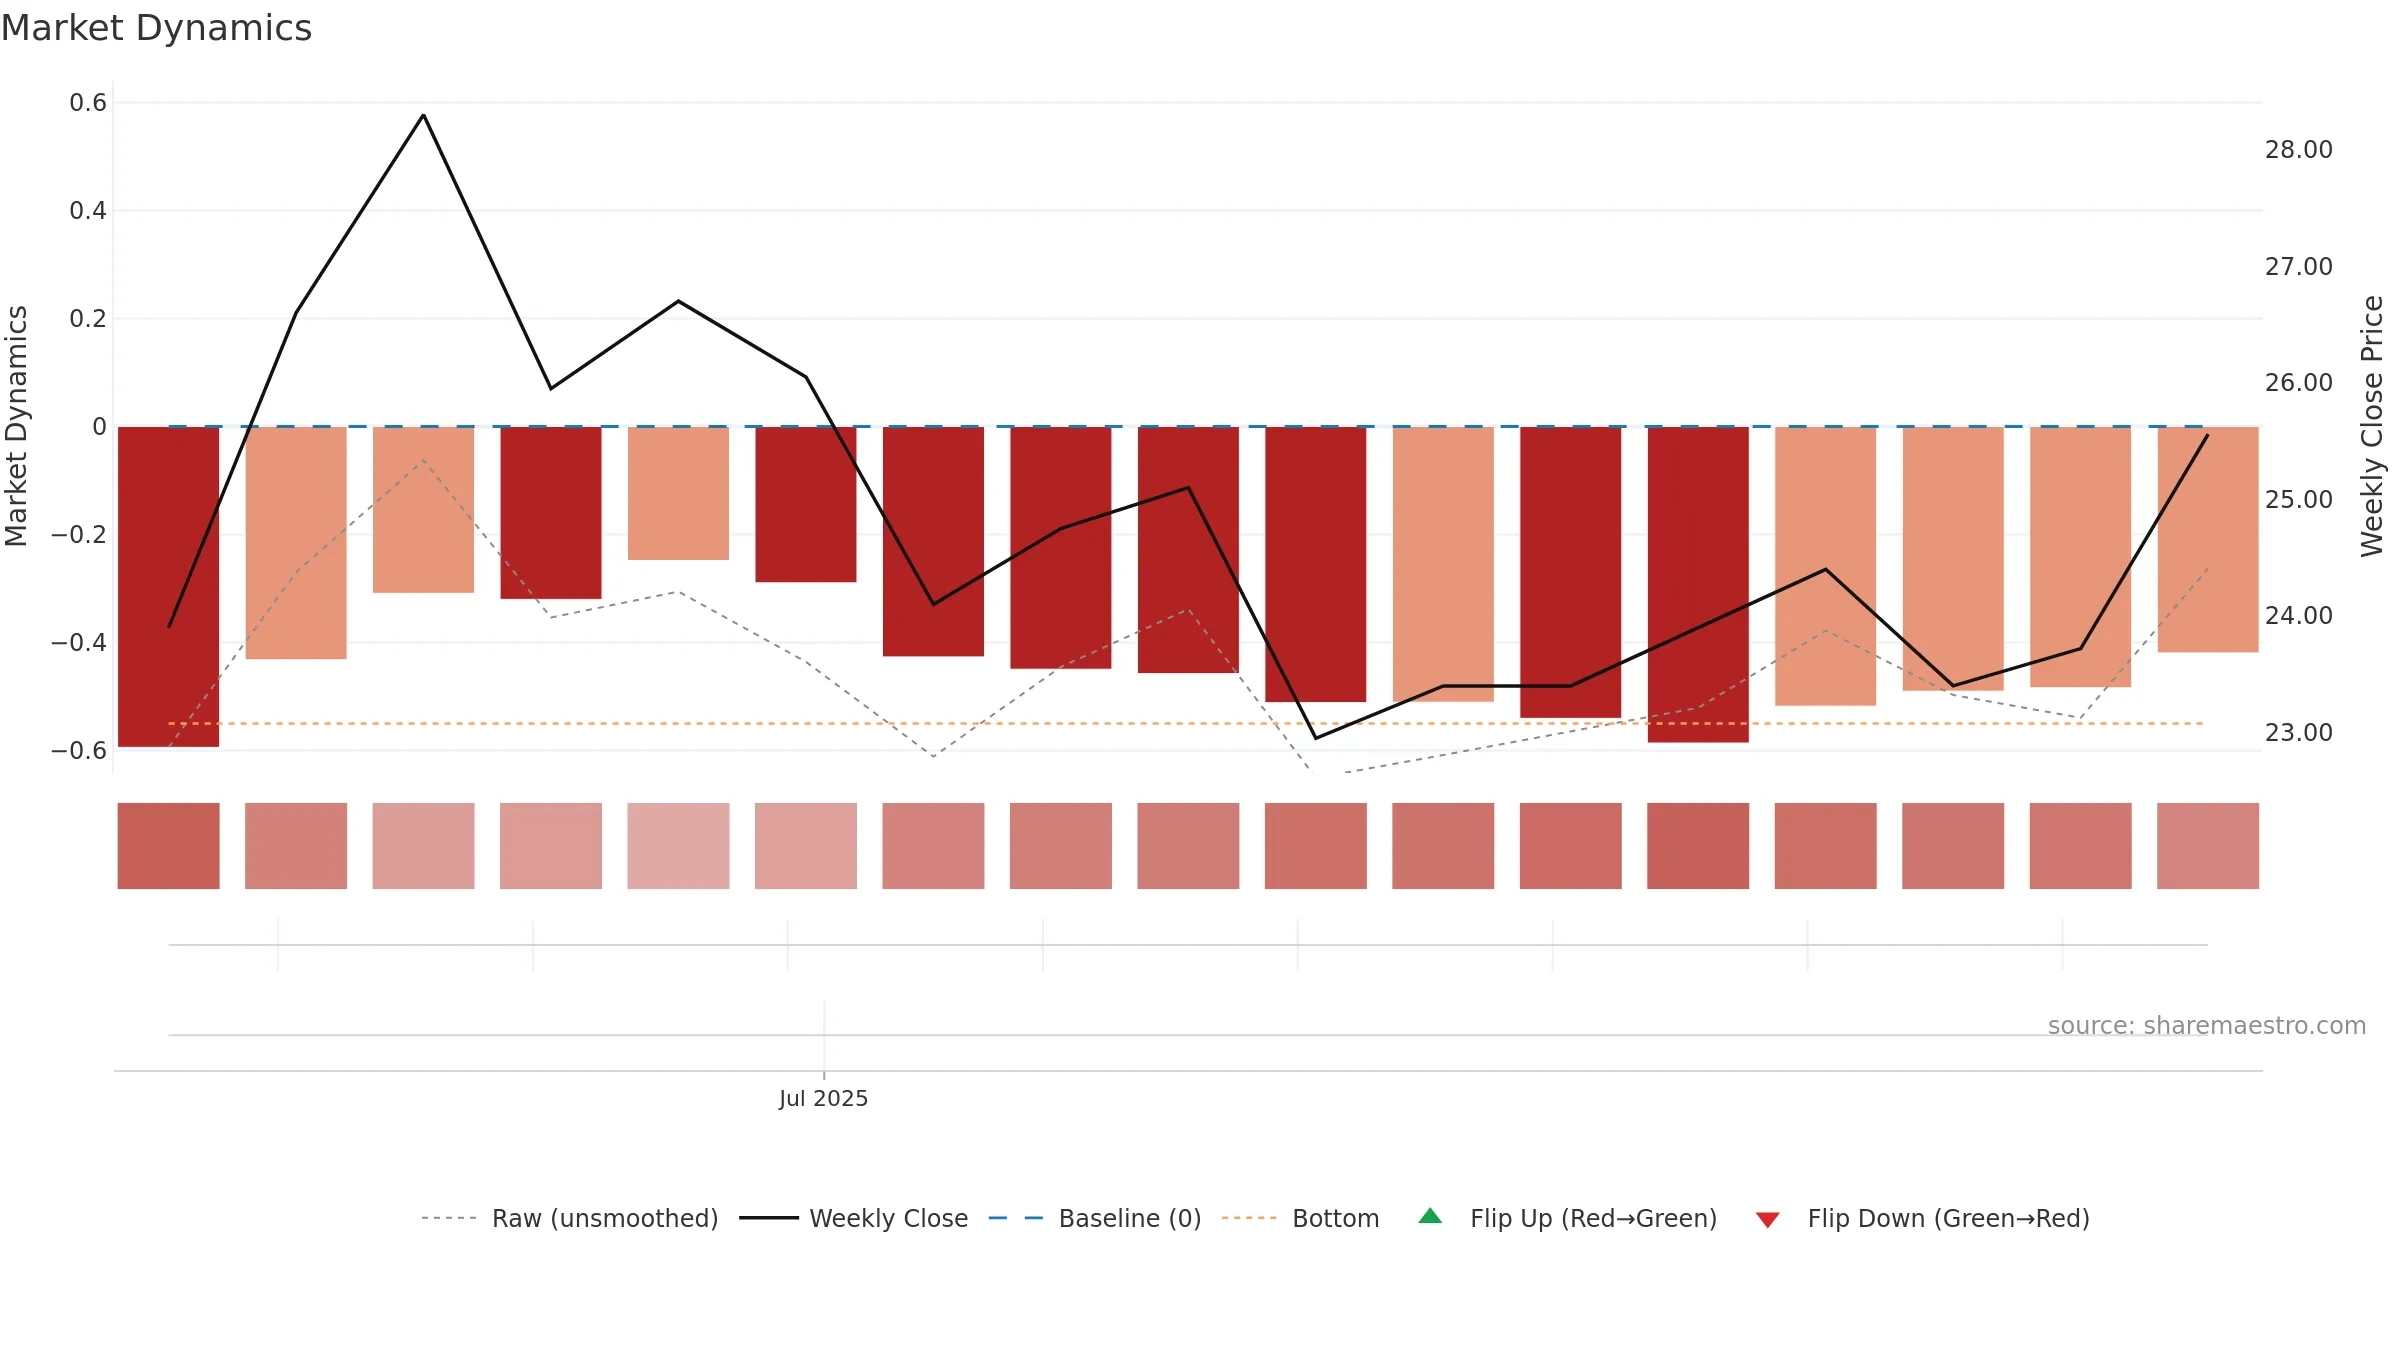
How to read this — Bearish backdrop but short-term momentum is improving; confirmation still needed.
Early improvement — look for a reclaim of 0.50→0.60 to validate.
Conclusion
Negative setup. ★★☆☆☆ confidence. Price window: 11. Trend: Bottoming Attempt; gauge 29. In combination, liquidity confirms the move.
- Early improvement from bearish zone (bottoming attempt)
- Liquidity confirms the price trend
- Solid multi-week performance
- Buyers step in at depressed levels (accumulation)
- Momentum is weak/falling
- Price is not above key averages
Why: Price window 11.37% over 8w. Close is 4.75% above the prior-window high. Volume trend rising. Liquidity convergence with price. Trend state bottoming attempt. Low-regime (≤0.25) upticks 2/2 (100.0%) • Accumulating. Momentum bearish and falling.
Tip: Most metrics include a hover tooltip where they appear in the report.