Blue Bird Corporation
BLBD NASDAQ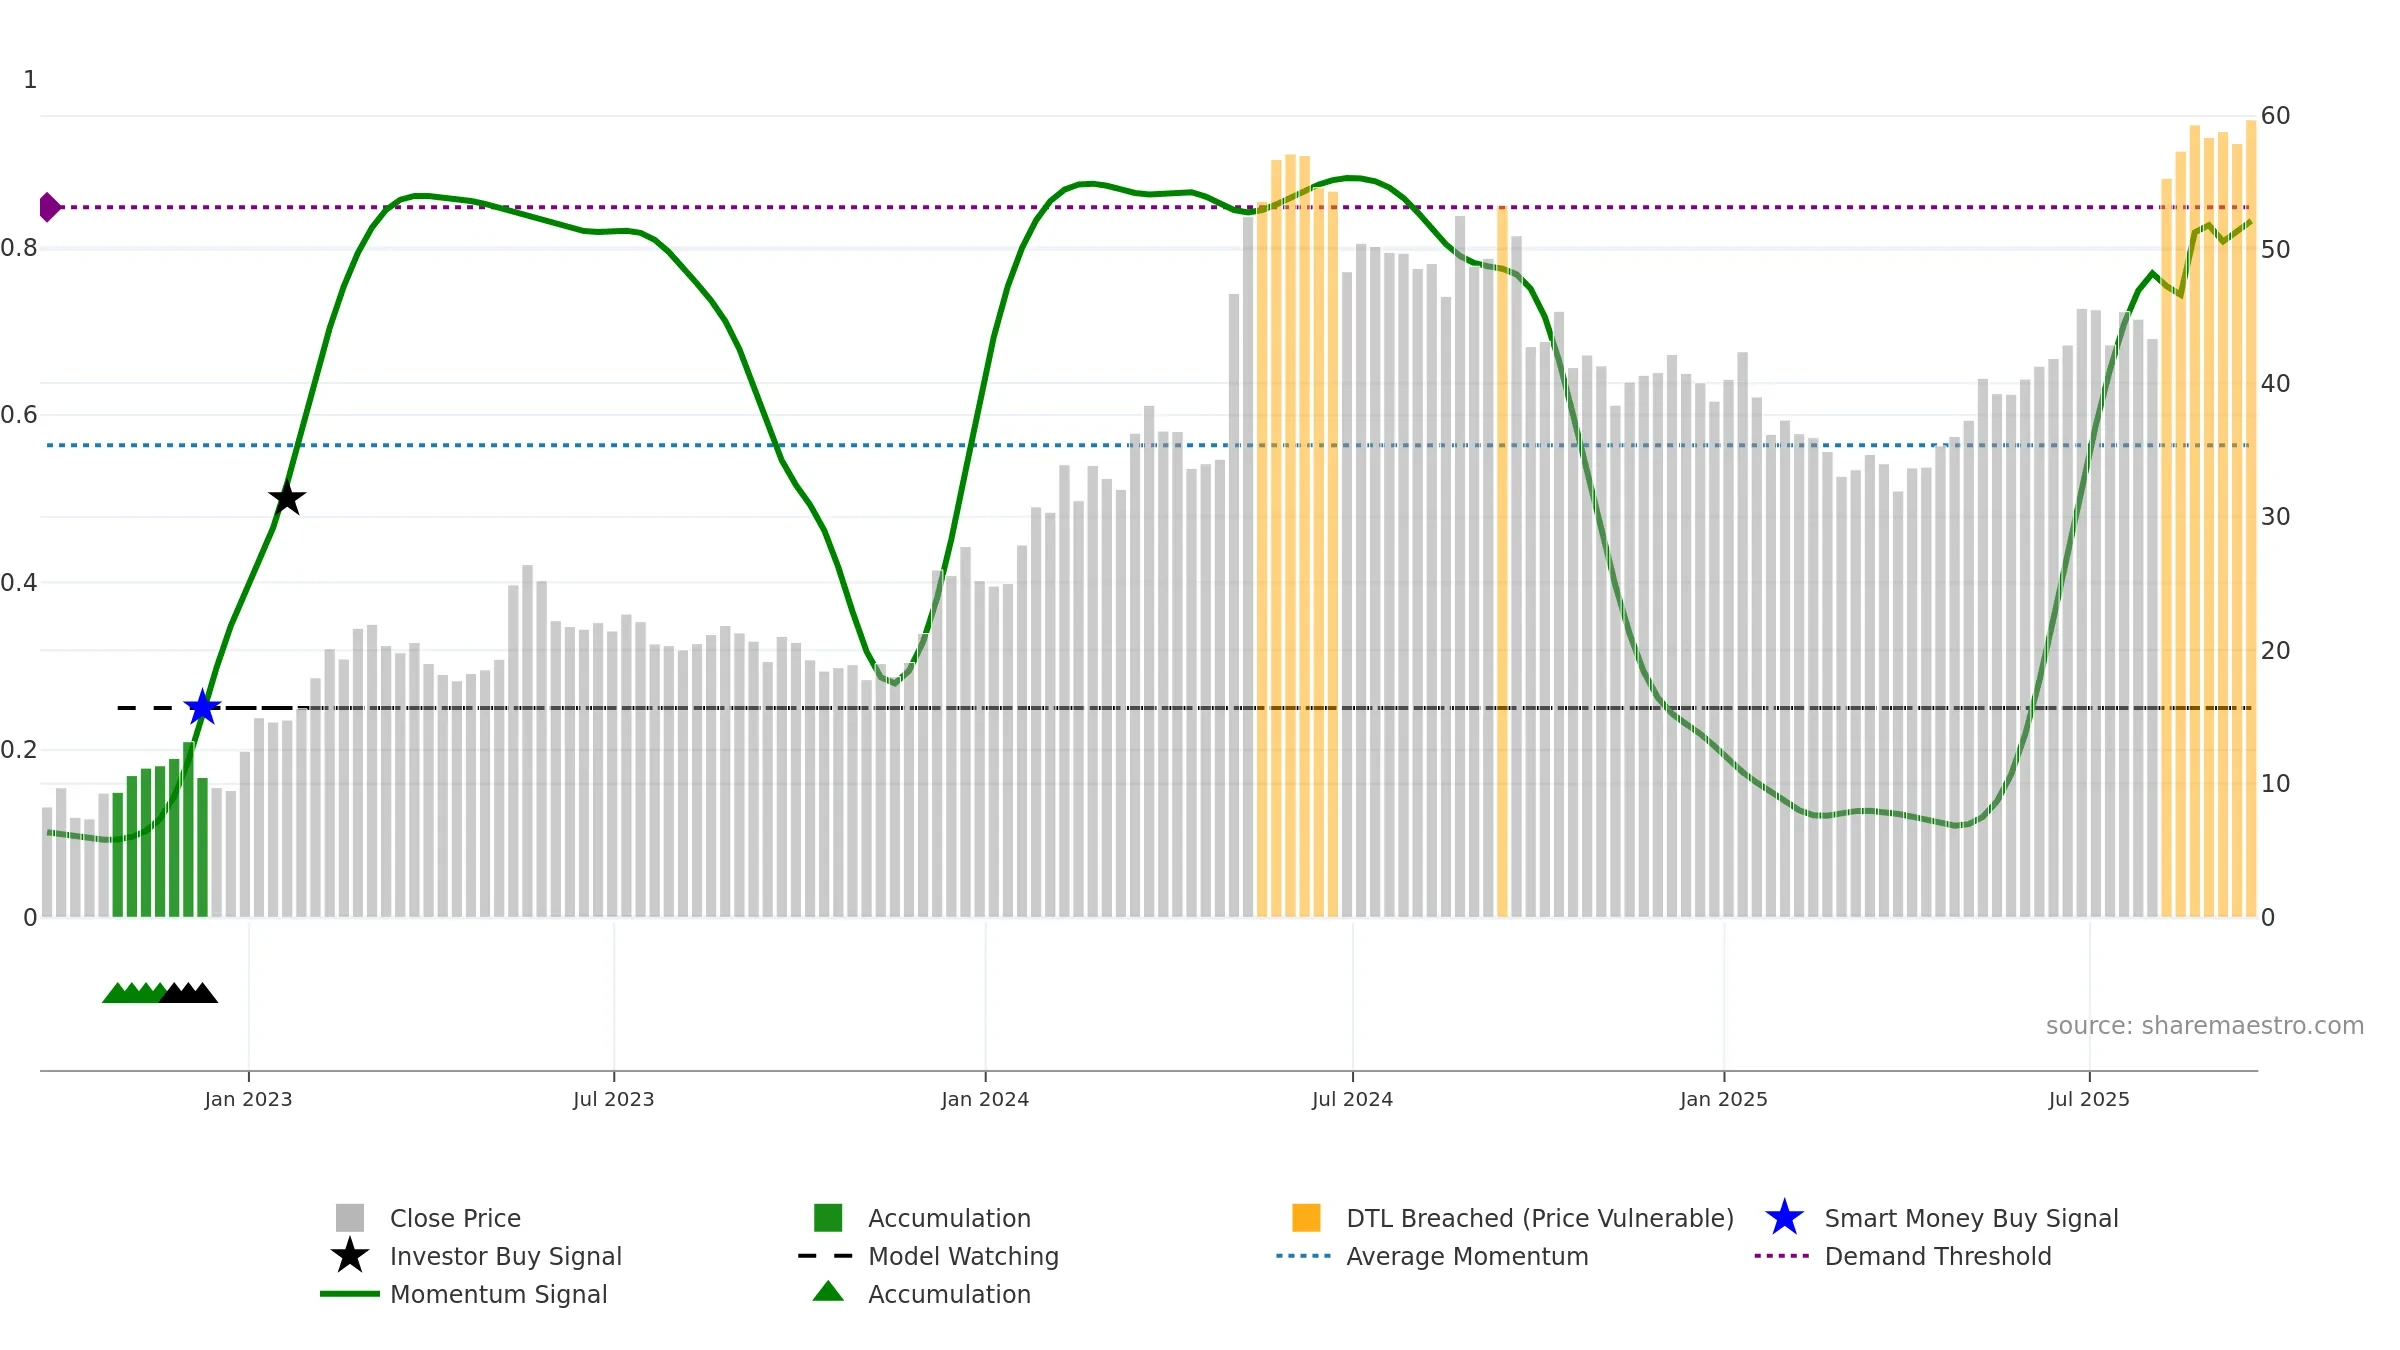
Weekly Report
Blue Bird Corporation closed at 59.7100 (-1.74% WoW) . Data window ends Fri, 19 Sep 2025.
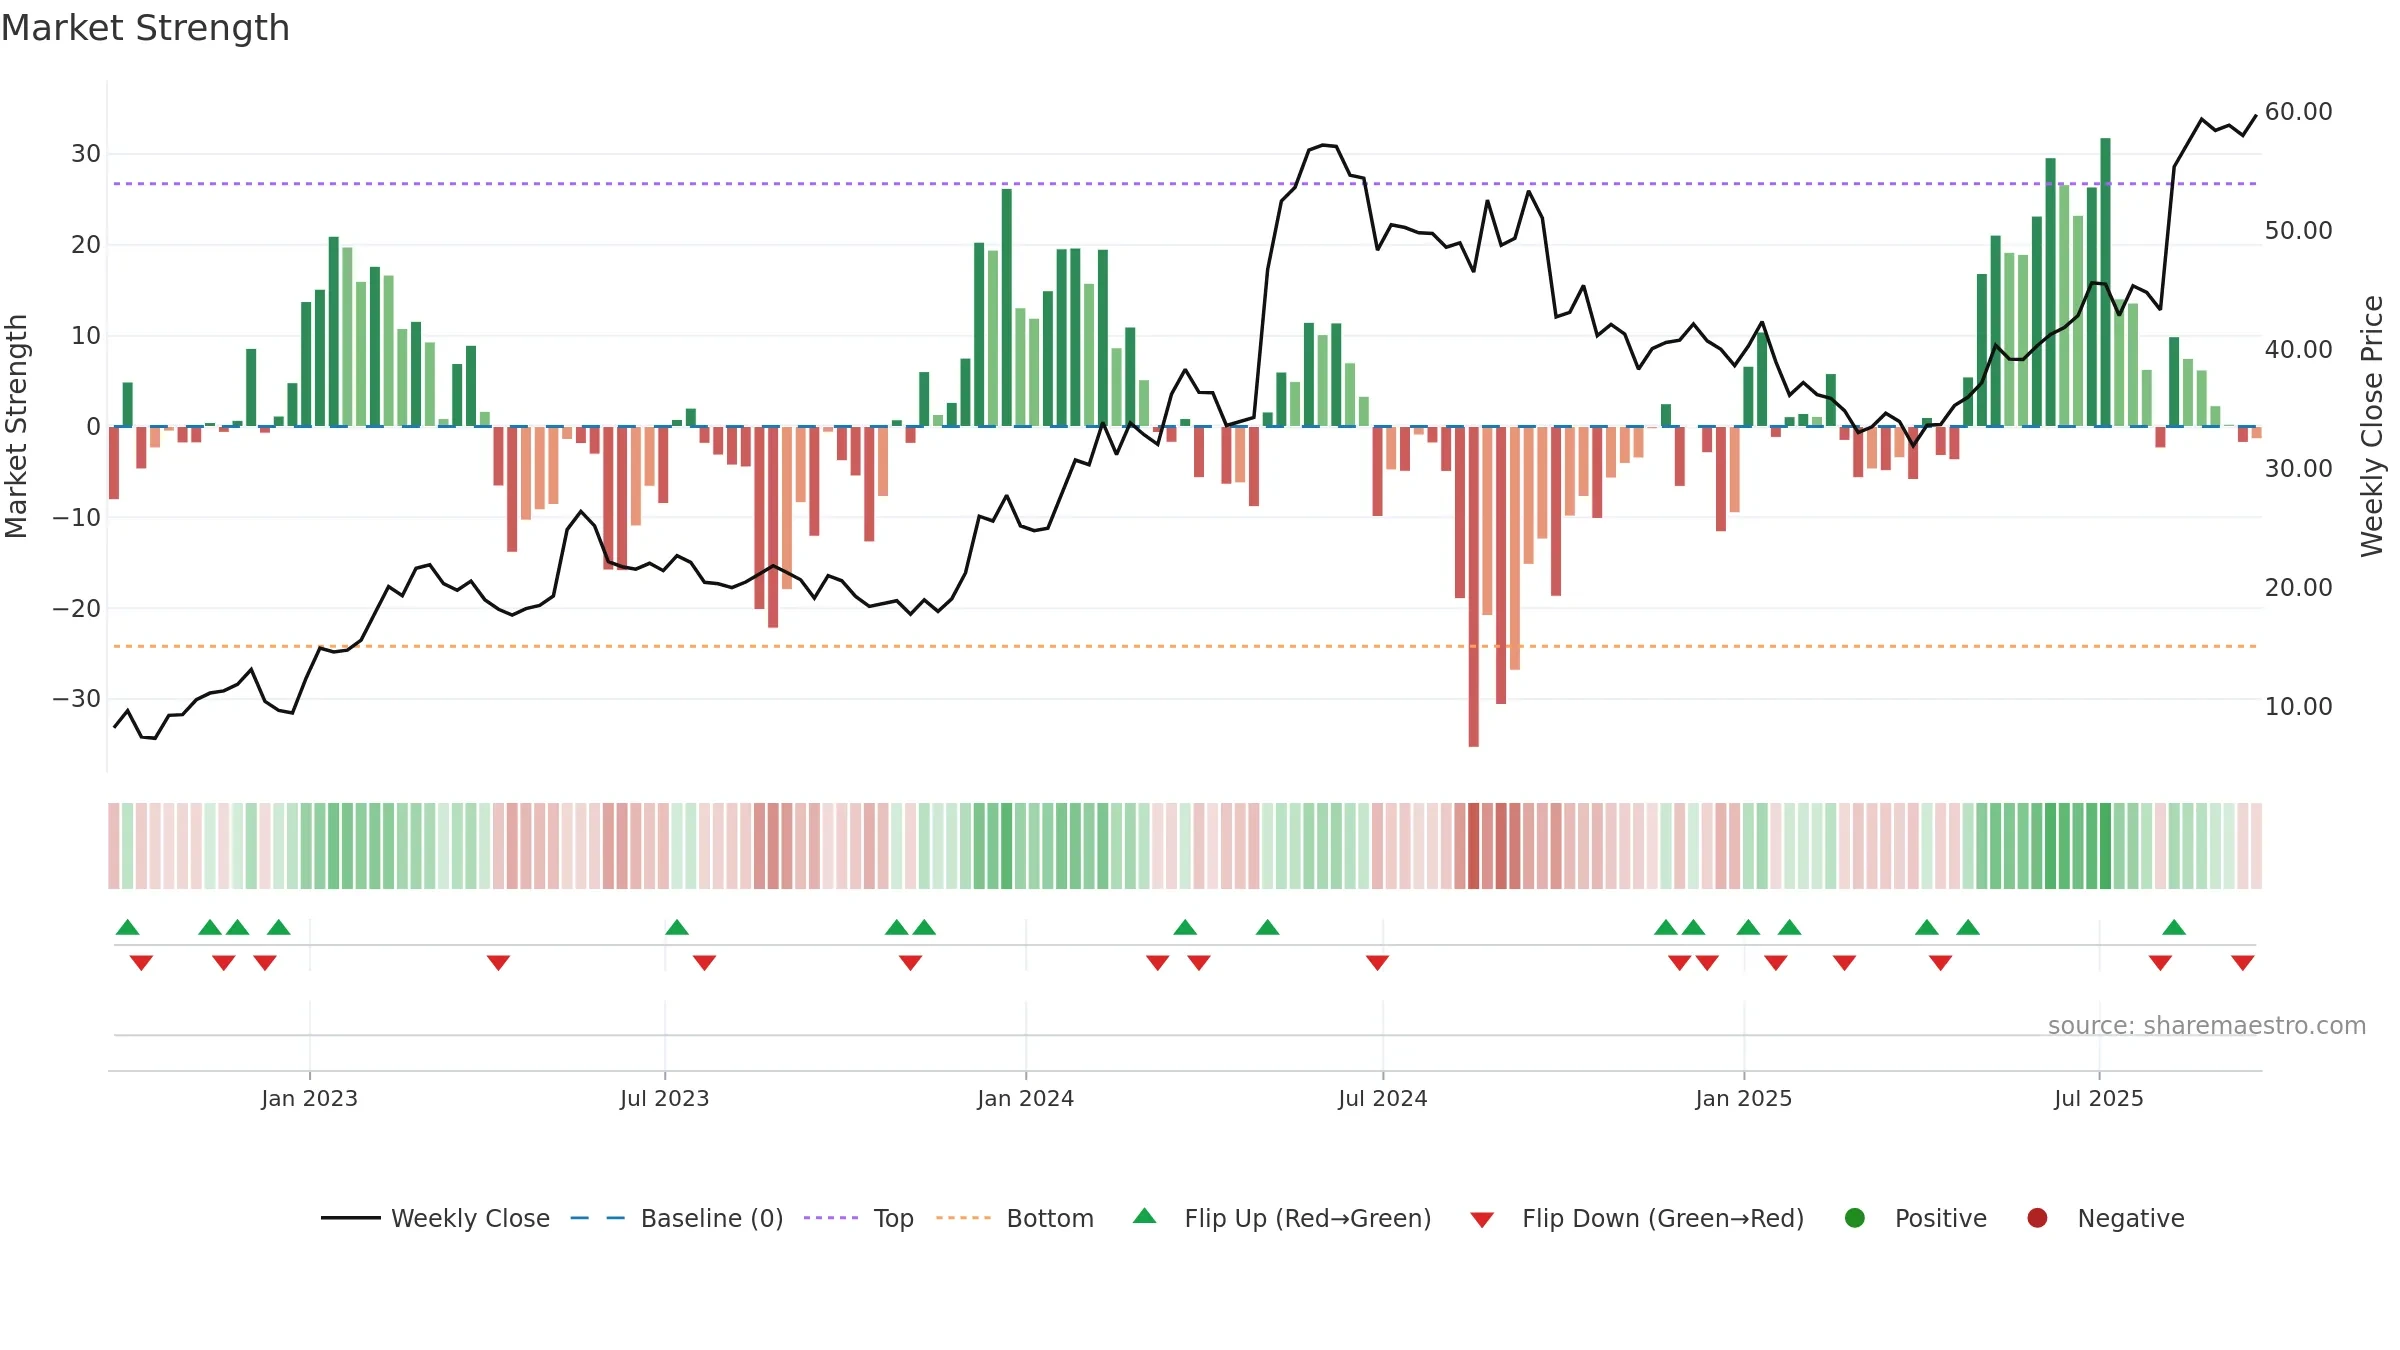
How to read this — Price slope is upward, indicating persistent buying over the window. Volume trend diverges from price — watch for fatigue or rotation. Returns are positively correlated with volume — strength tends to arrive on higher activity. Distance to baseline is narrowing — reverting closer to its fair-value track. Constructive MA stack supports the up-drift; pullbacks may find support at the 8–13 week region. Price holds above key averages, indicating constructive participation.
Up-slope supports buying interest; pullbacks may be contained if activity stays firm. Because liquidity isn’t confirming, prefer evidence of fresh demand before chasing moves.
Gauge maps the trend signal to a 0–100 scale.
How to read this — High gauge and rising momentum — buyers in control.
Bias remains higher; pullbacks could be buyable if participation holds.
Price is below fair value; potential upside if momentum constructive.
Conclusion
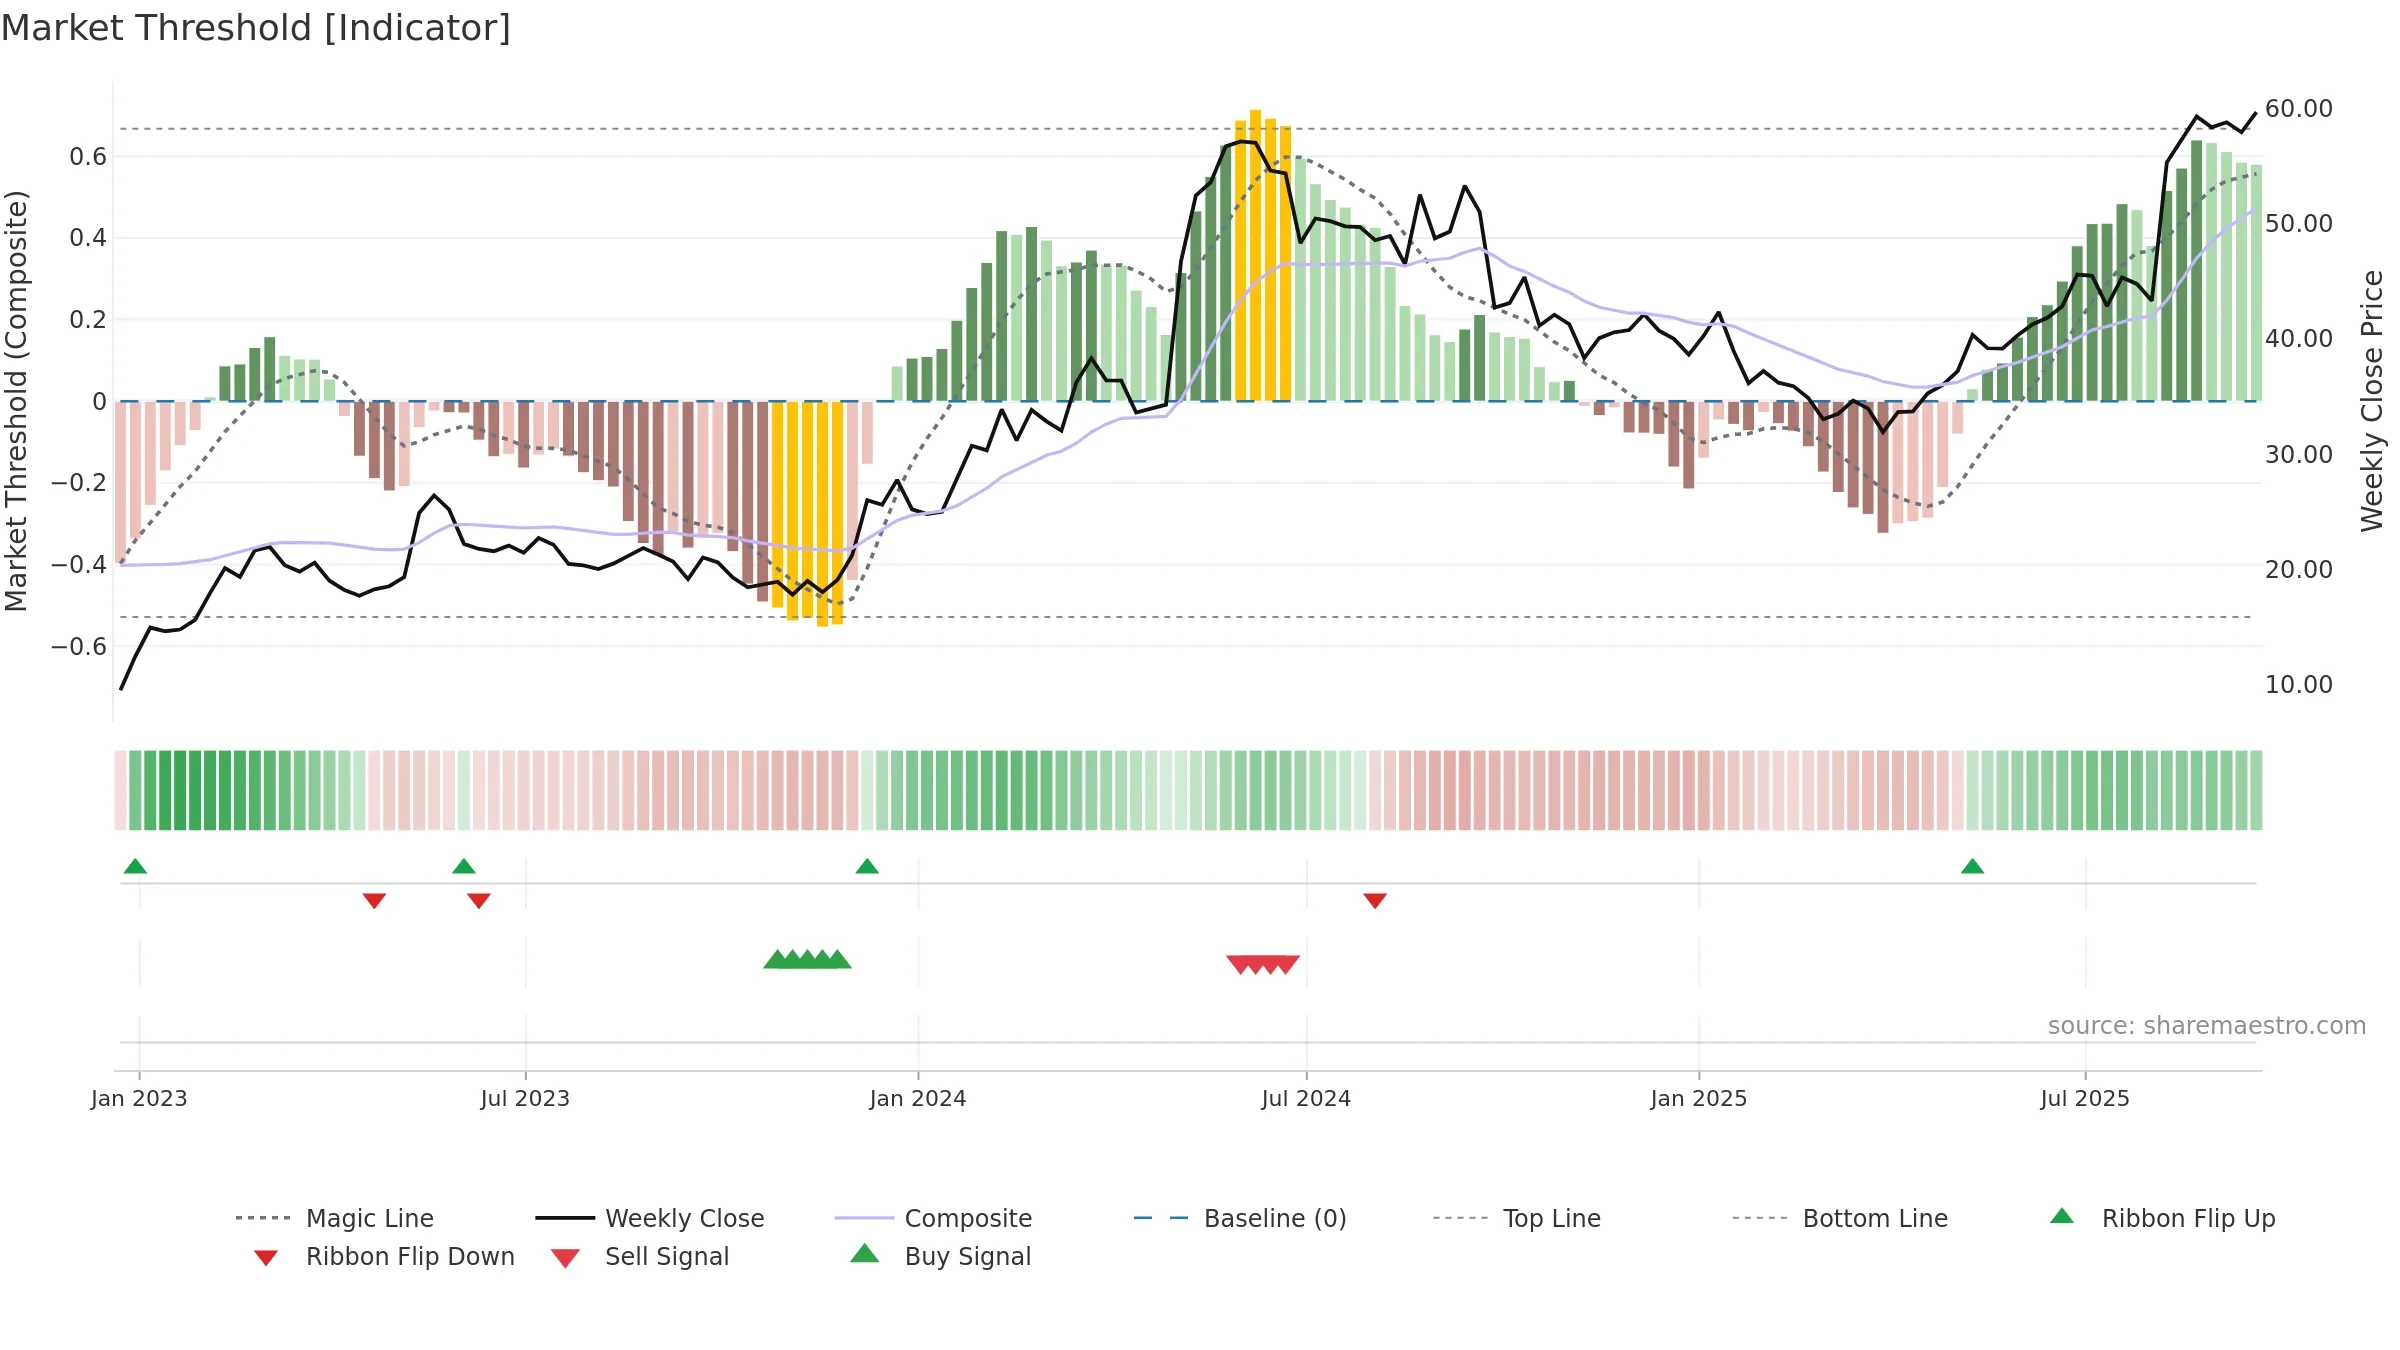
Positive setup. ★★★★☆ confidence. Price window: 37. Trend: Strong Uptrend; gauge 83. In combination, liquidity diverges from price.
- High gauge with rising momentum (strong uptrend)
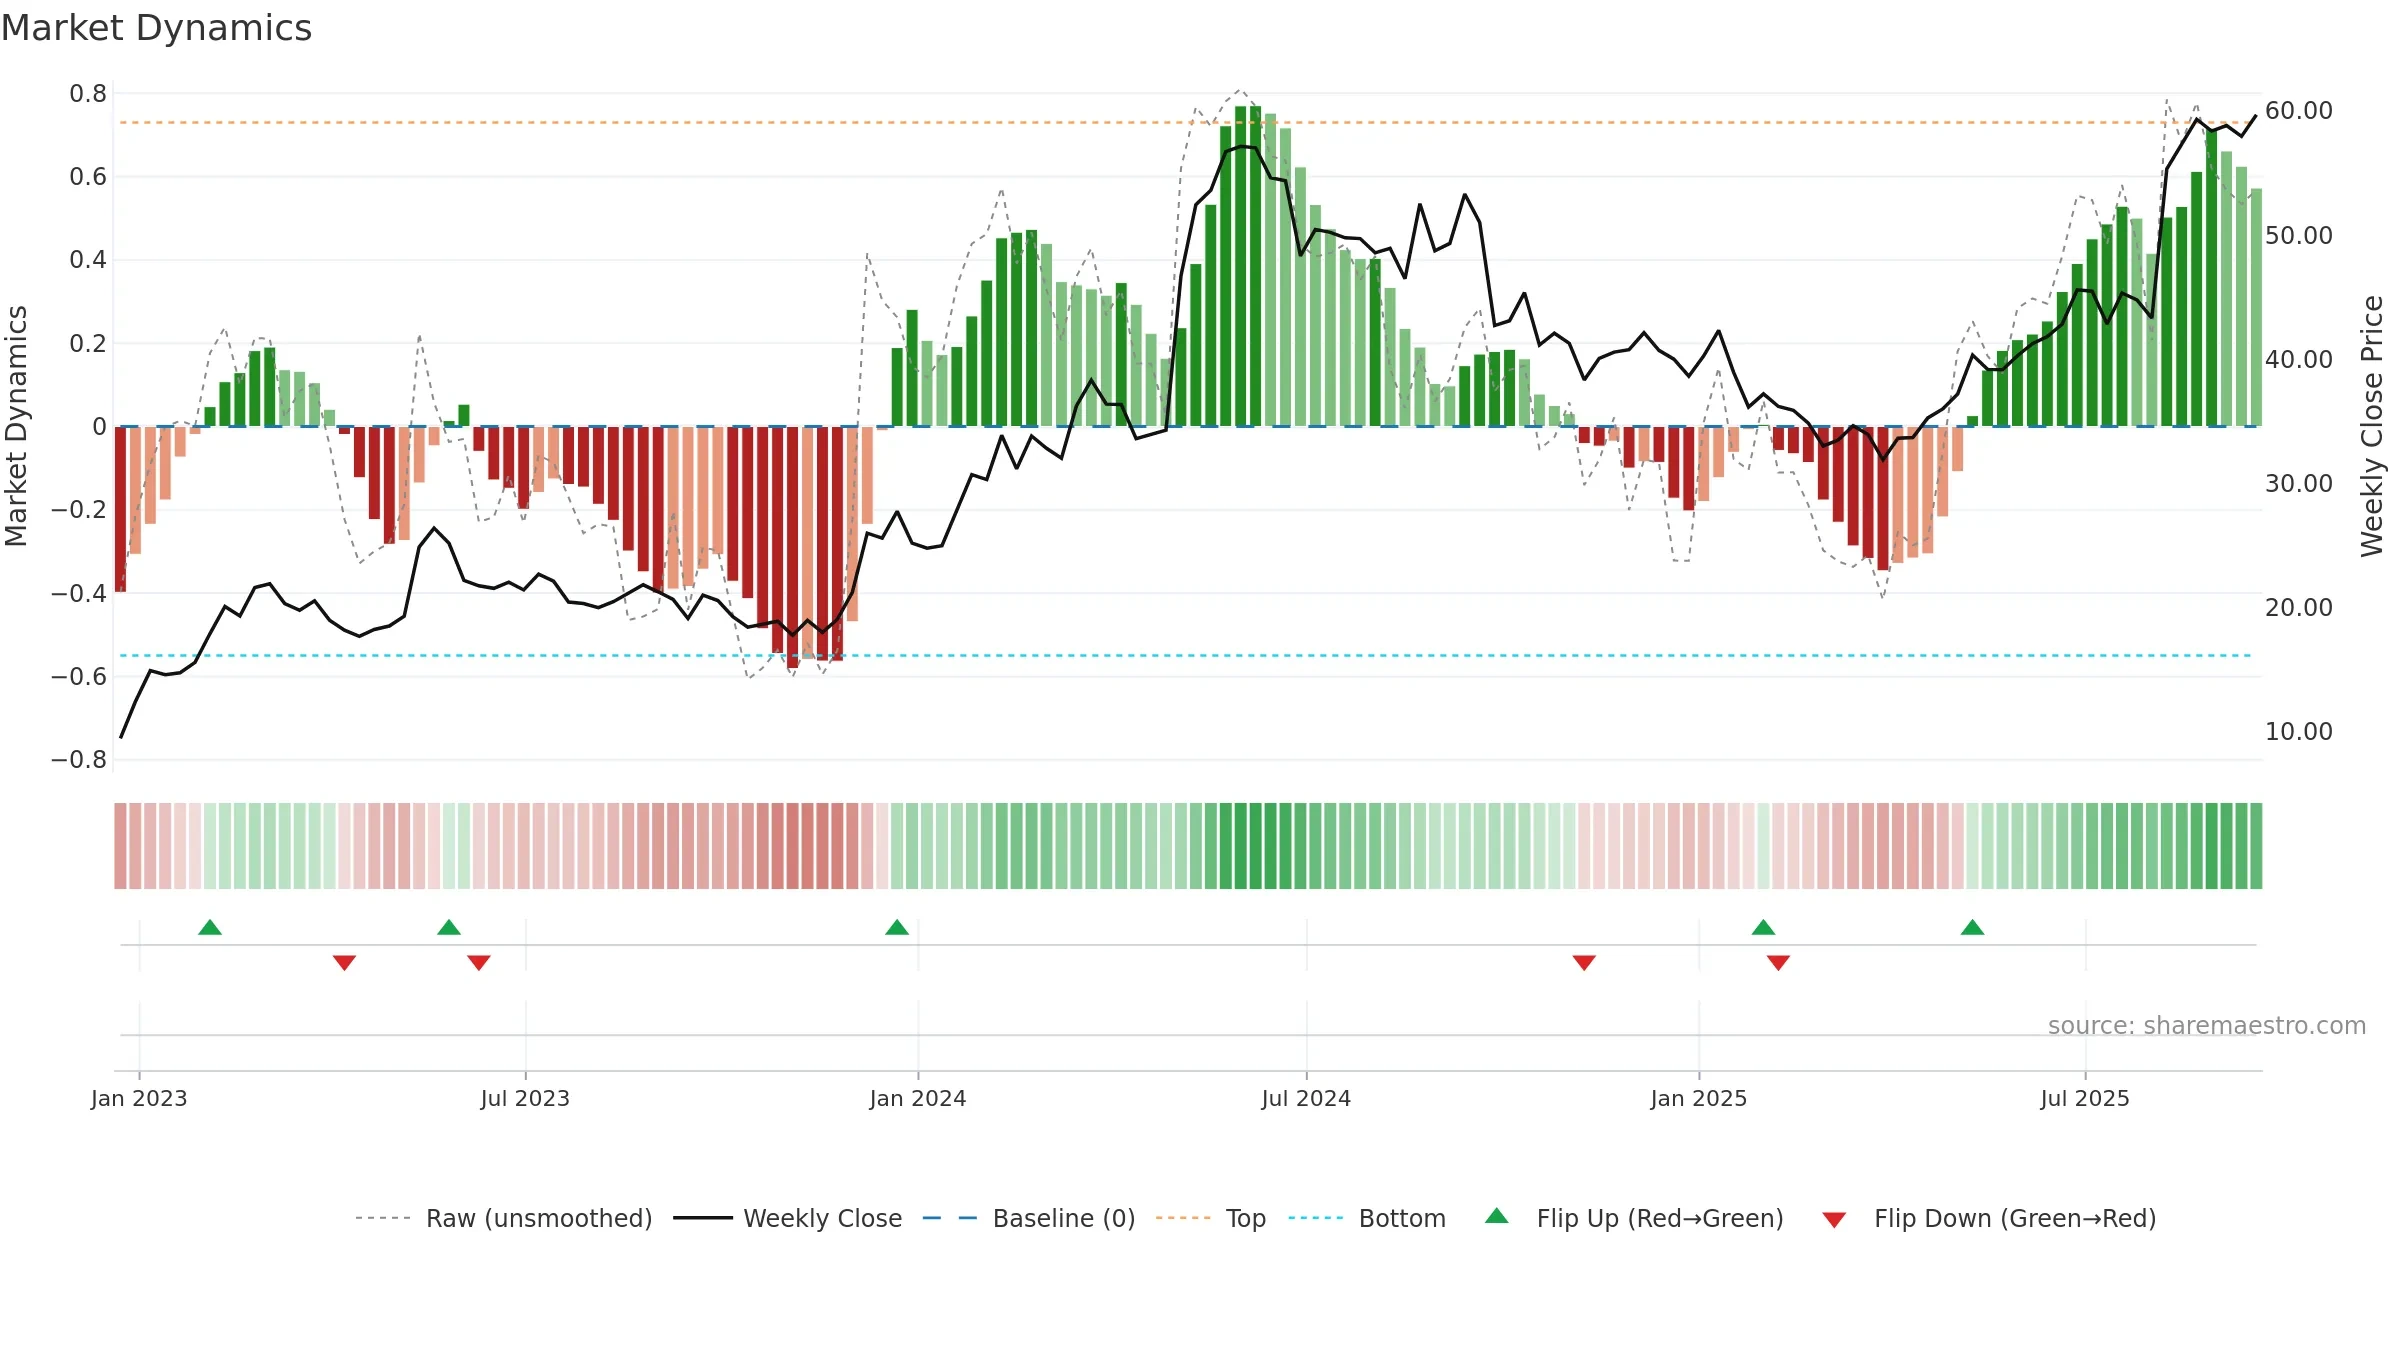
- Momentum is bullish and rising
- Price holds above 8w & 26w averages
- Constructive moving-average stack
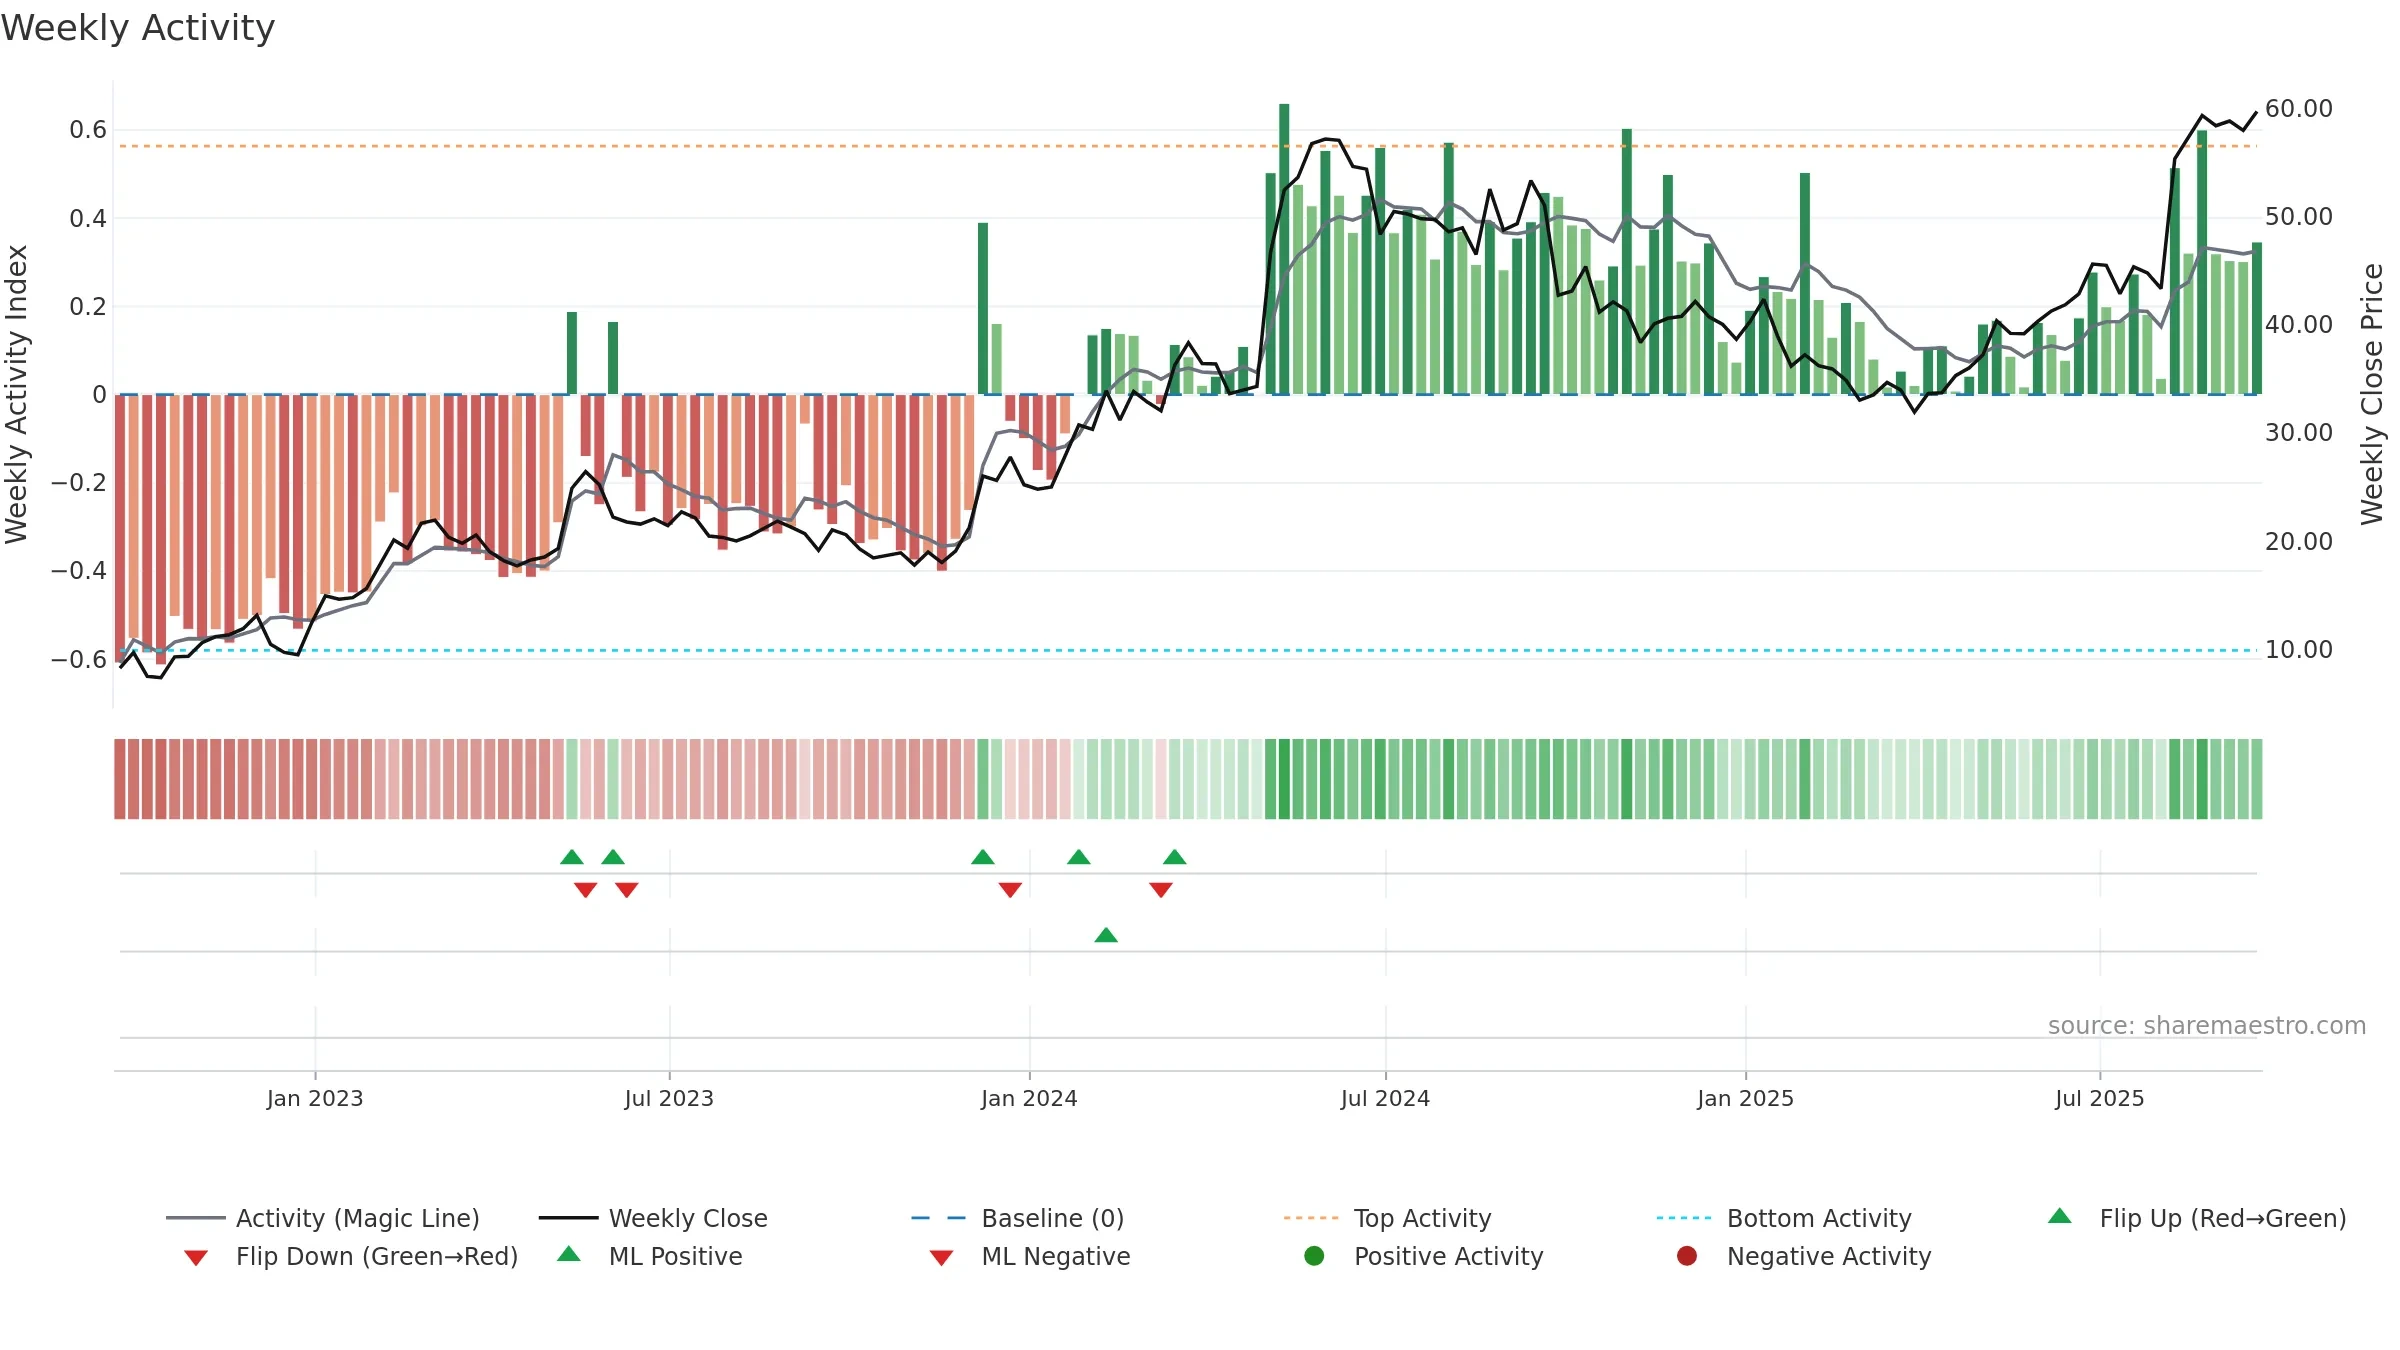
- Liquidity diverges from price
Why: Price window 37.80% over 8w. Close is 0.62% above the prior-window high. Volume trend falling. Liquidity divergence with price. Trend state strong uptrend. High-regime (0.80–1.00) downticks 1/4 (25.0%) • Accumulating. MA stack constructive. Momentum bullish and rising. Valuation supportive skew.
Tip: Most metrics include a hover tooltip where they appear in the report.