CTS Corporation
CTS NYSE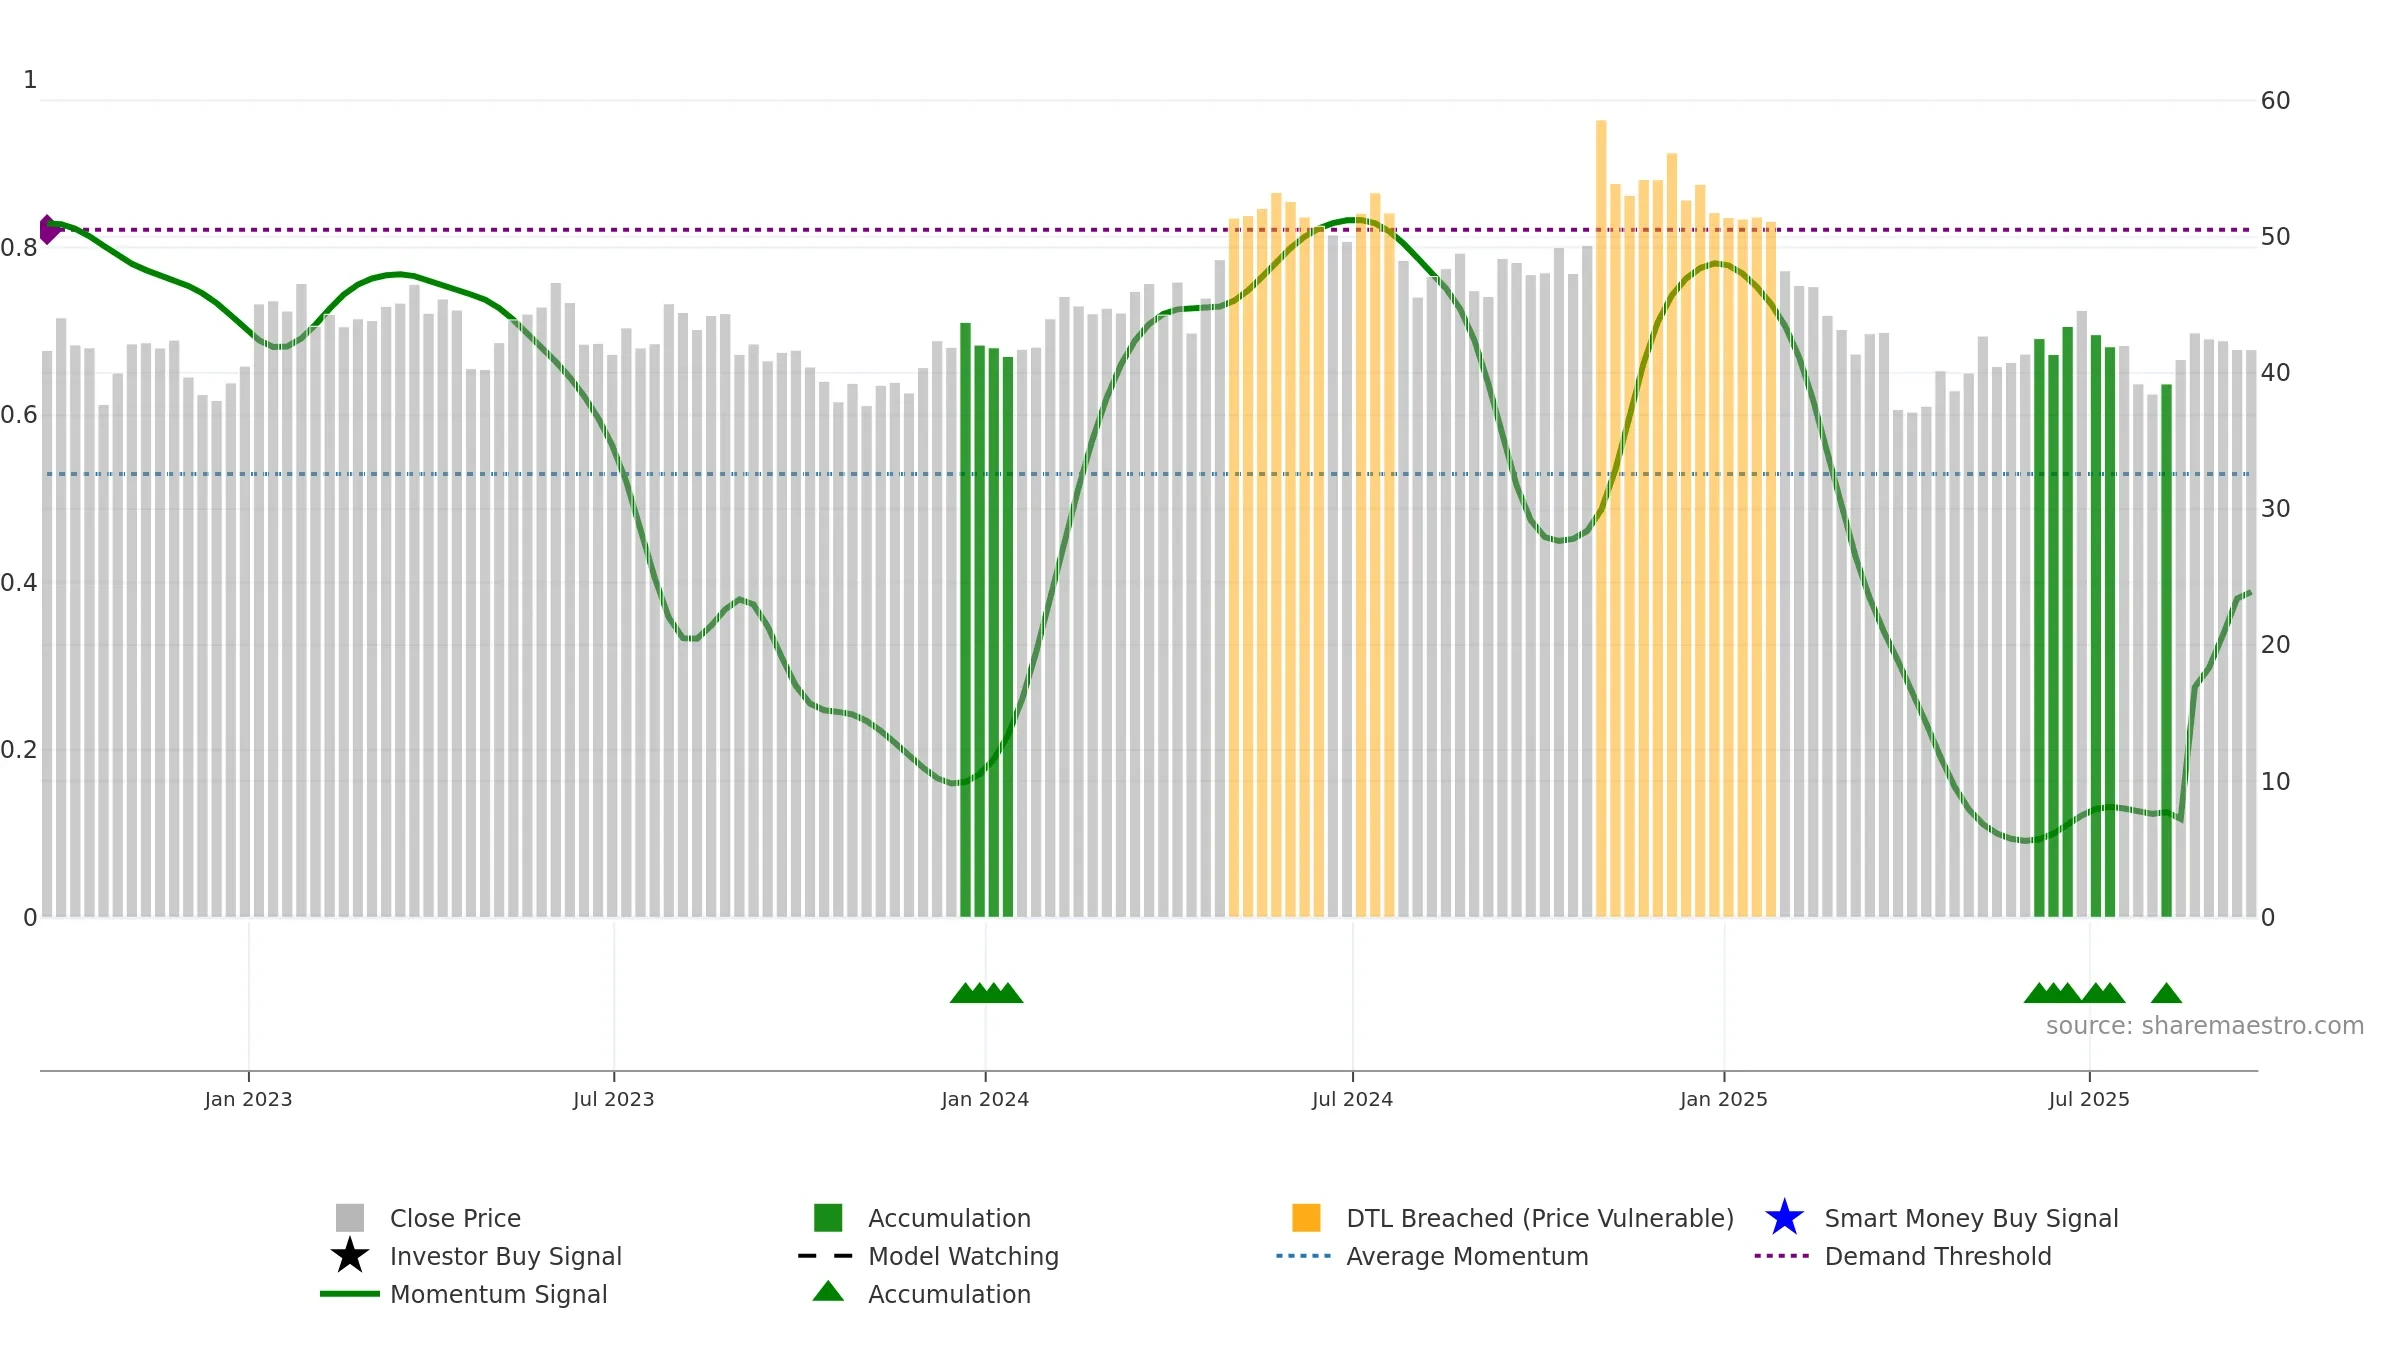
Weekly Report
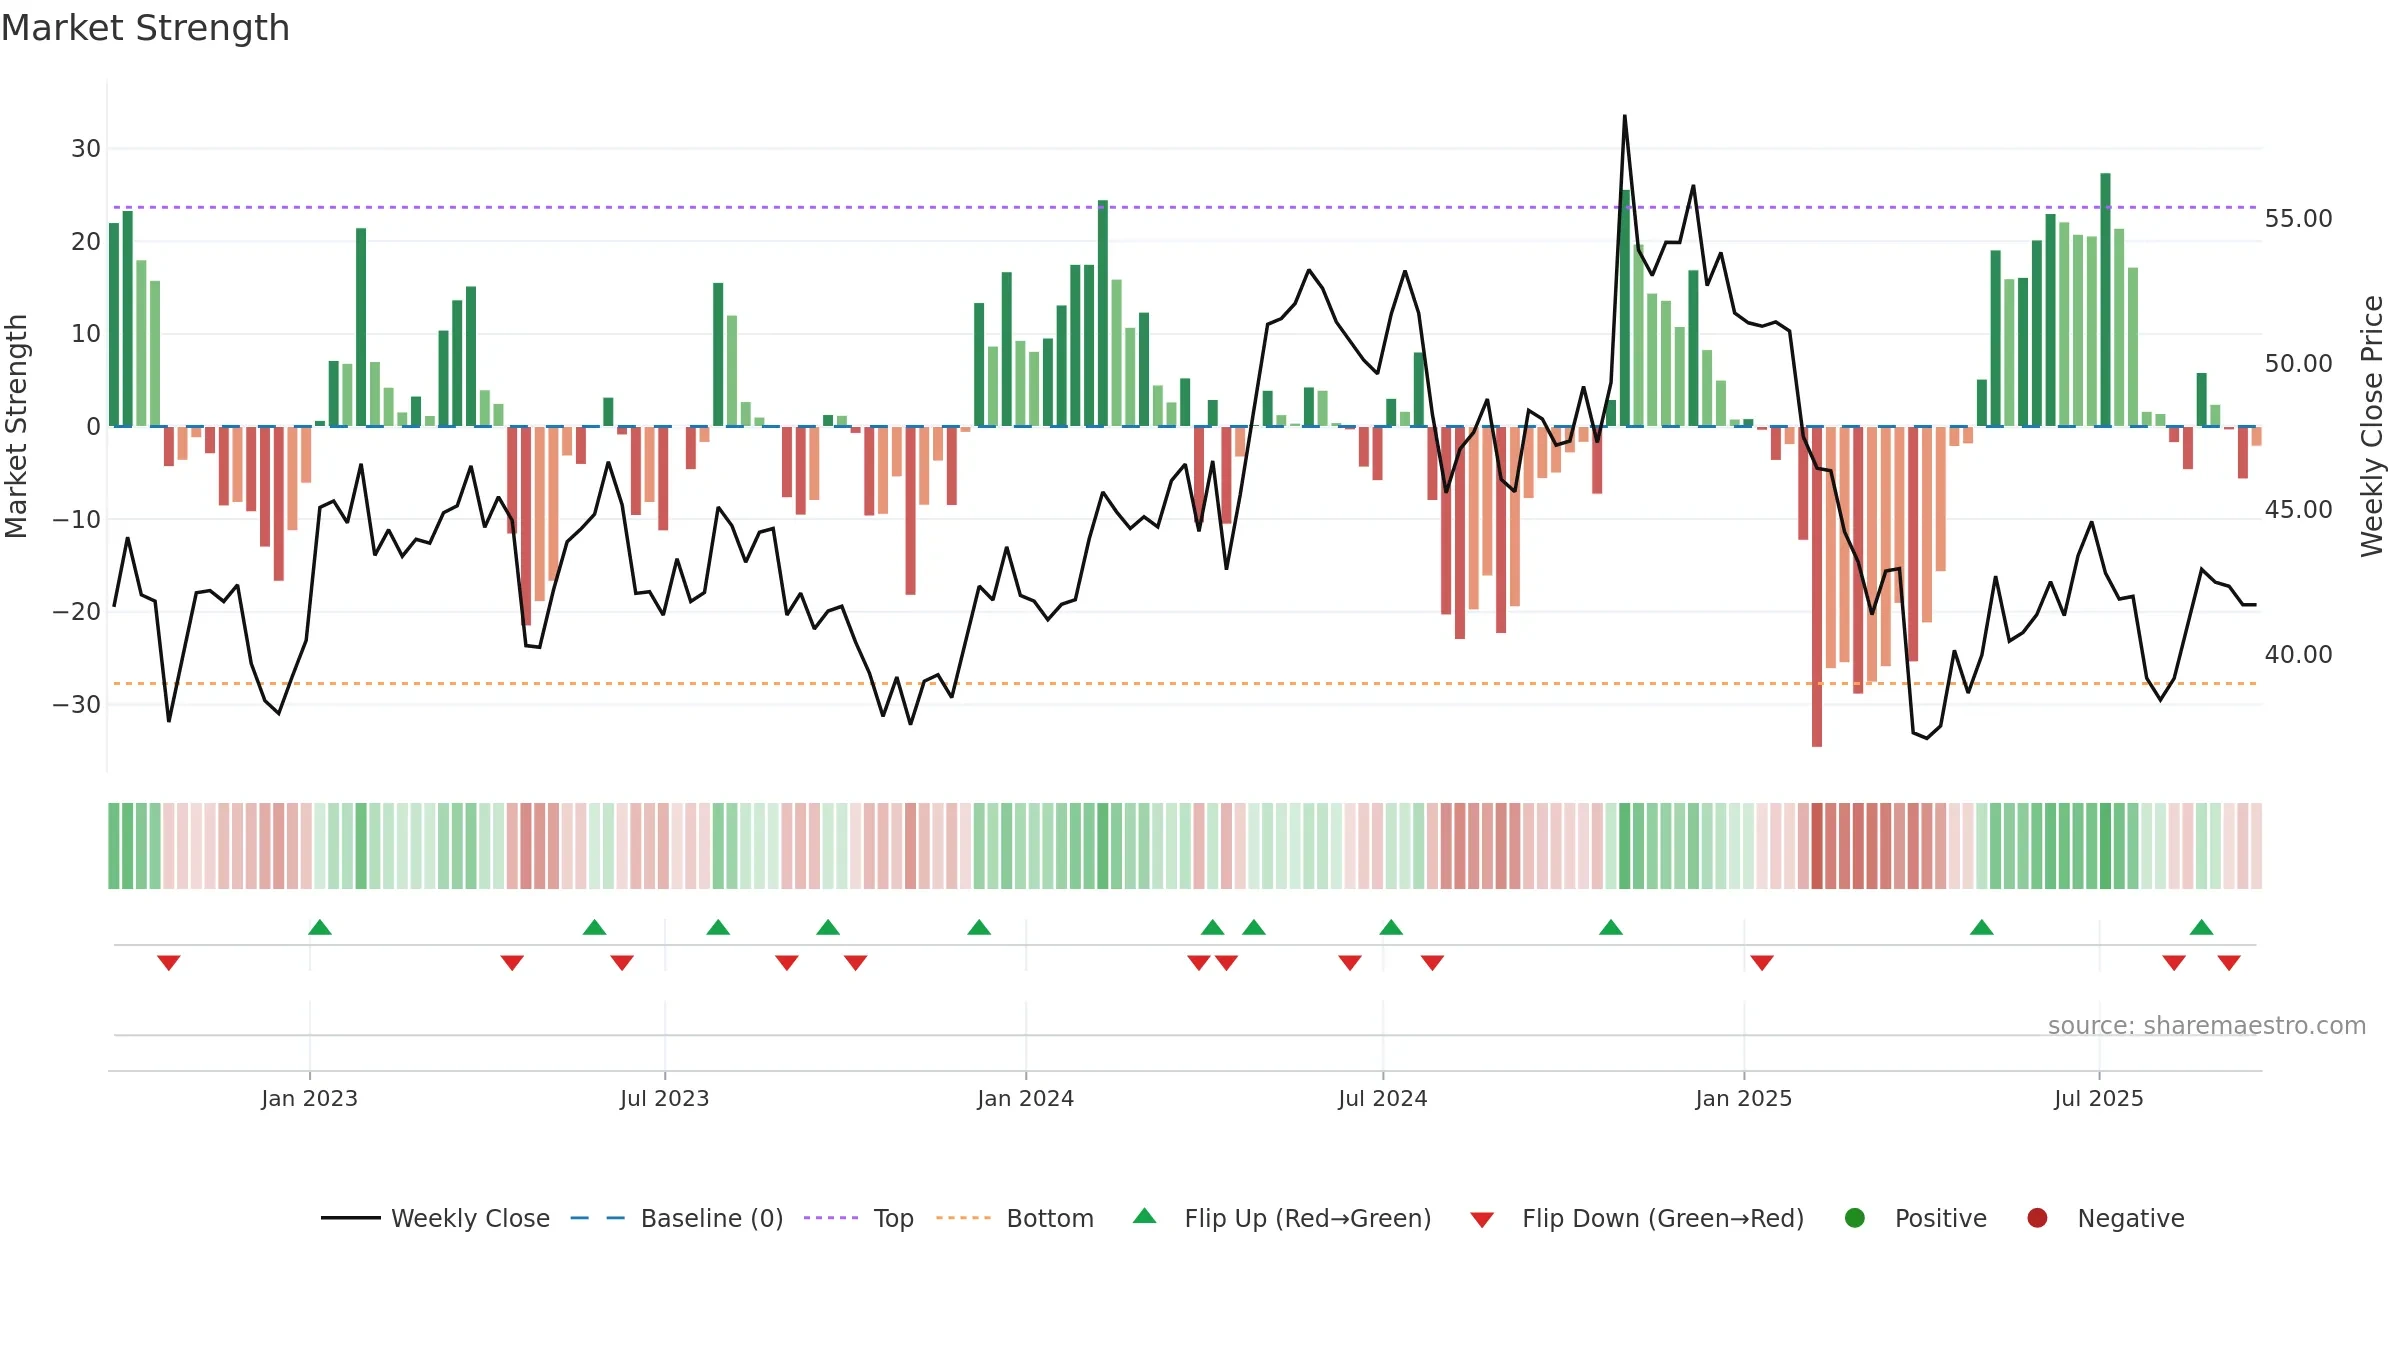
CTS Corporation closed at 41.7100 (-2.43% WoW) . Data window ends Fri, 19 Sep 2025.
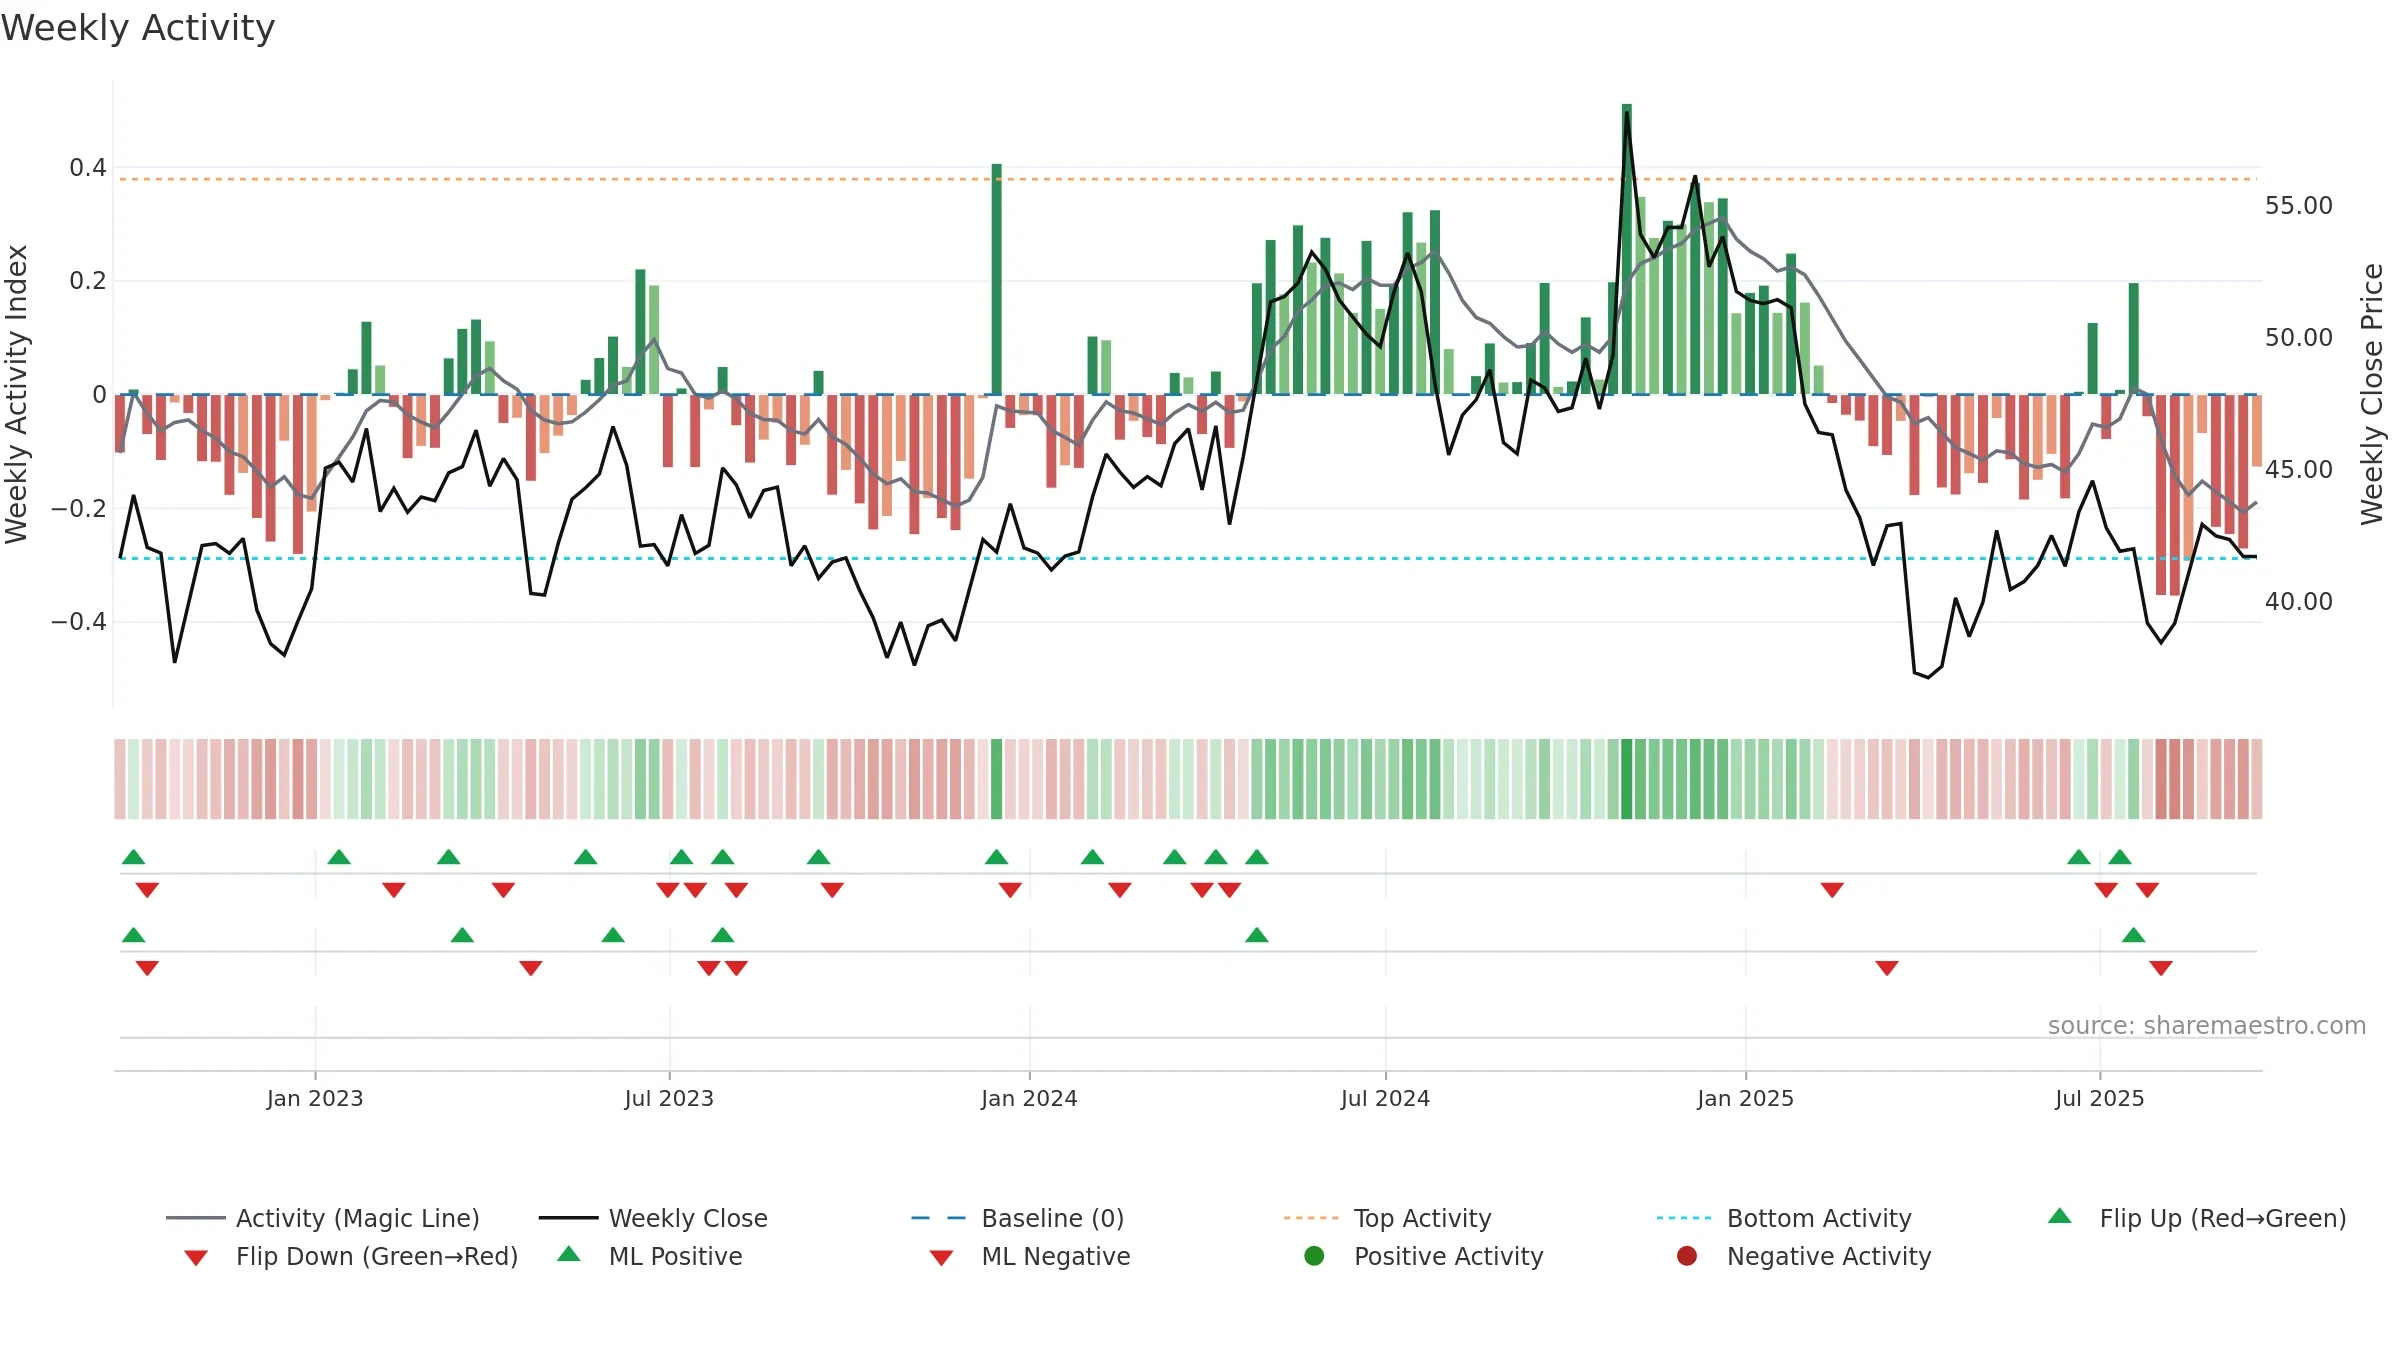
How to read this — Price slope is upward, indicating persistent buying over the window. Low weekly volatility favours steadier follow-through. Volume and price are moving in the same direction — a constructive confirmation. Distance to baseline is narrowing — reverting closer to its fair-value track. Price holds above key averages, indicating constructive participation.
Up-slope supports buying interest; pullbacks may be contained if activity stays firm.
Gauge maps the trend signal to a 0–100 scale.
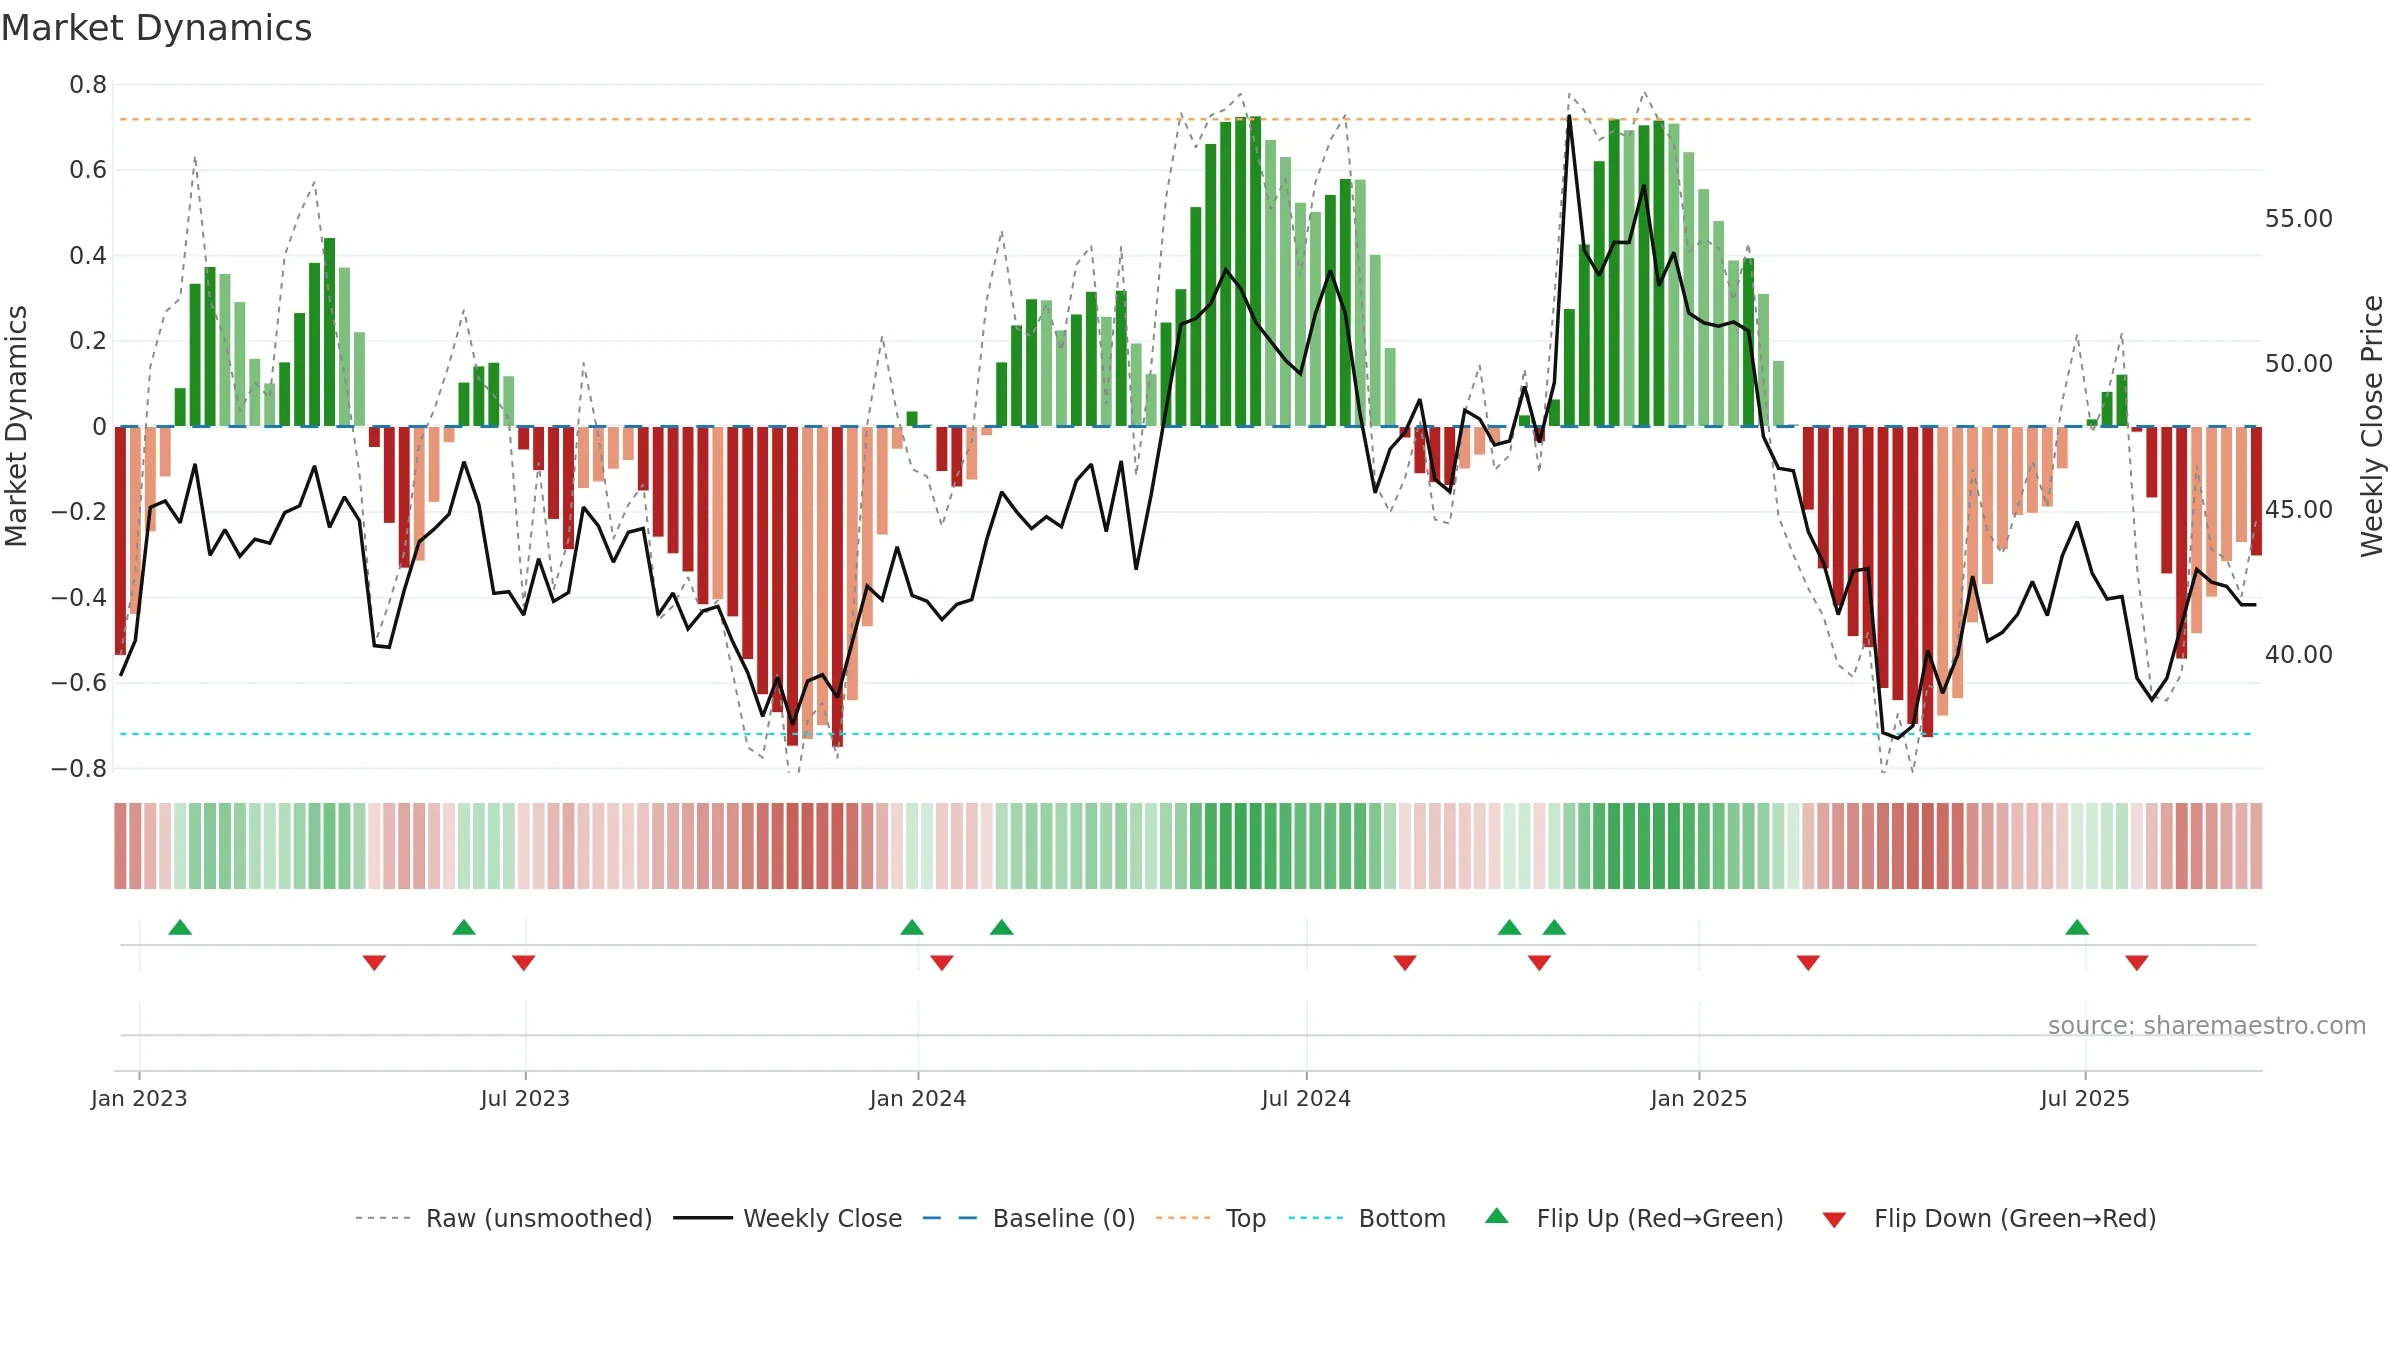
How to read this — Bearish backdrop but short-term momentum is improving; confirmation still needed.
Early improvement — look for a reclaim of 0.50→0.60 to validate.
Price is below fair value; potential upside if momentum constructive.
Conclusion
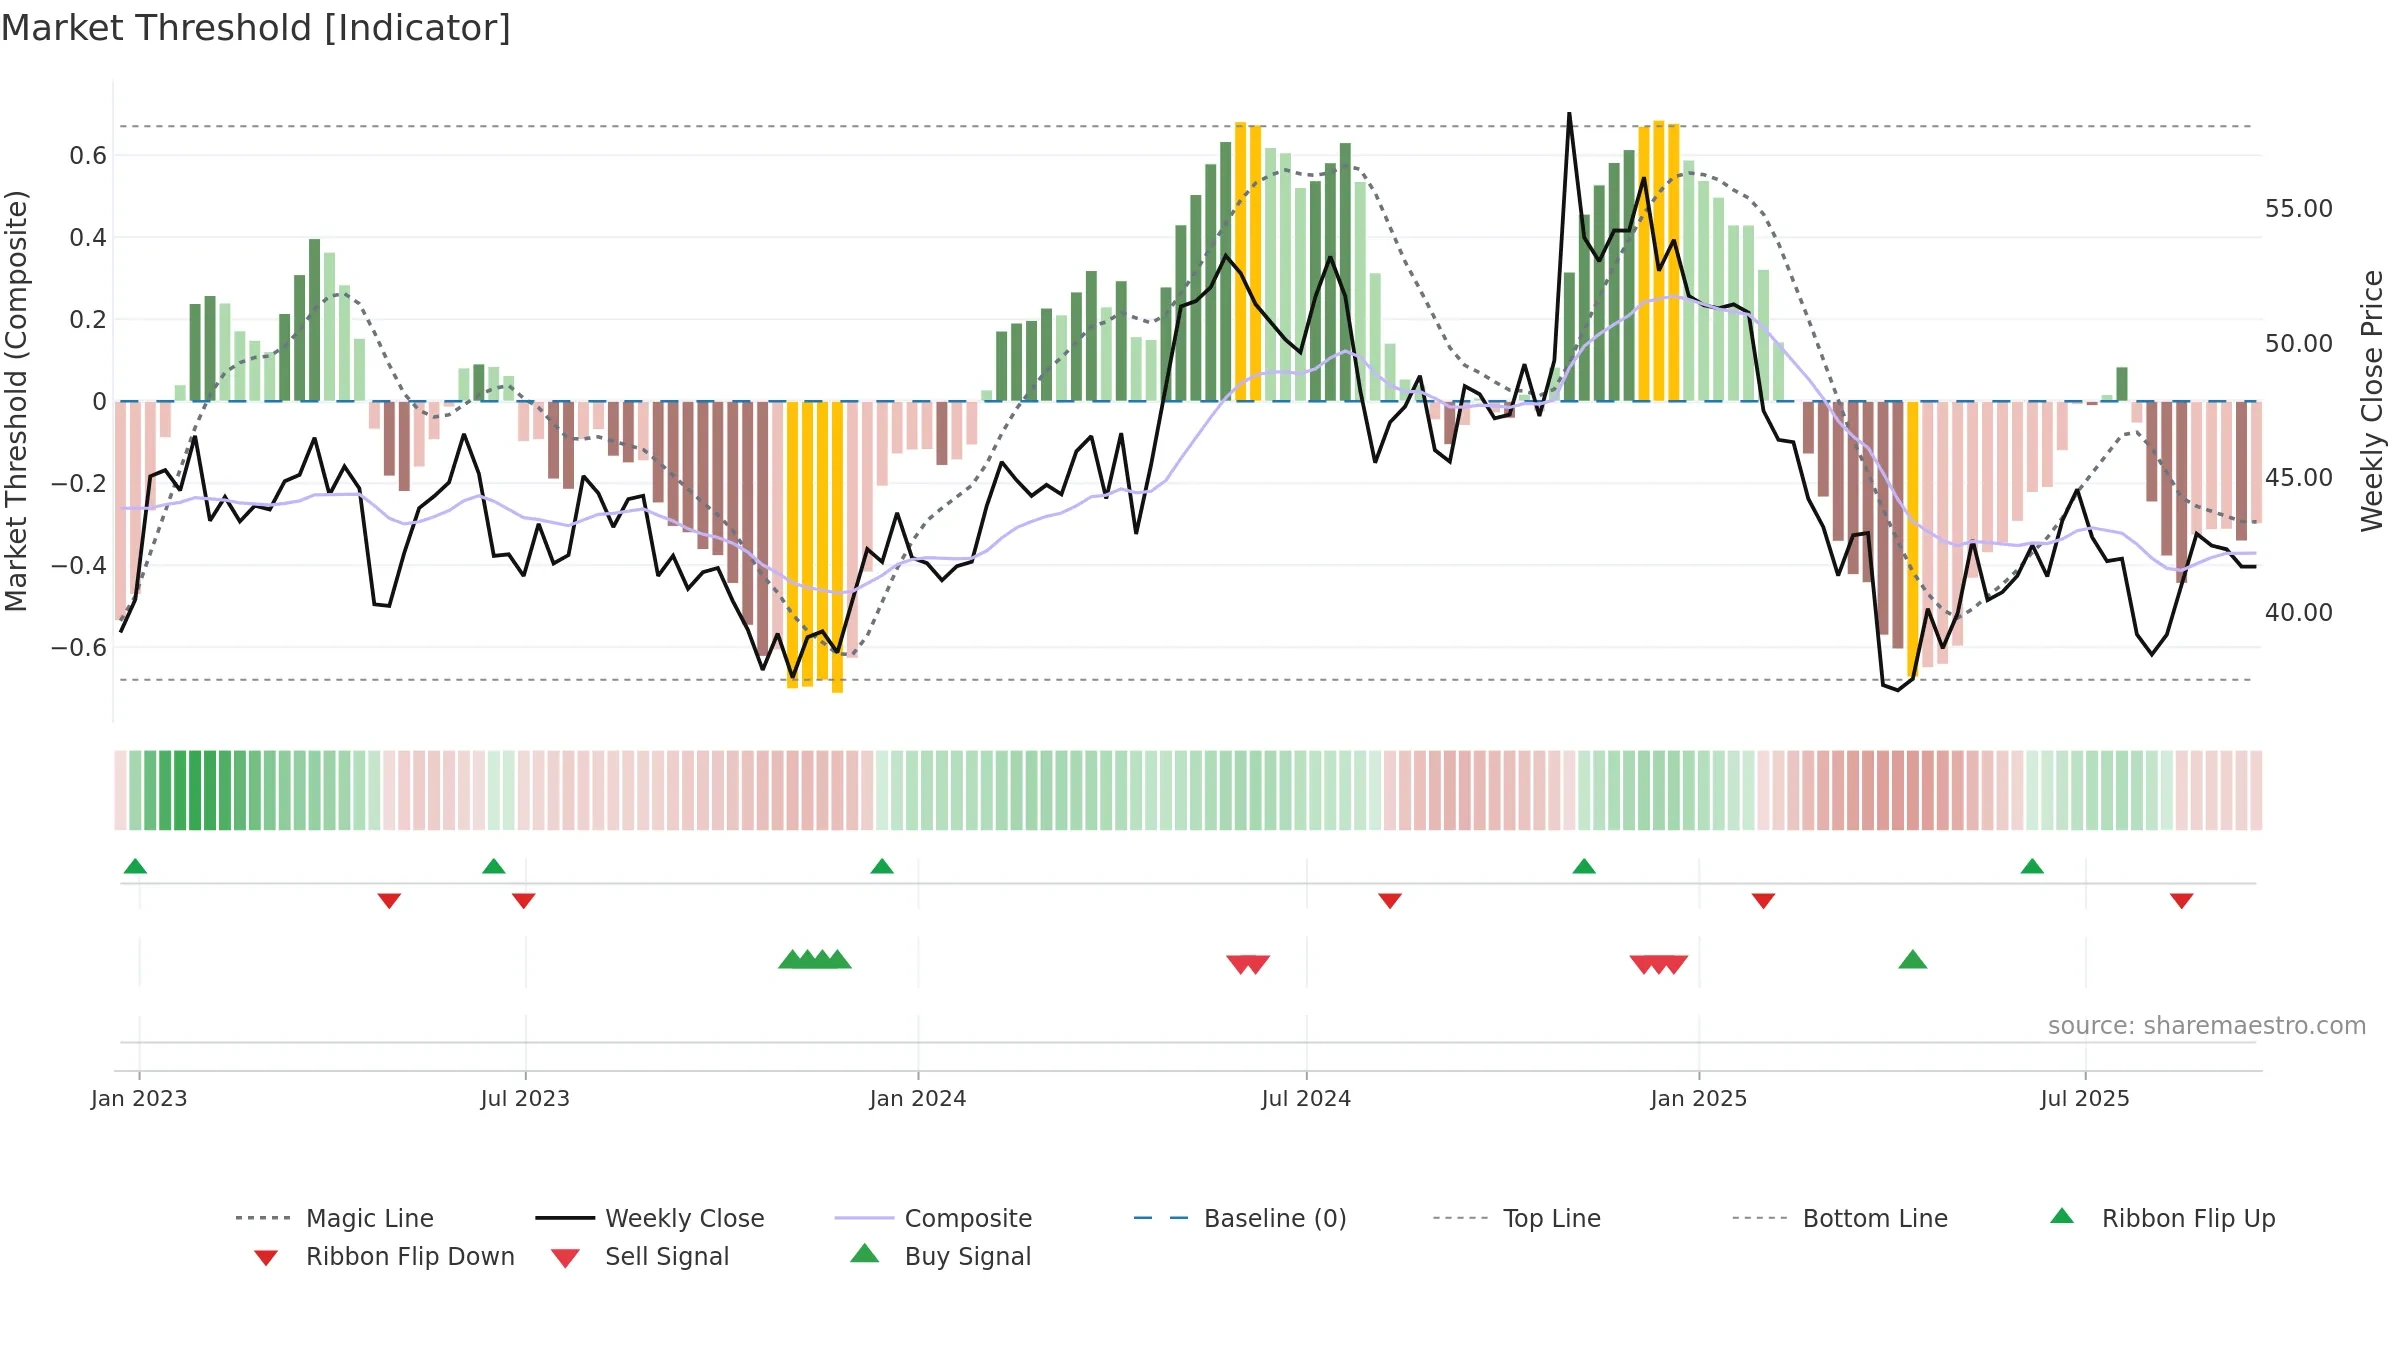
Positive setup. ★★★★★ confidence. Price window: 8. Trend: Bottoming Attempt; gauge 38. In combination, liquidity confirms the move.
- Early improvement from bearish zone (bottoming attempt)
- Price holds above 8w & 26w averages
- Liquidity confirms the price trend
- Low return volatility supports durability
Why: Price window 8.51% over 8w. Close is -2.84% below the prior-window high. Return volatility 1.62%. Volume trend rising. Liquidity convergence with price. Trend state bottoming attempt. Low-regime (≤0.25) upticks 2/3 (67.0%) • Accumulating. Momentum neutral and rising. Valuation supportive skew.
Tip: Most metrics include a hover tooltip where they appear in the report.