Avery Dennison Corporation
AVY NYSE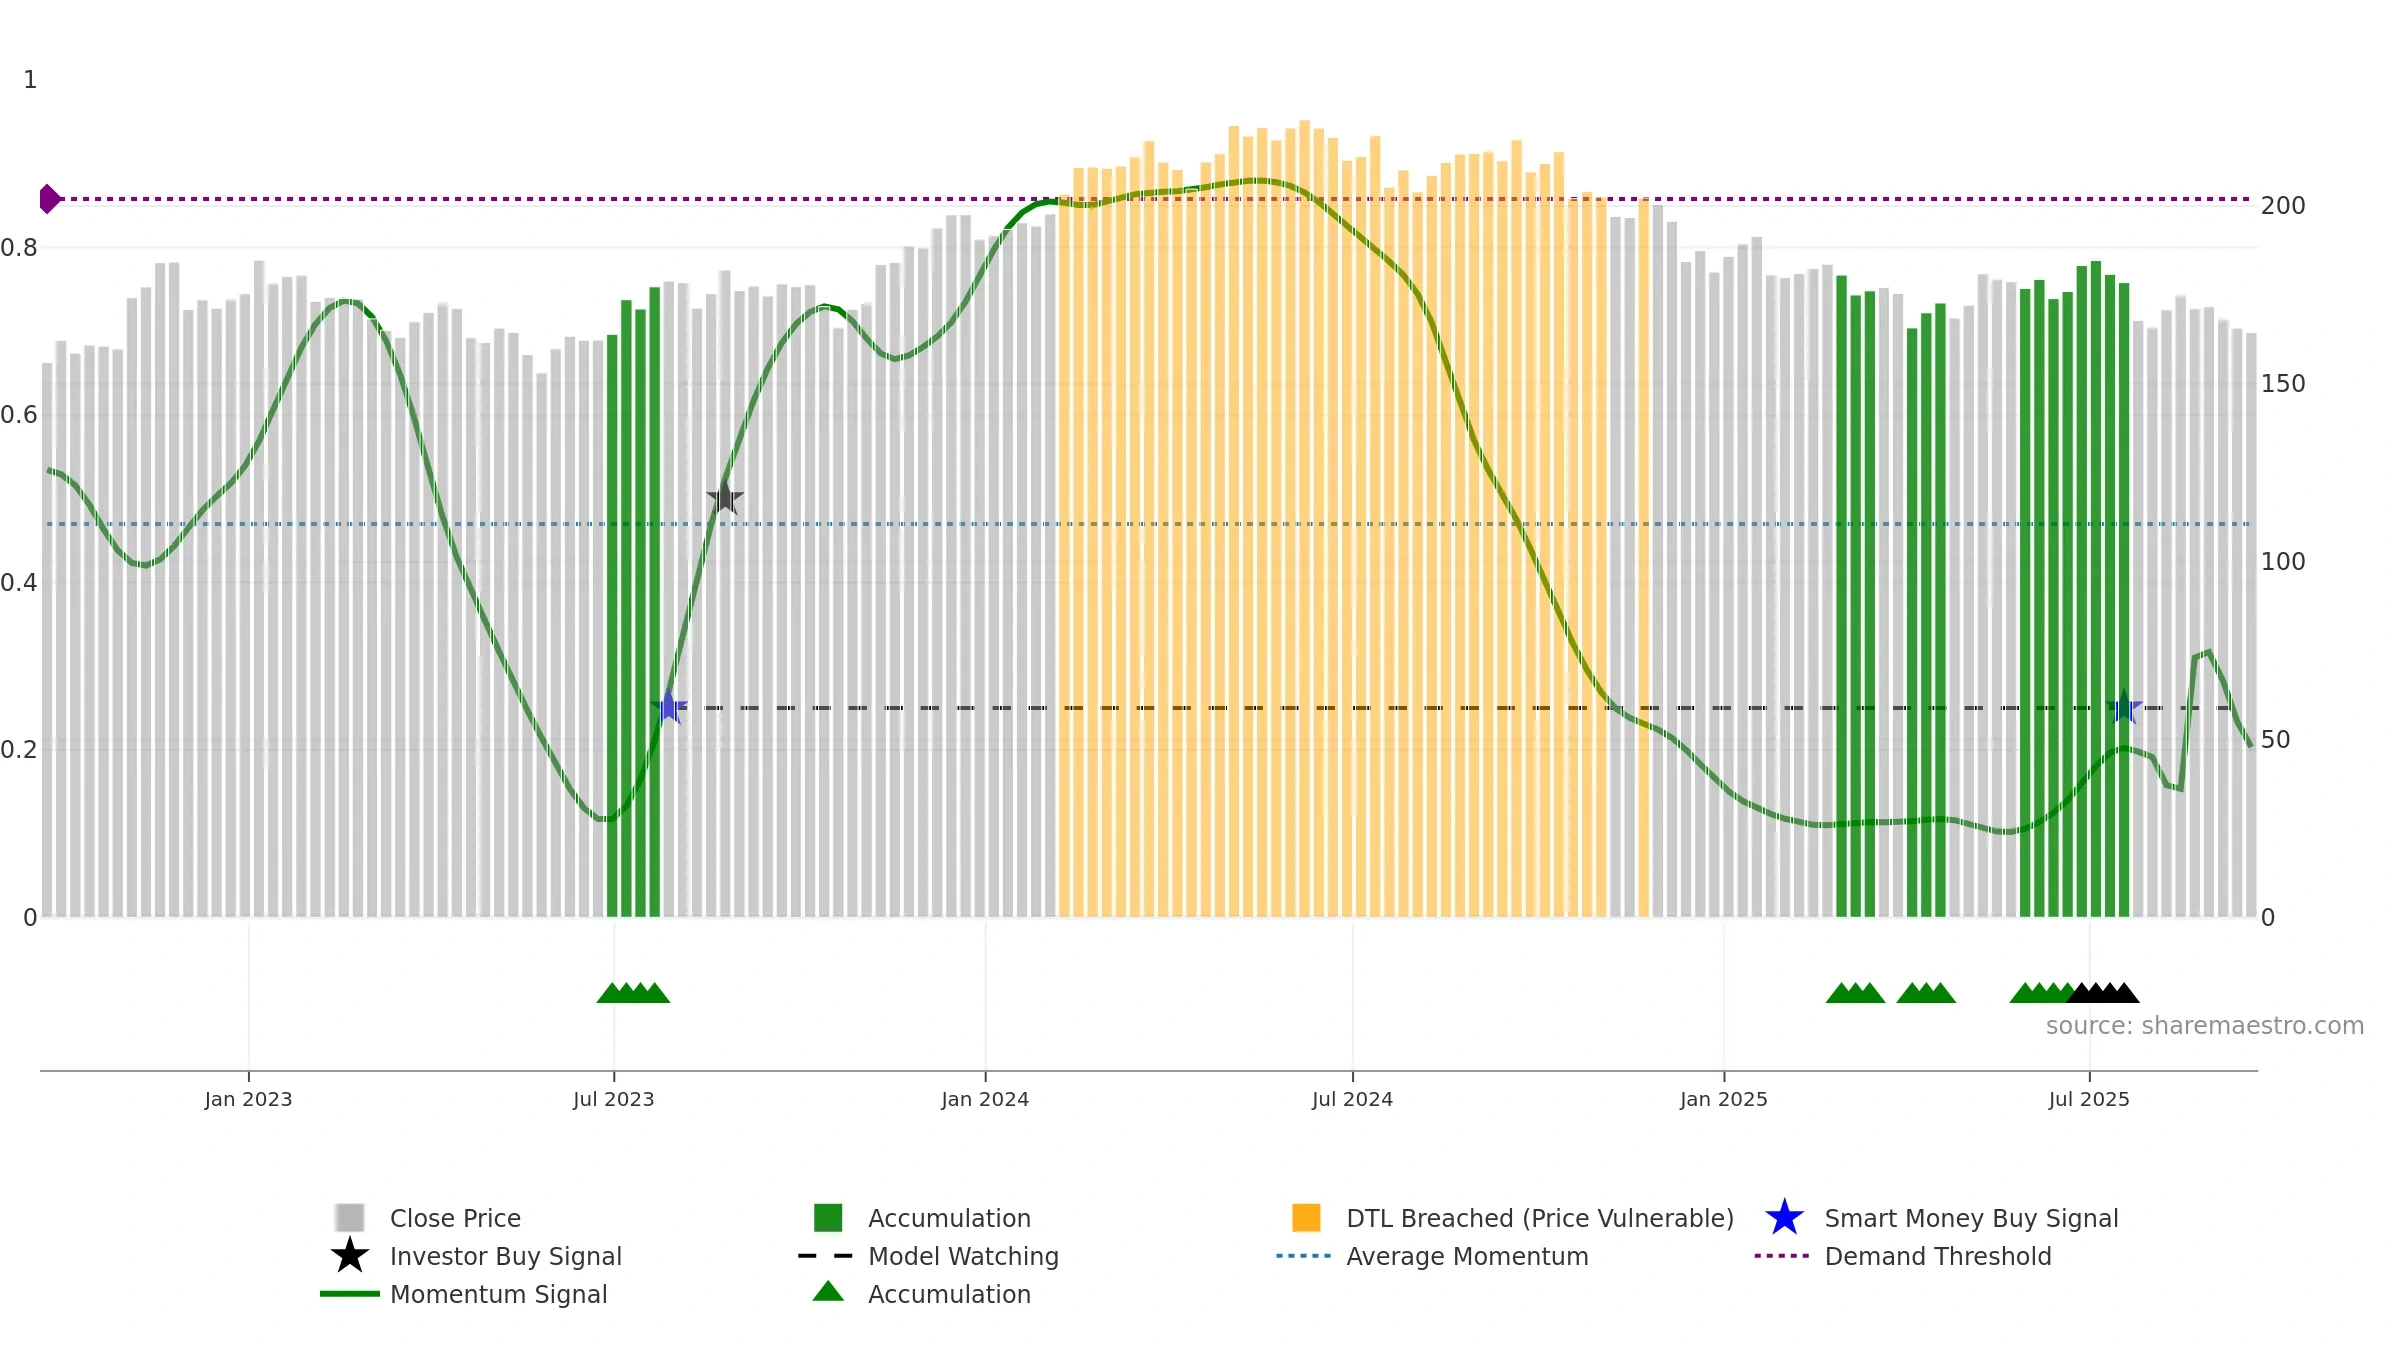
Weekly Summary
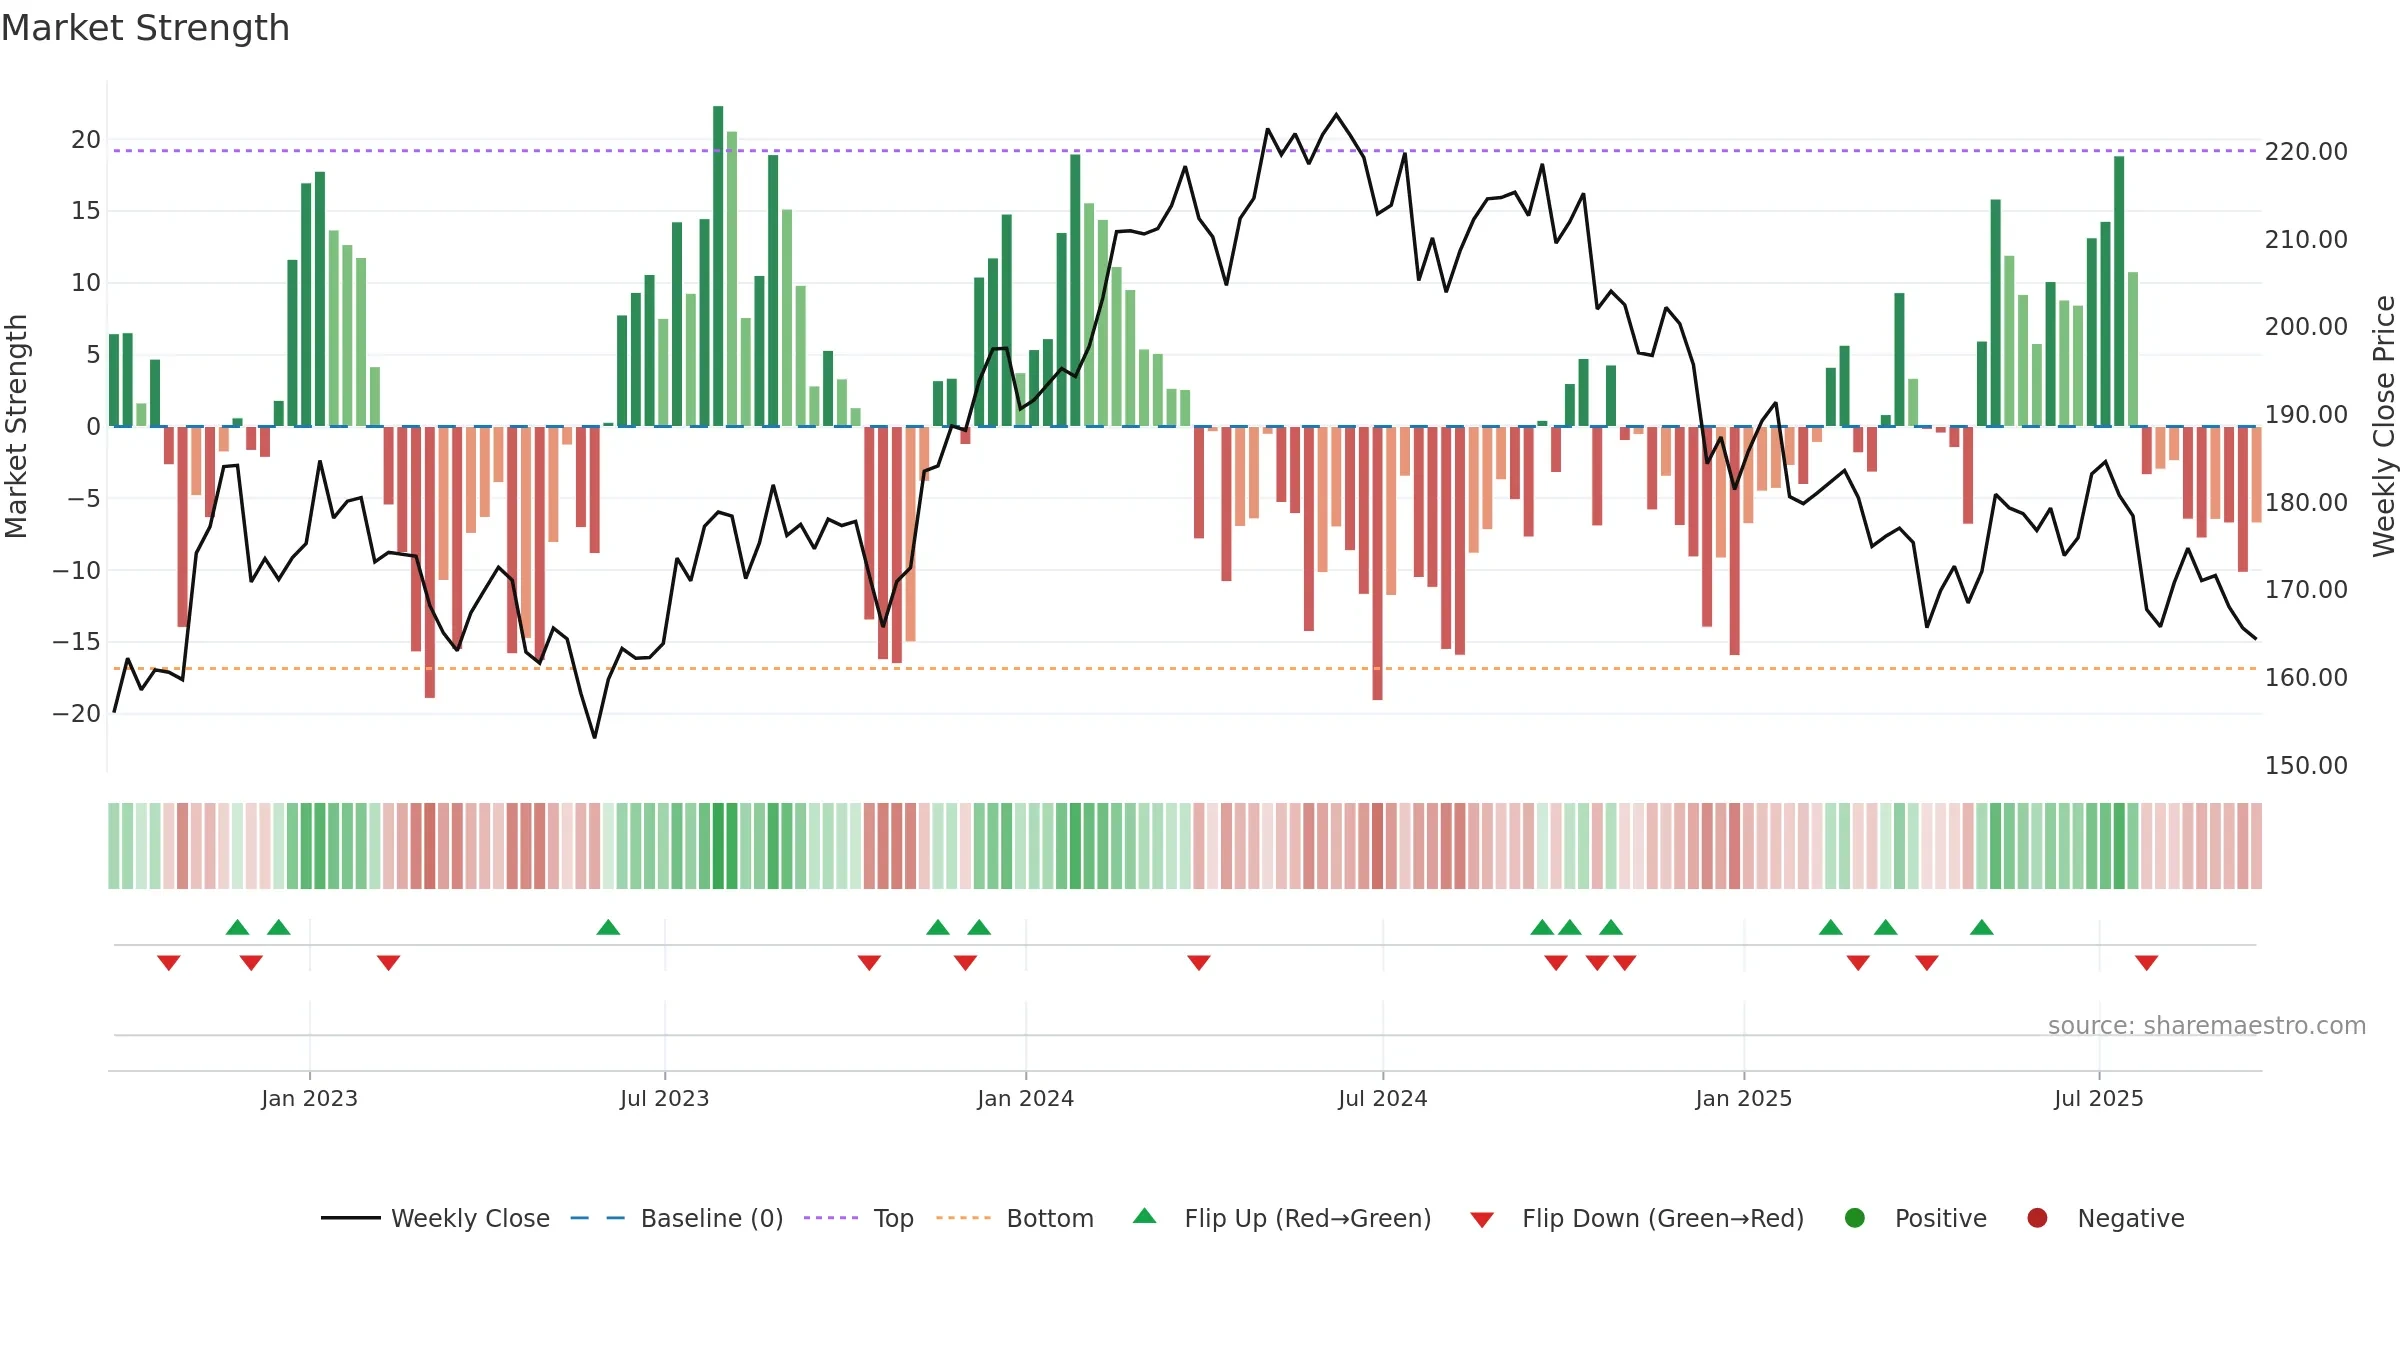
Avery Dennison Corporation closed at 164.3800 (-0.85% WoW) . Data window ends Fri, 19 Sep 2025.
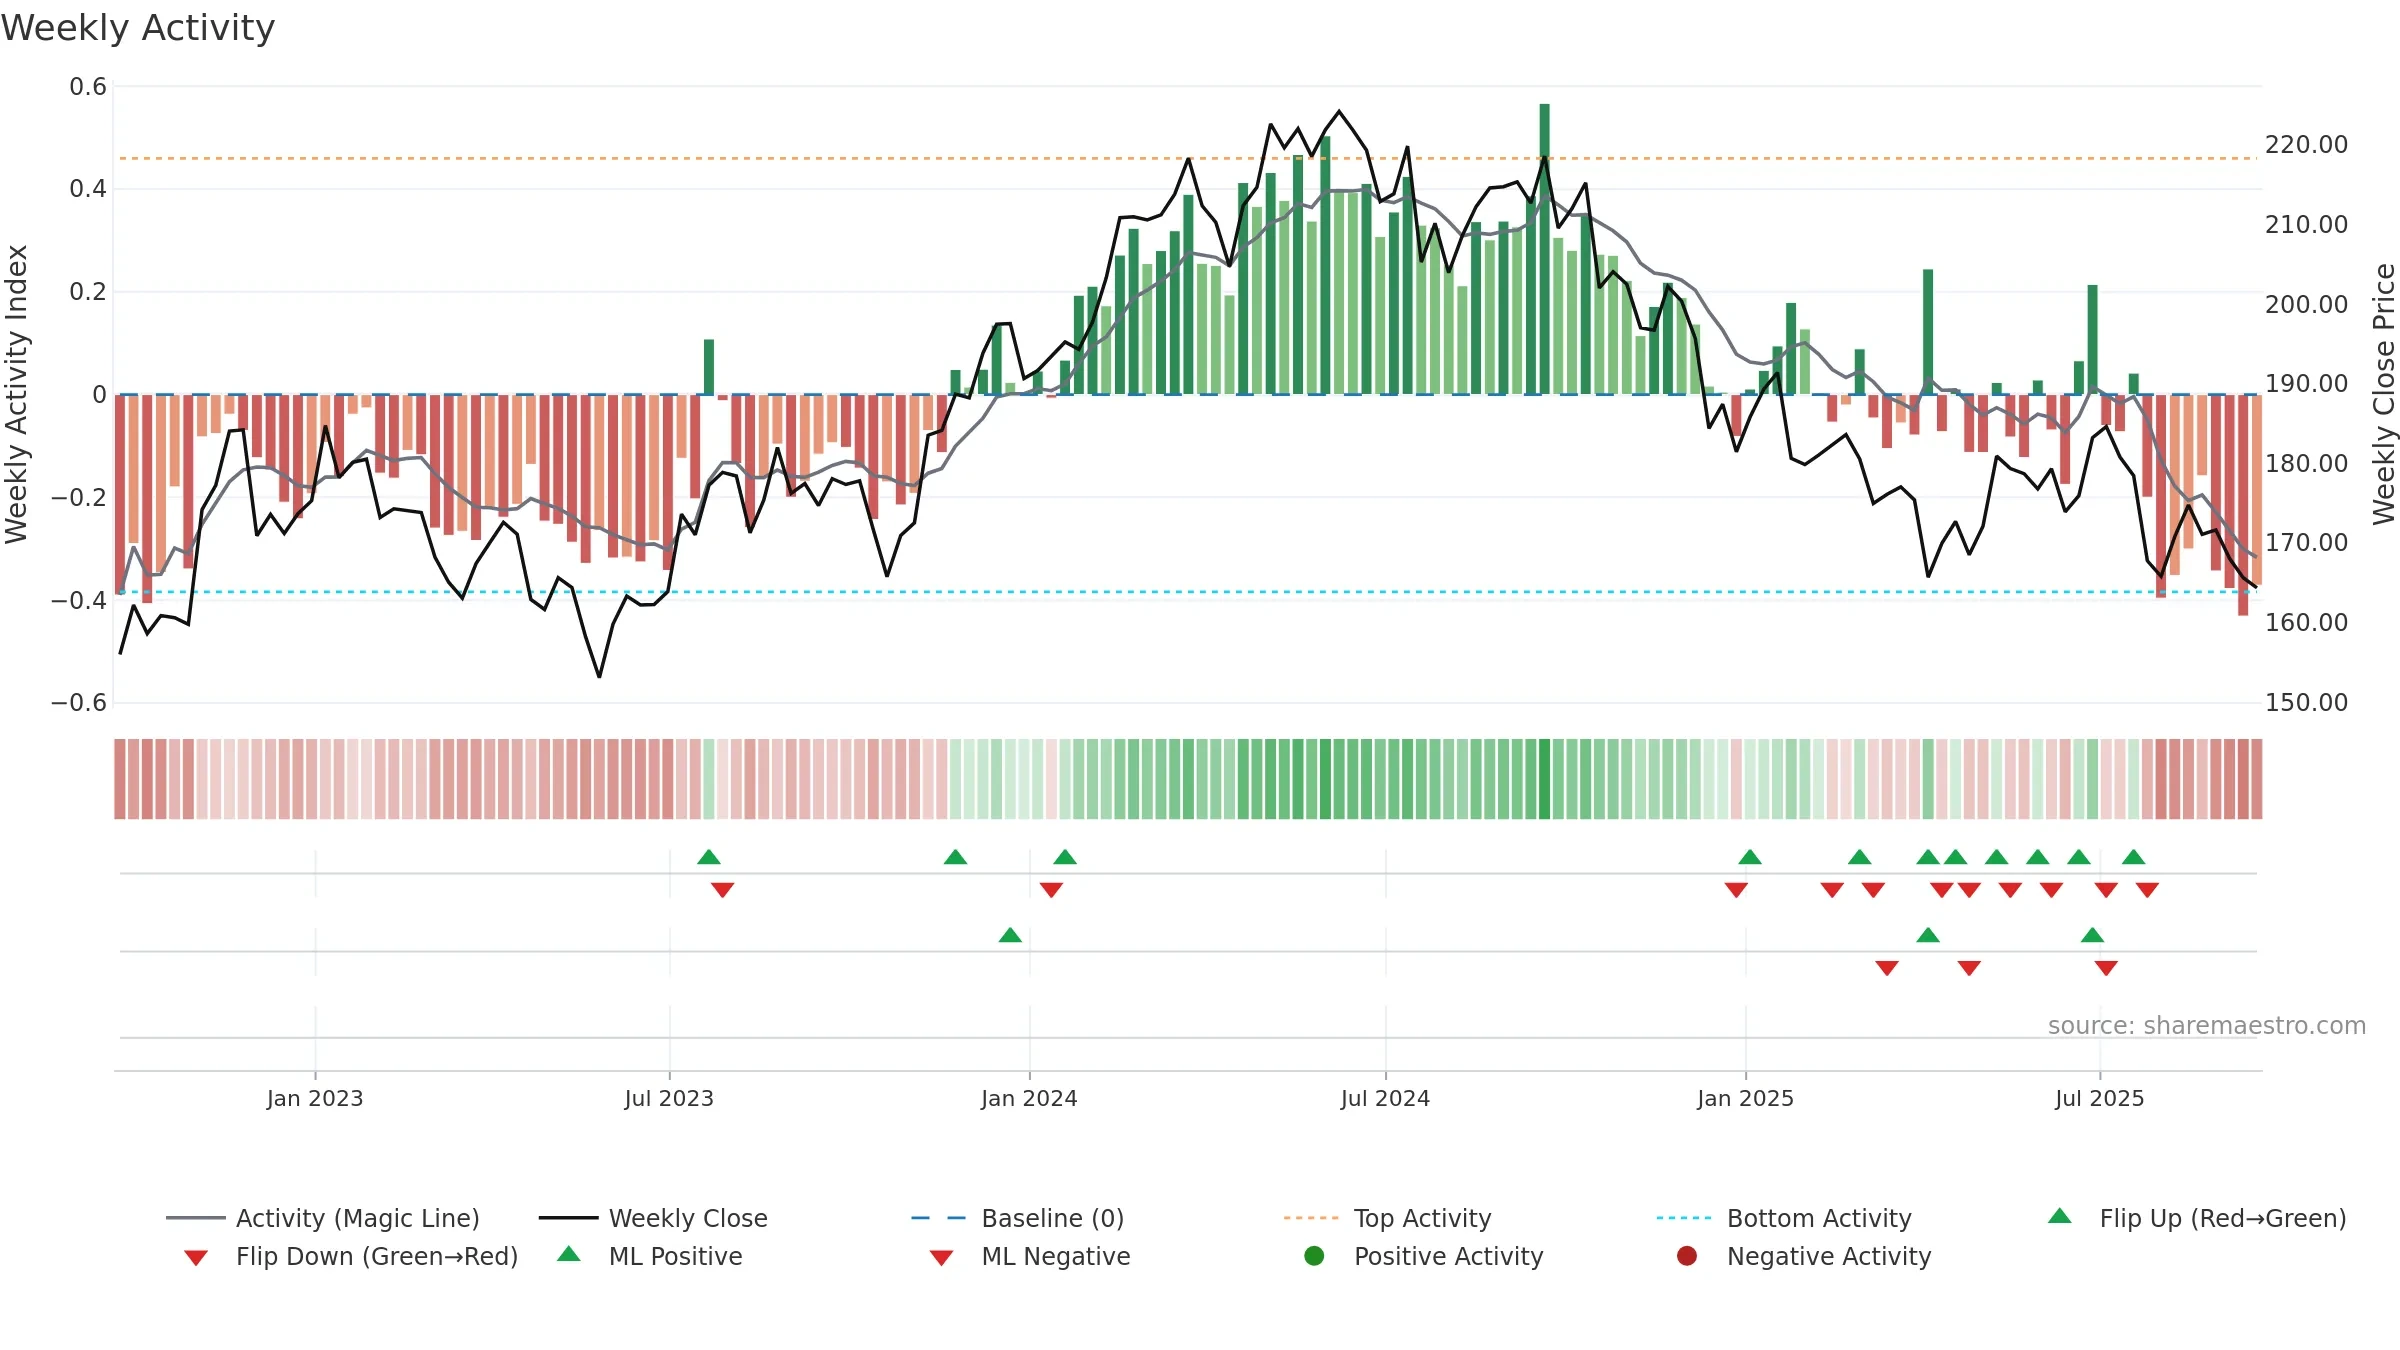
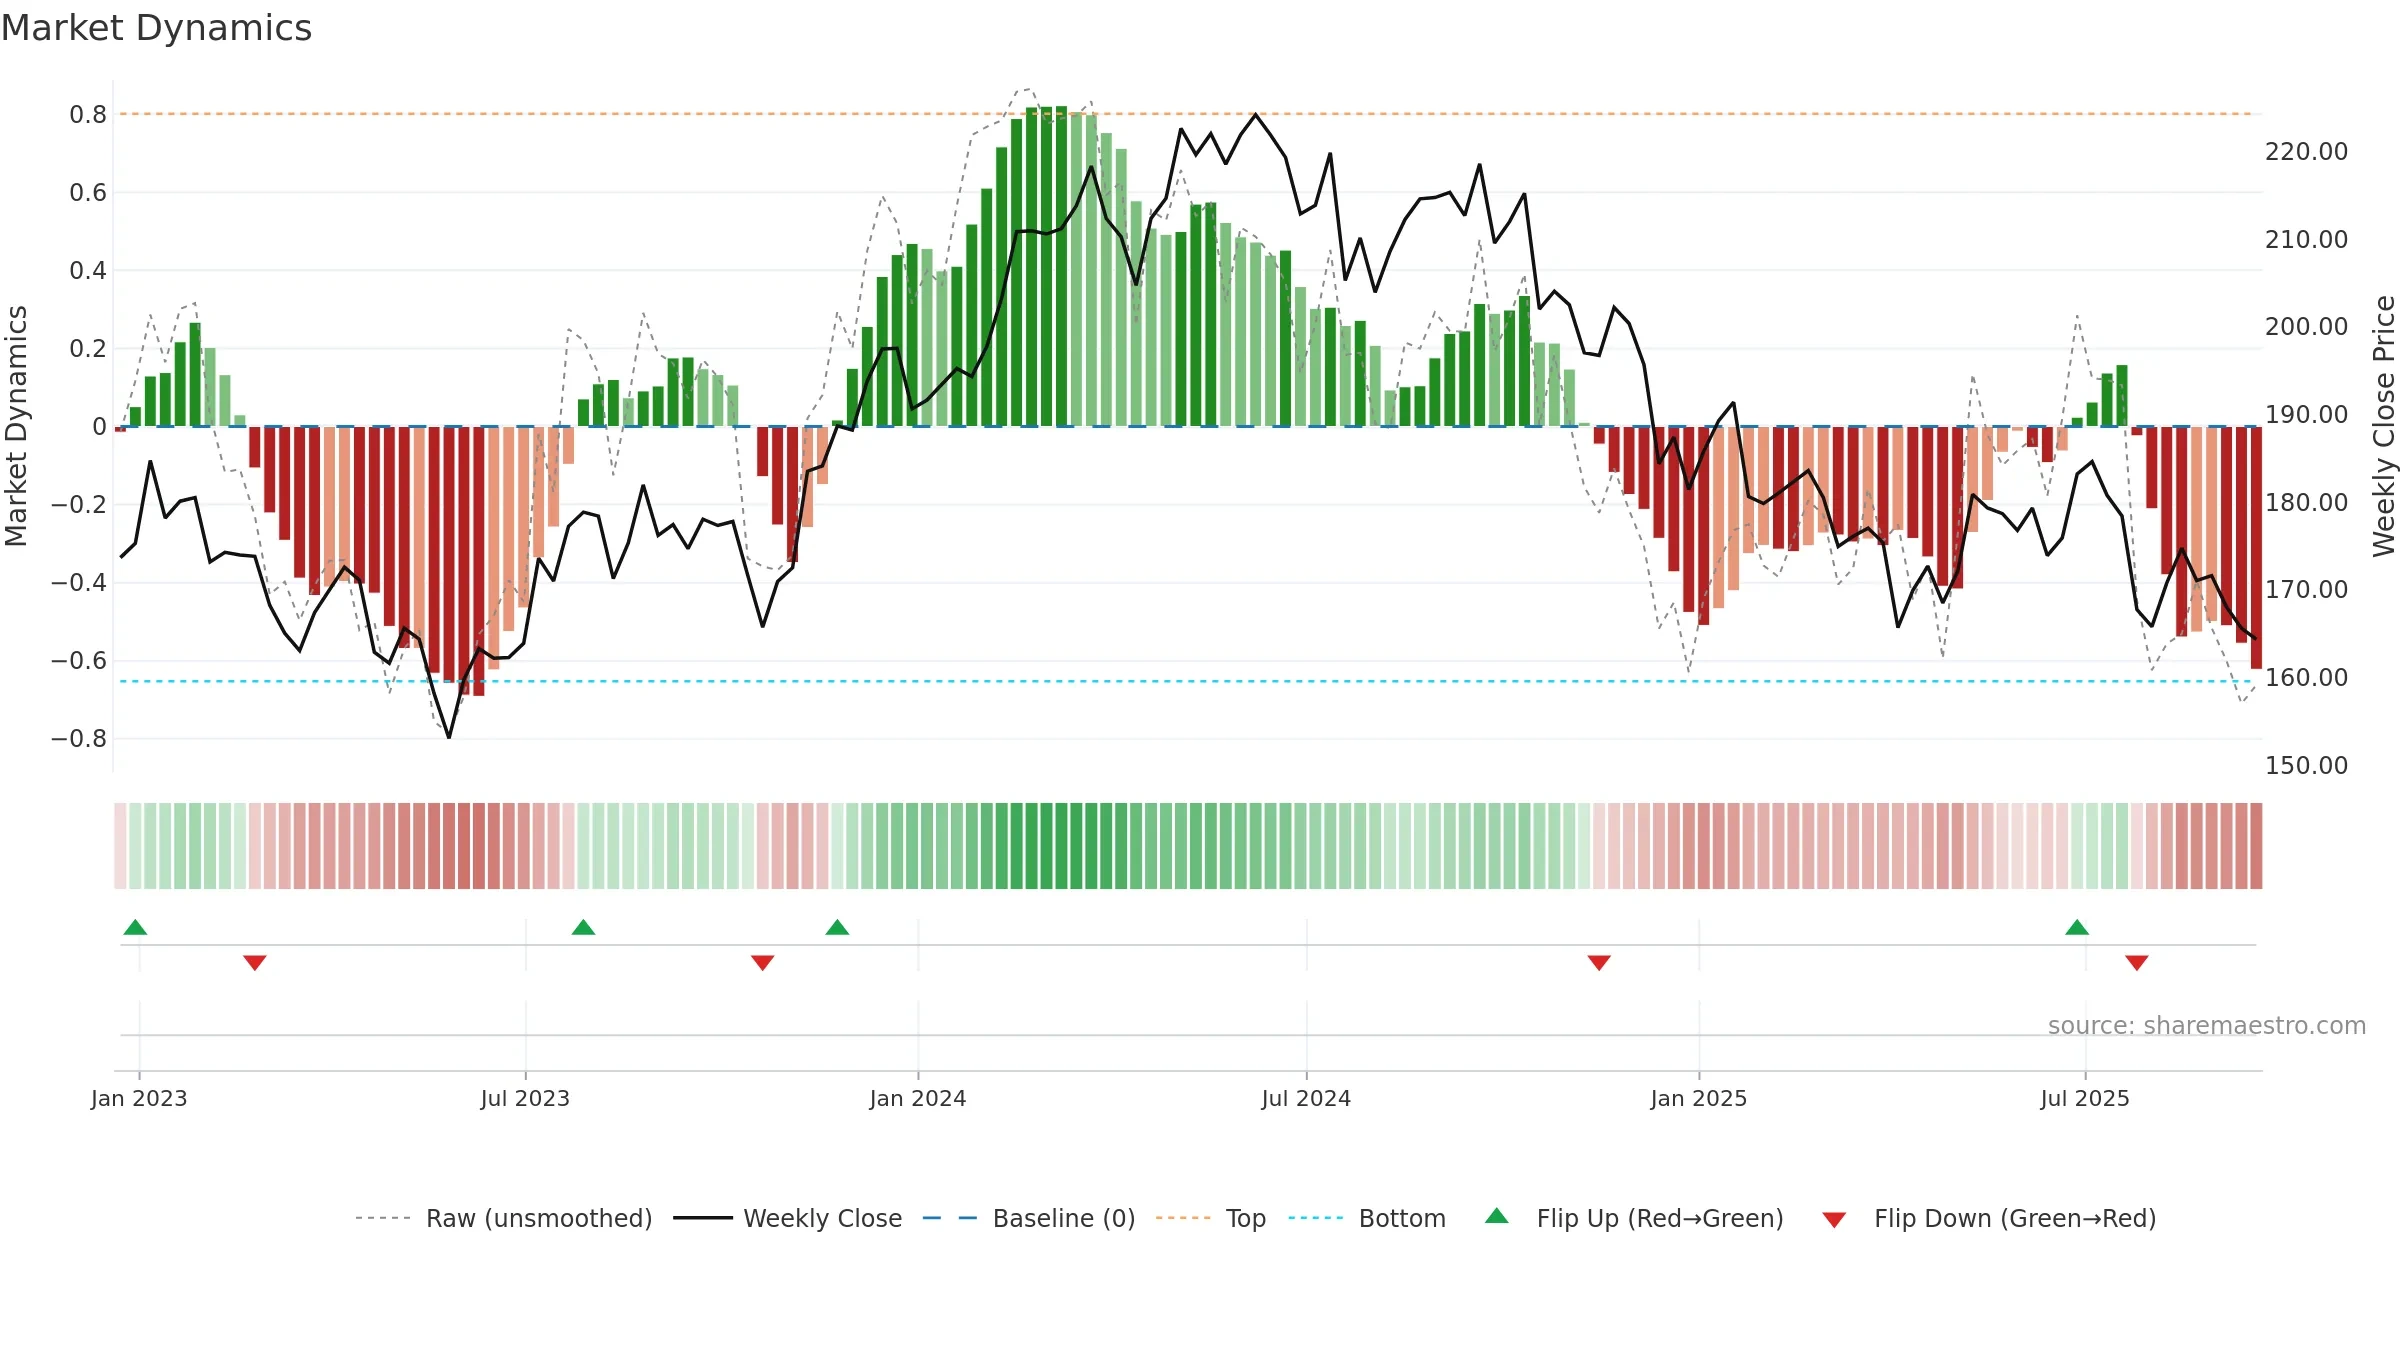
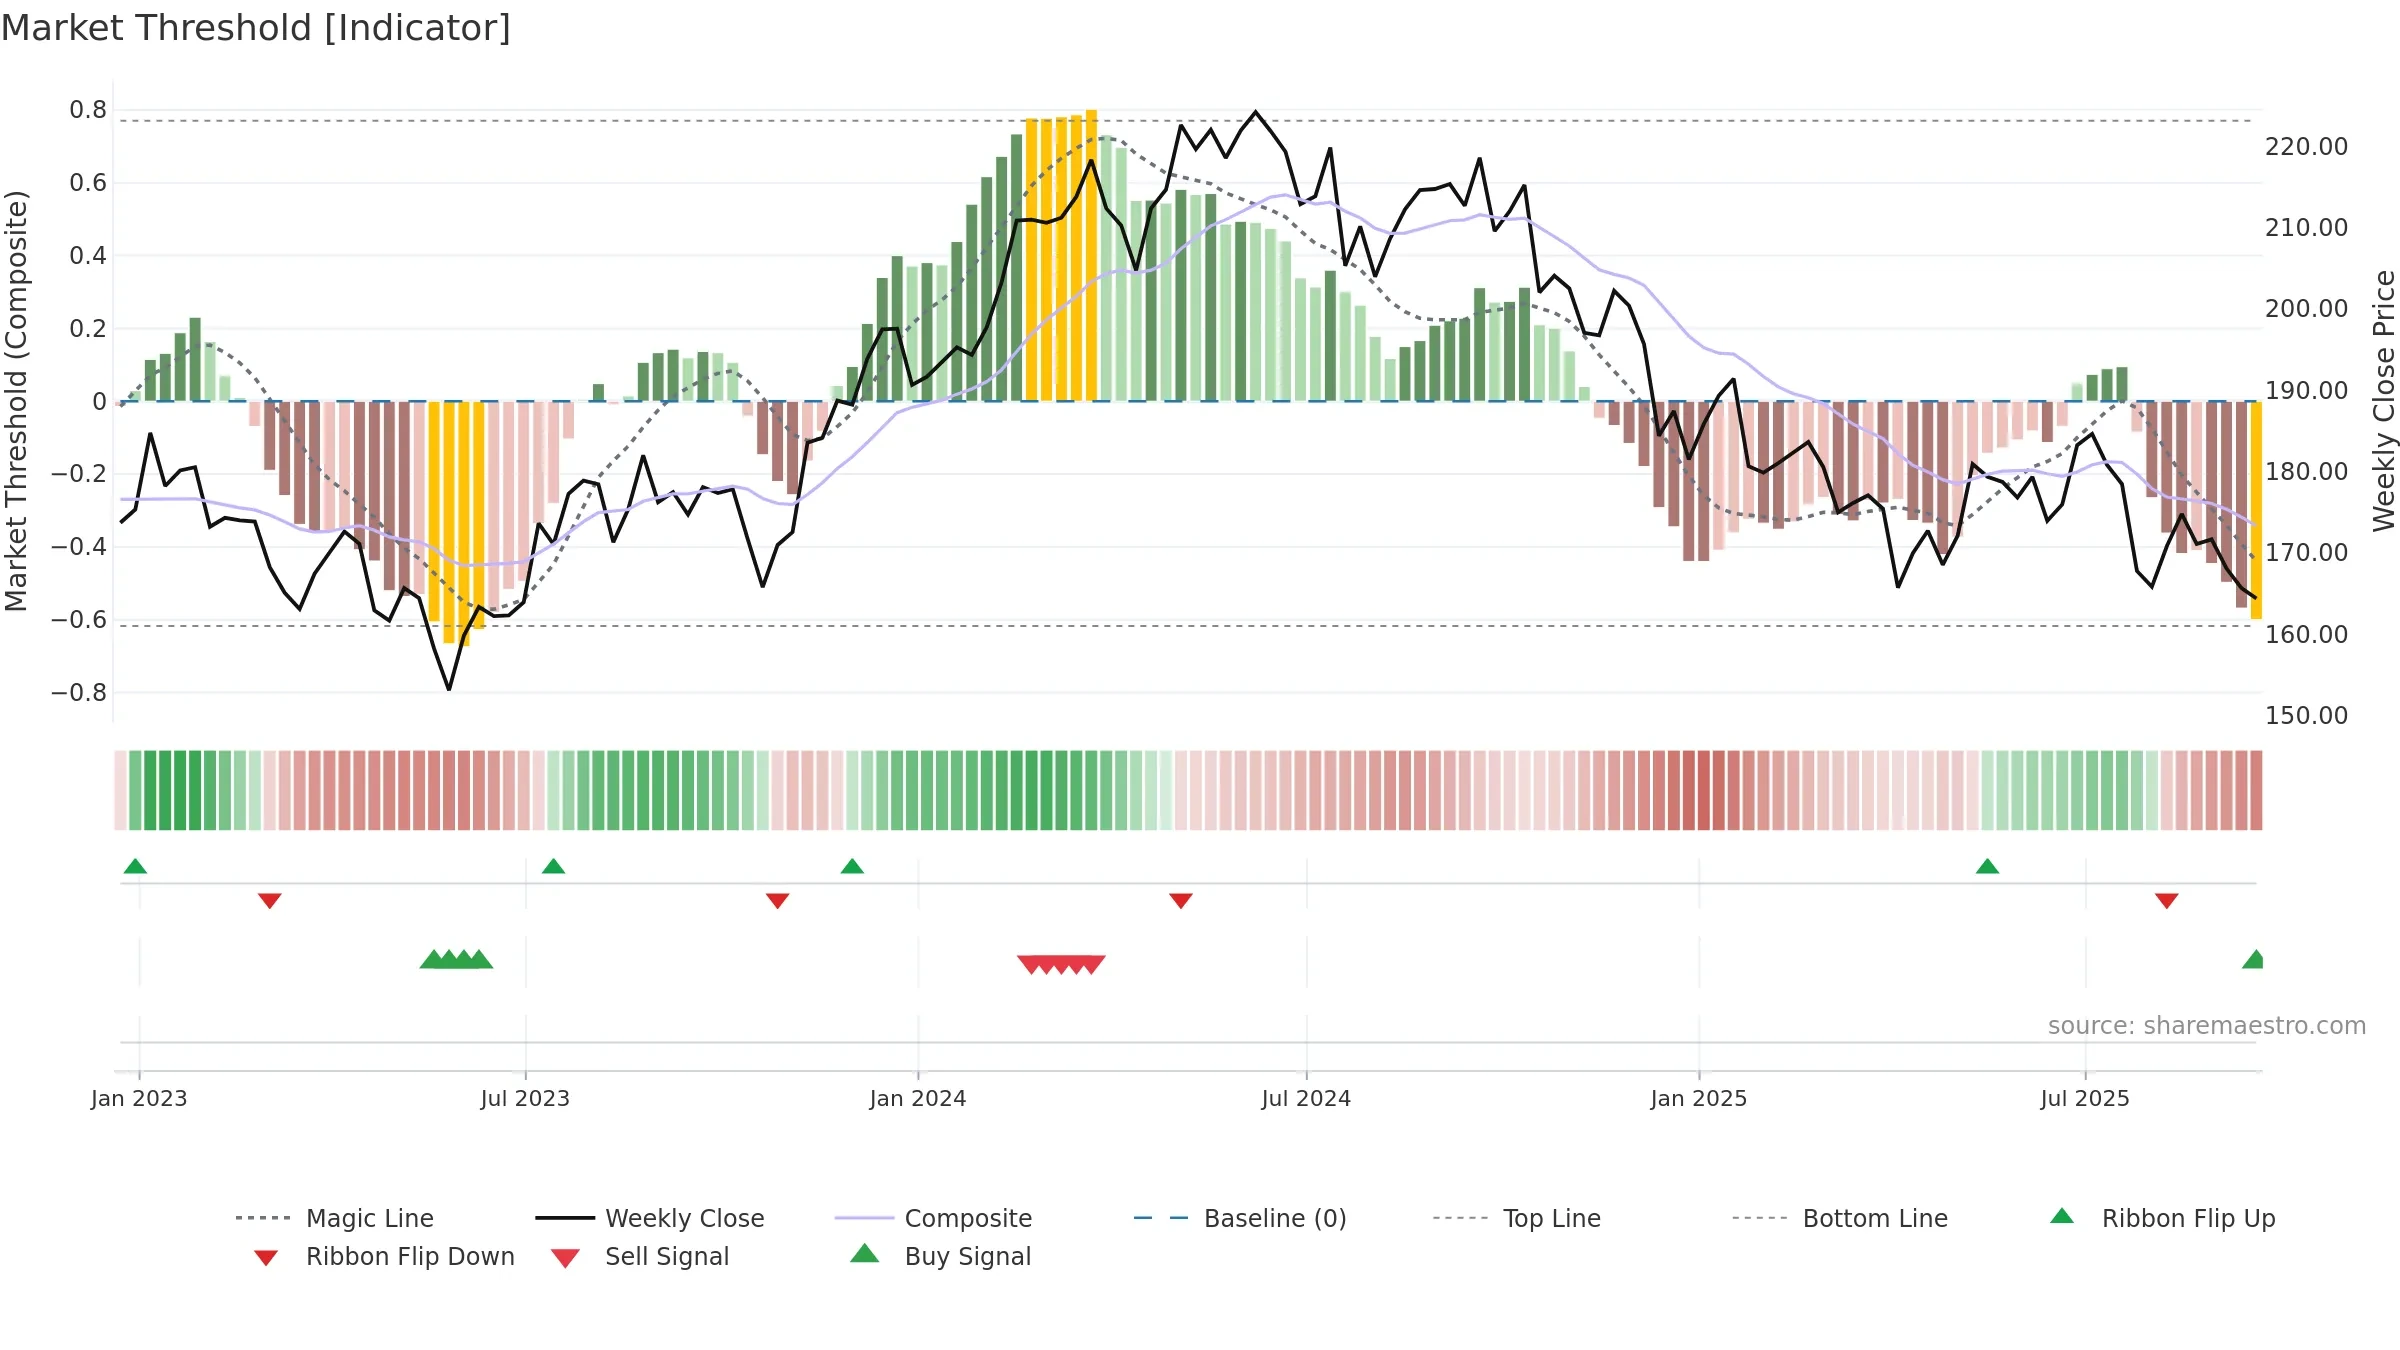
How to read this — Price slope is downward, indicating persistent supply pressure. Low weekly volatility favours steadier follow-through. Volume trend diverges from price — watch for fatigue or rotation. Returns are negatively correlated with volume — strength may come on lighter activity. Distance to baseline is narrowing — reverting closer to its fair-value track. Weak MA stack argues for caution; rallies can fail near the 8–13 week region. Price sits below key averages, keeping pressure on the tape.
Down-slope argues for patience; rallies can fade sooner unless participation improves. Because liquidity isn’t confirming, prefer evidence of fresh demand before chasing moves.
Gauge maps the trend signal to a 0–100 scale.
How to read this — Range-bound conditions; conviction is limited until a break or acceleration emerges.
Wait for a directional break or improving acceleration.

Relative strength is Negative
(< 0%, underperforming).
Latest MRS: -12.70% (week ending Fri, 19 Sep 2025).
Slope: Falling over 8w.
Notes:
- Below zero line indicates relative weakness vs benchmark.
- MRS slope falling over ~8 weeks.
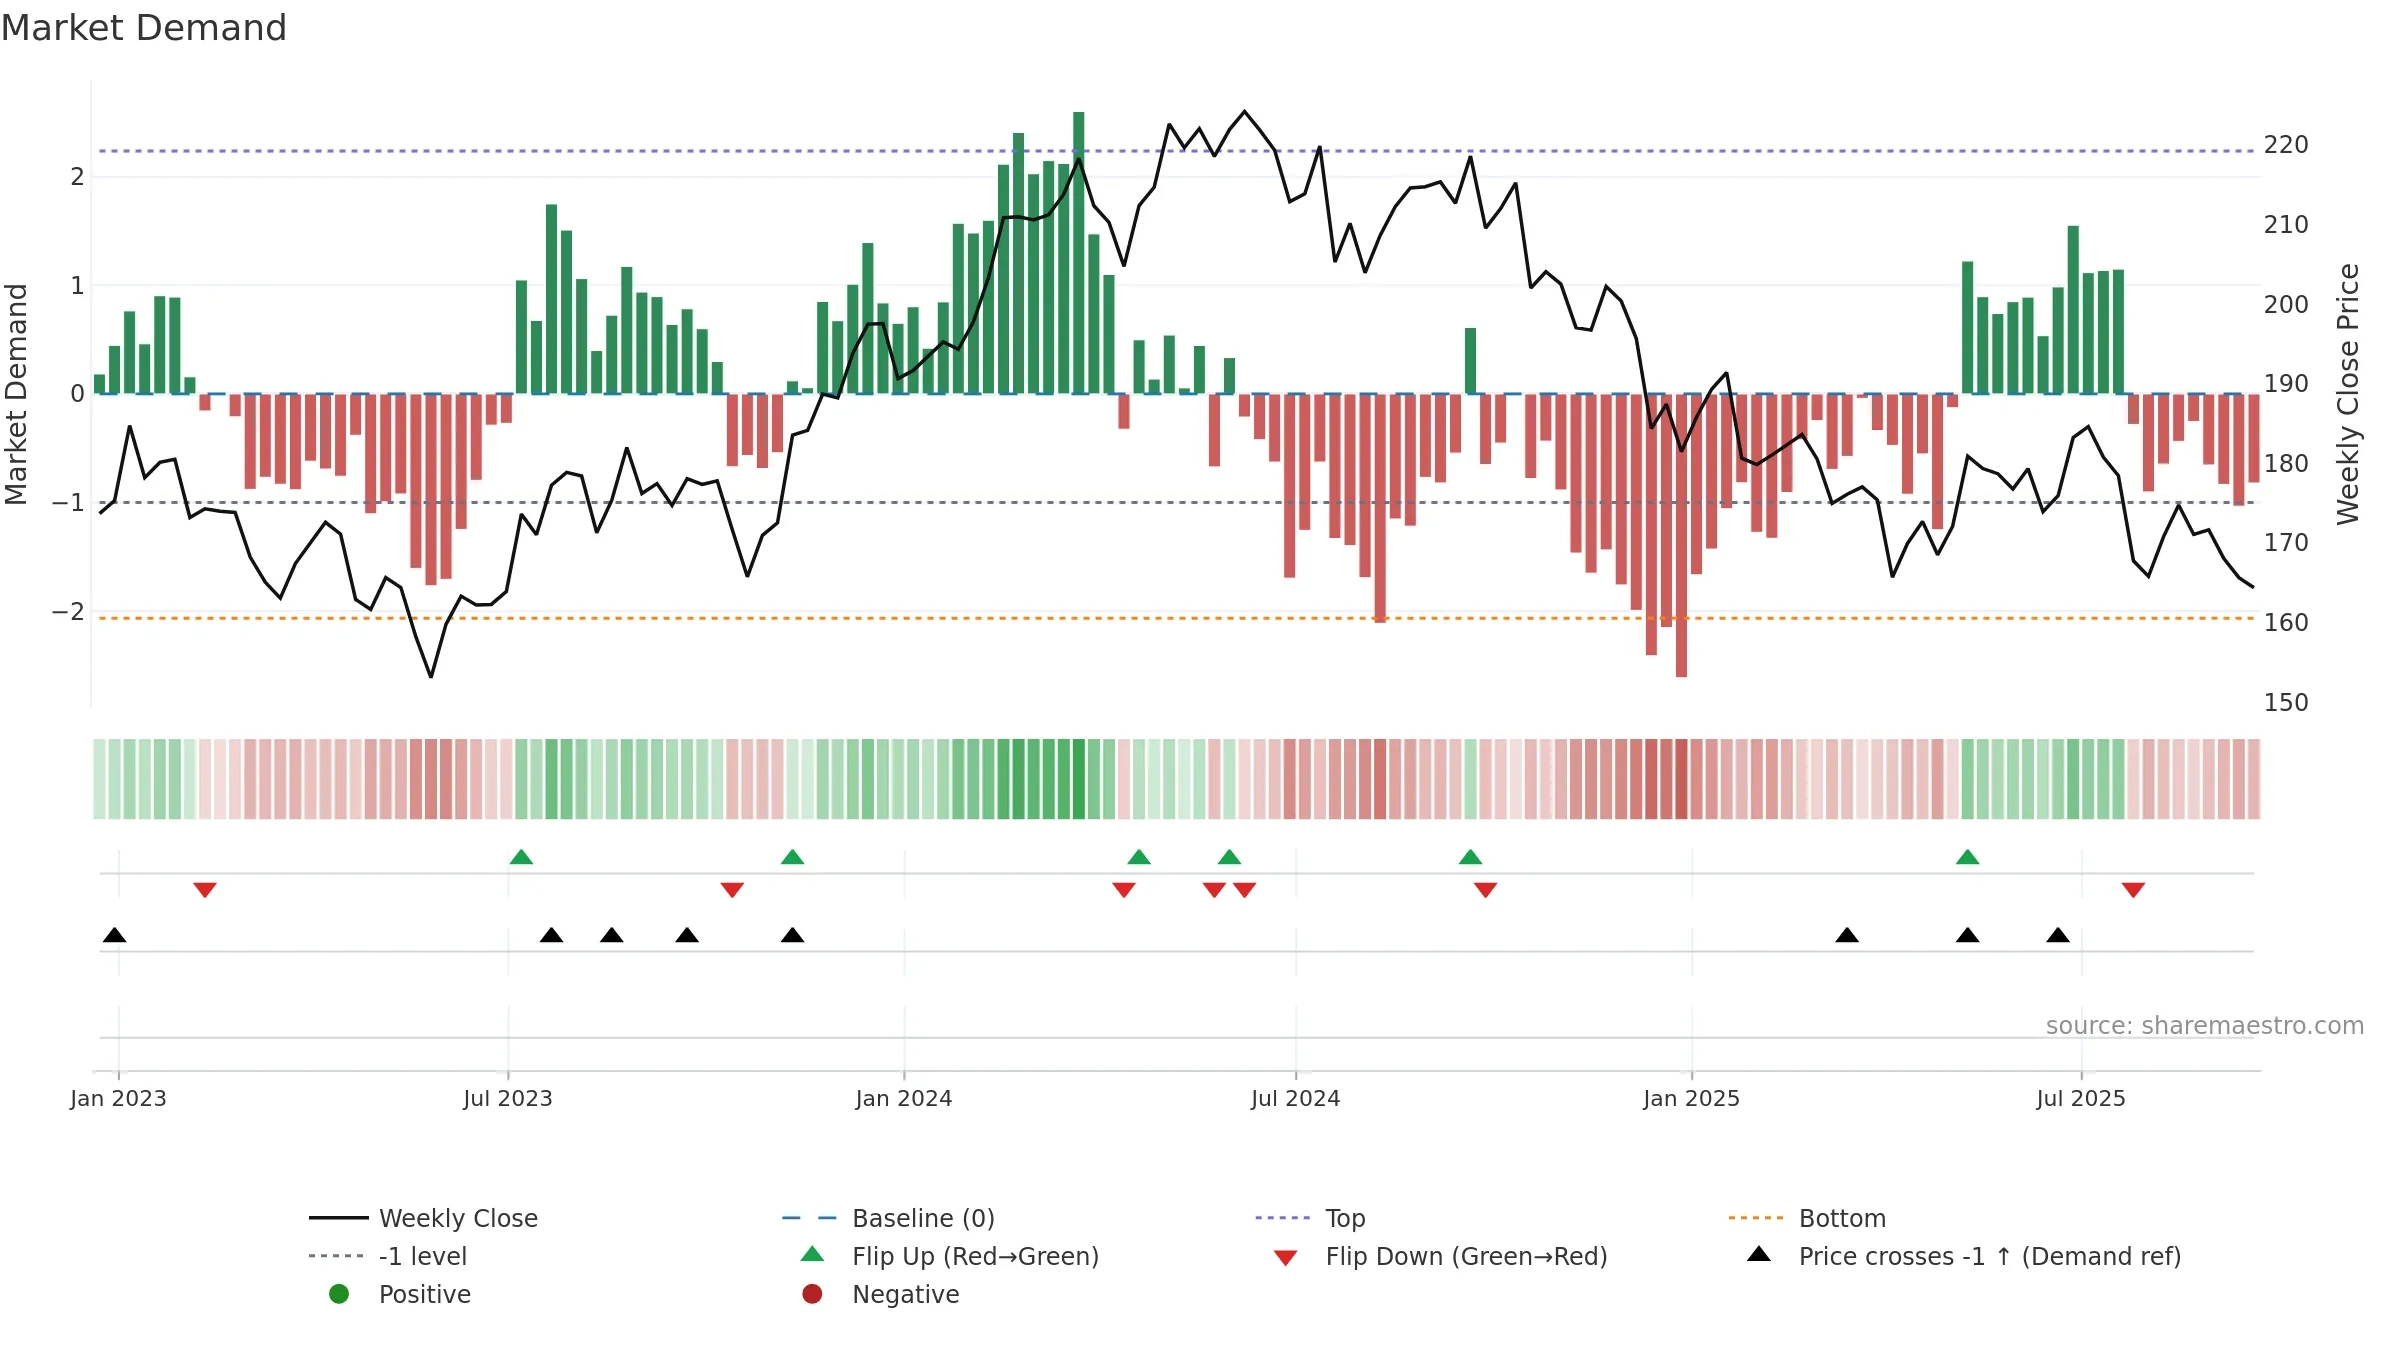
Price is above fair value; upside may be capped without catalysts.
Conclusion
Negative setup. ★⯪☆☆☆ confidence. Trend: Range / Neutral · -0.87% over window · vol 1.20% · liquidity divergence · posture below · RS weak
- Low return volatility supports durability
- Momentum is weak/falling
- Price is not above key averages
- Weak moving-average stack
- Liquidity diverges from price
Why: Price window -0.87% over w. Close is -5.95% below the prior-window high. Return volatility 1.20%. Volume trend rising. Liquidity divergence with price. Trend state range / neutral. MA stack weak. Momentum bearish and rising. Valuation limited upside without catalysts.
Tip: Most metrics include a hover tooltip where they appear in the report.