No results found.

SEI Enhanced US Large Cap Value Factor ETF

SEIV ETF-US
Week Ending
Mon, 15 Sep 2025
Open
39.5300
Close
38.8557
High
41.4600
Low
38.3300
Trend
0.71942
Sharemaestro [Charts]
SEIV weekly Smart Money chart, closing 2025-09-15.
SEIV weekly Market Snapshot chart, closing 2025-09-15.
SEIV weekly Market Cycle chart, closing 2025-09-15.
SEIV weekly Market Demand chart, closing 2025-09-15.
SEIV weekly Market Strength chart, closing 2025-09-15.
SEIV weekly Market Dynamics chart, closing 2025-09-15.
SEIV weekly Market Threshold chart, closing 2025-09-15.

Weekly Report

SEI Enhanced US Large Cap Value Factor ETF (SEIV) Week Ending: Mon, 15 Sep 2025 ★★★★★
Price
Weekly Close

SEI Enhanced US Large Cap Value Factor ETF closed at 38.8557 (-1.71% WoW) . Data window ends Mon, 15 Sep 2025.

Price Window9.73% over 8w
Return Volatility1.84%
Volume TrendRising
Vs 8w High0.58%
MA StackConstructive
Price vs MAsAbove
What stands out

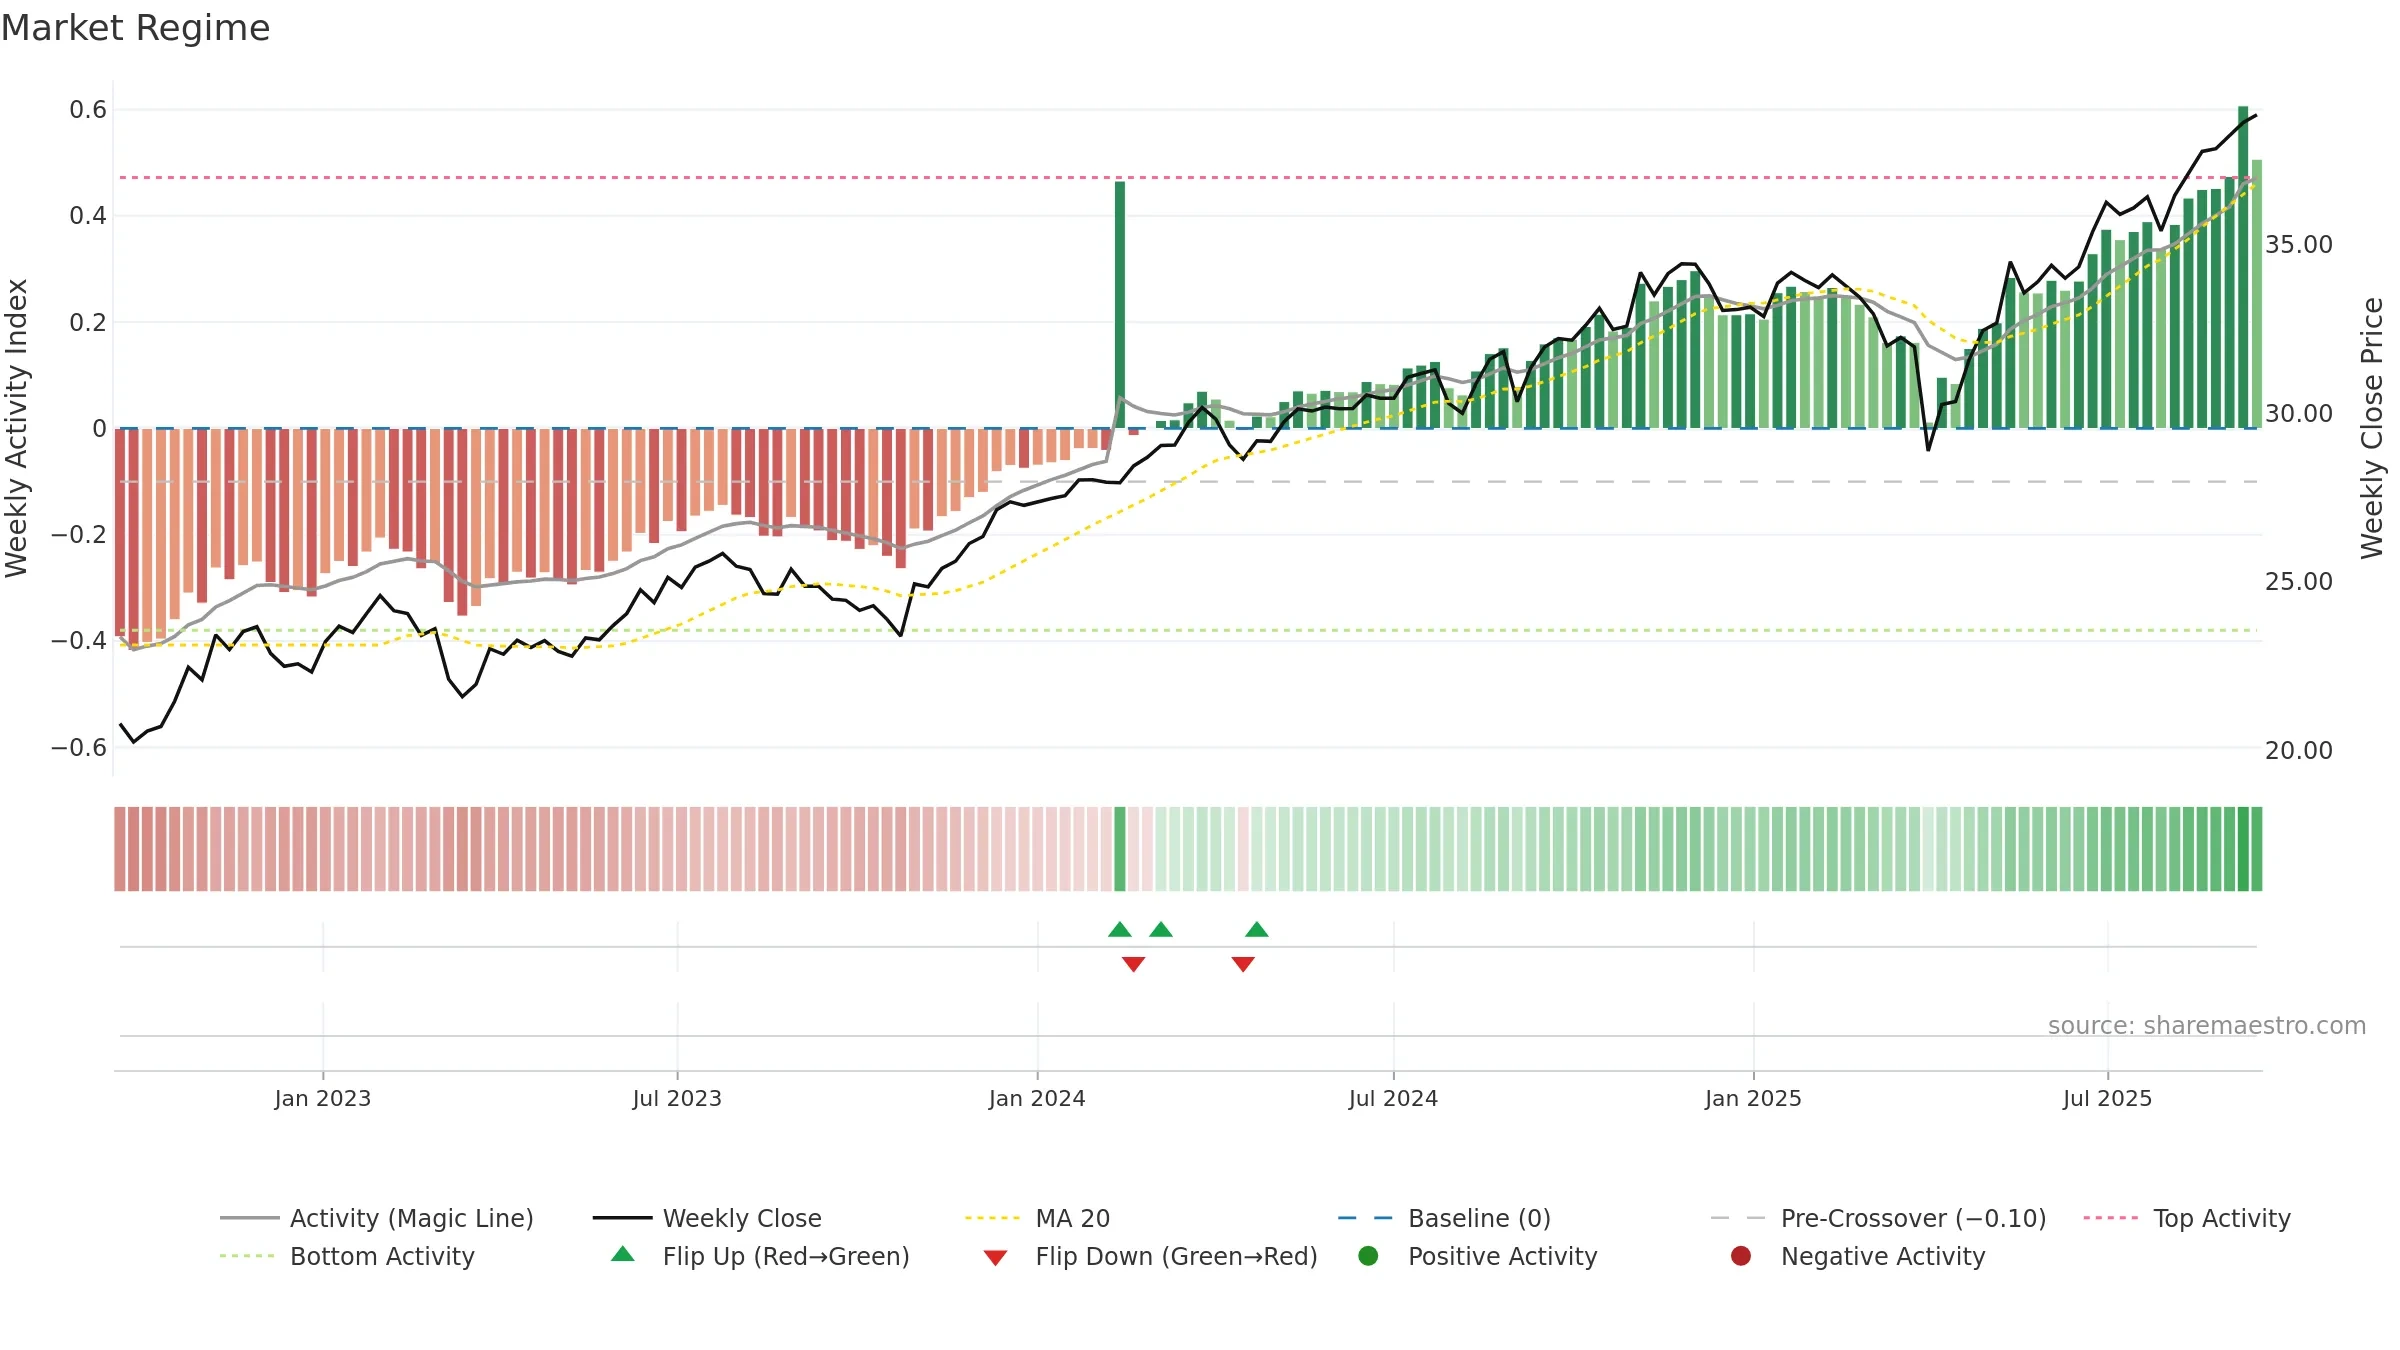
How to read this — Price slope is upward, indicating persistent buying over the window. Low weekly volatility favours steadier follow-through. Volume and price are moving in the same direction — a constructive confirmation. Constructive MA stack supports the up-drift; pullbacks may find support at the 8–13 week region. Price holds above key averages, indicating constructive participation.

What to watch

Up-slope supports buying interest; pullbacks may be contained if activity stays firm.

Trend
Sharemaestro Trend Line

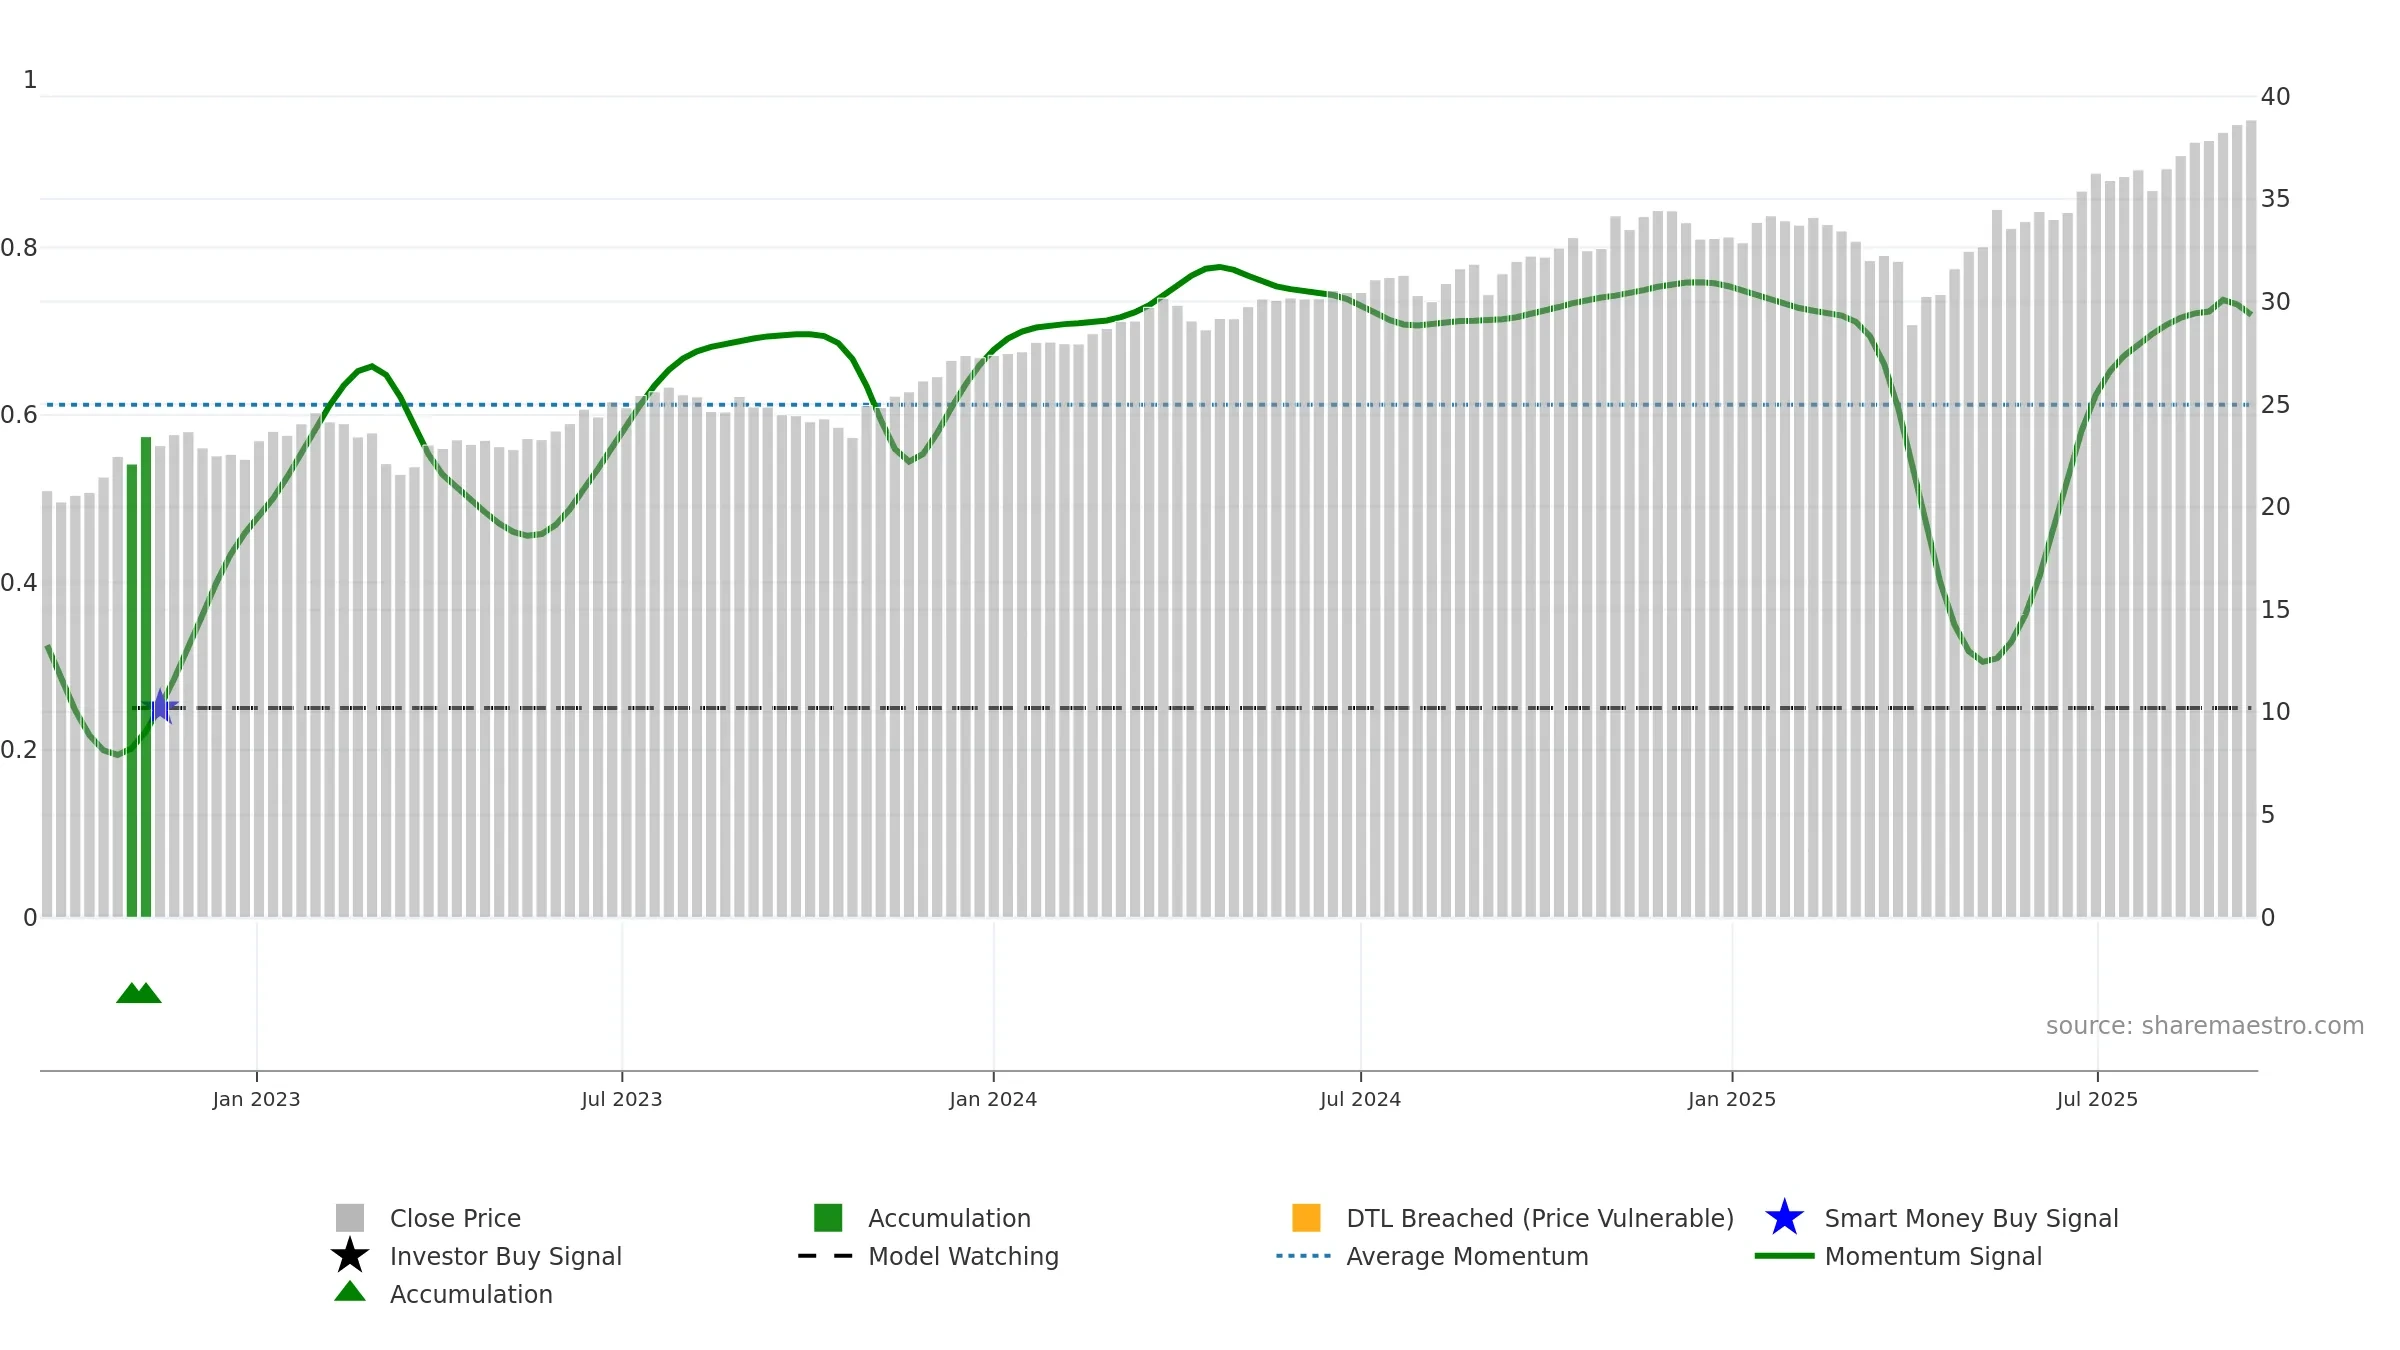
Gauge maps the trend signal to a 0–100 scale.

Gauge Reading71.9/100
DirectionRising
Accelerationdecelerating
Gauge VolatilityLow
Trend ClassificationBullish
What stands out

How to read this — Bullish gauge levels imply persistent upside pressure.

Conclusion

Positive ★★★★★

Positive setup. ★★★★★ confidence. Price window: 9. Trend: Bullish @ 71. In combination, liquidity confirms the move.

Strengths
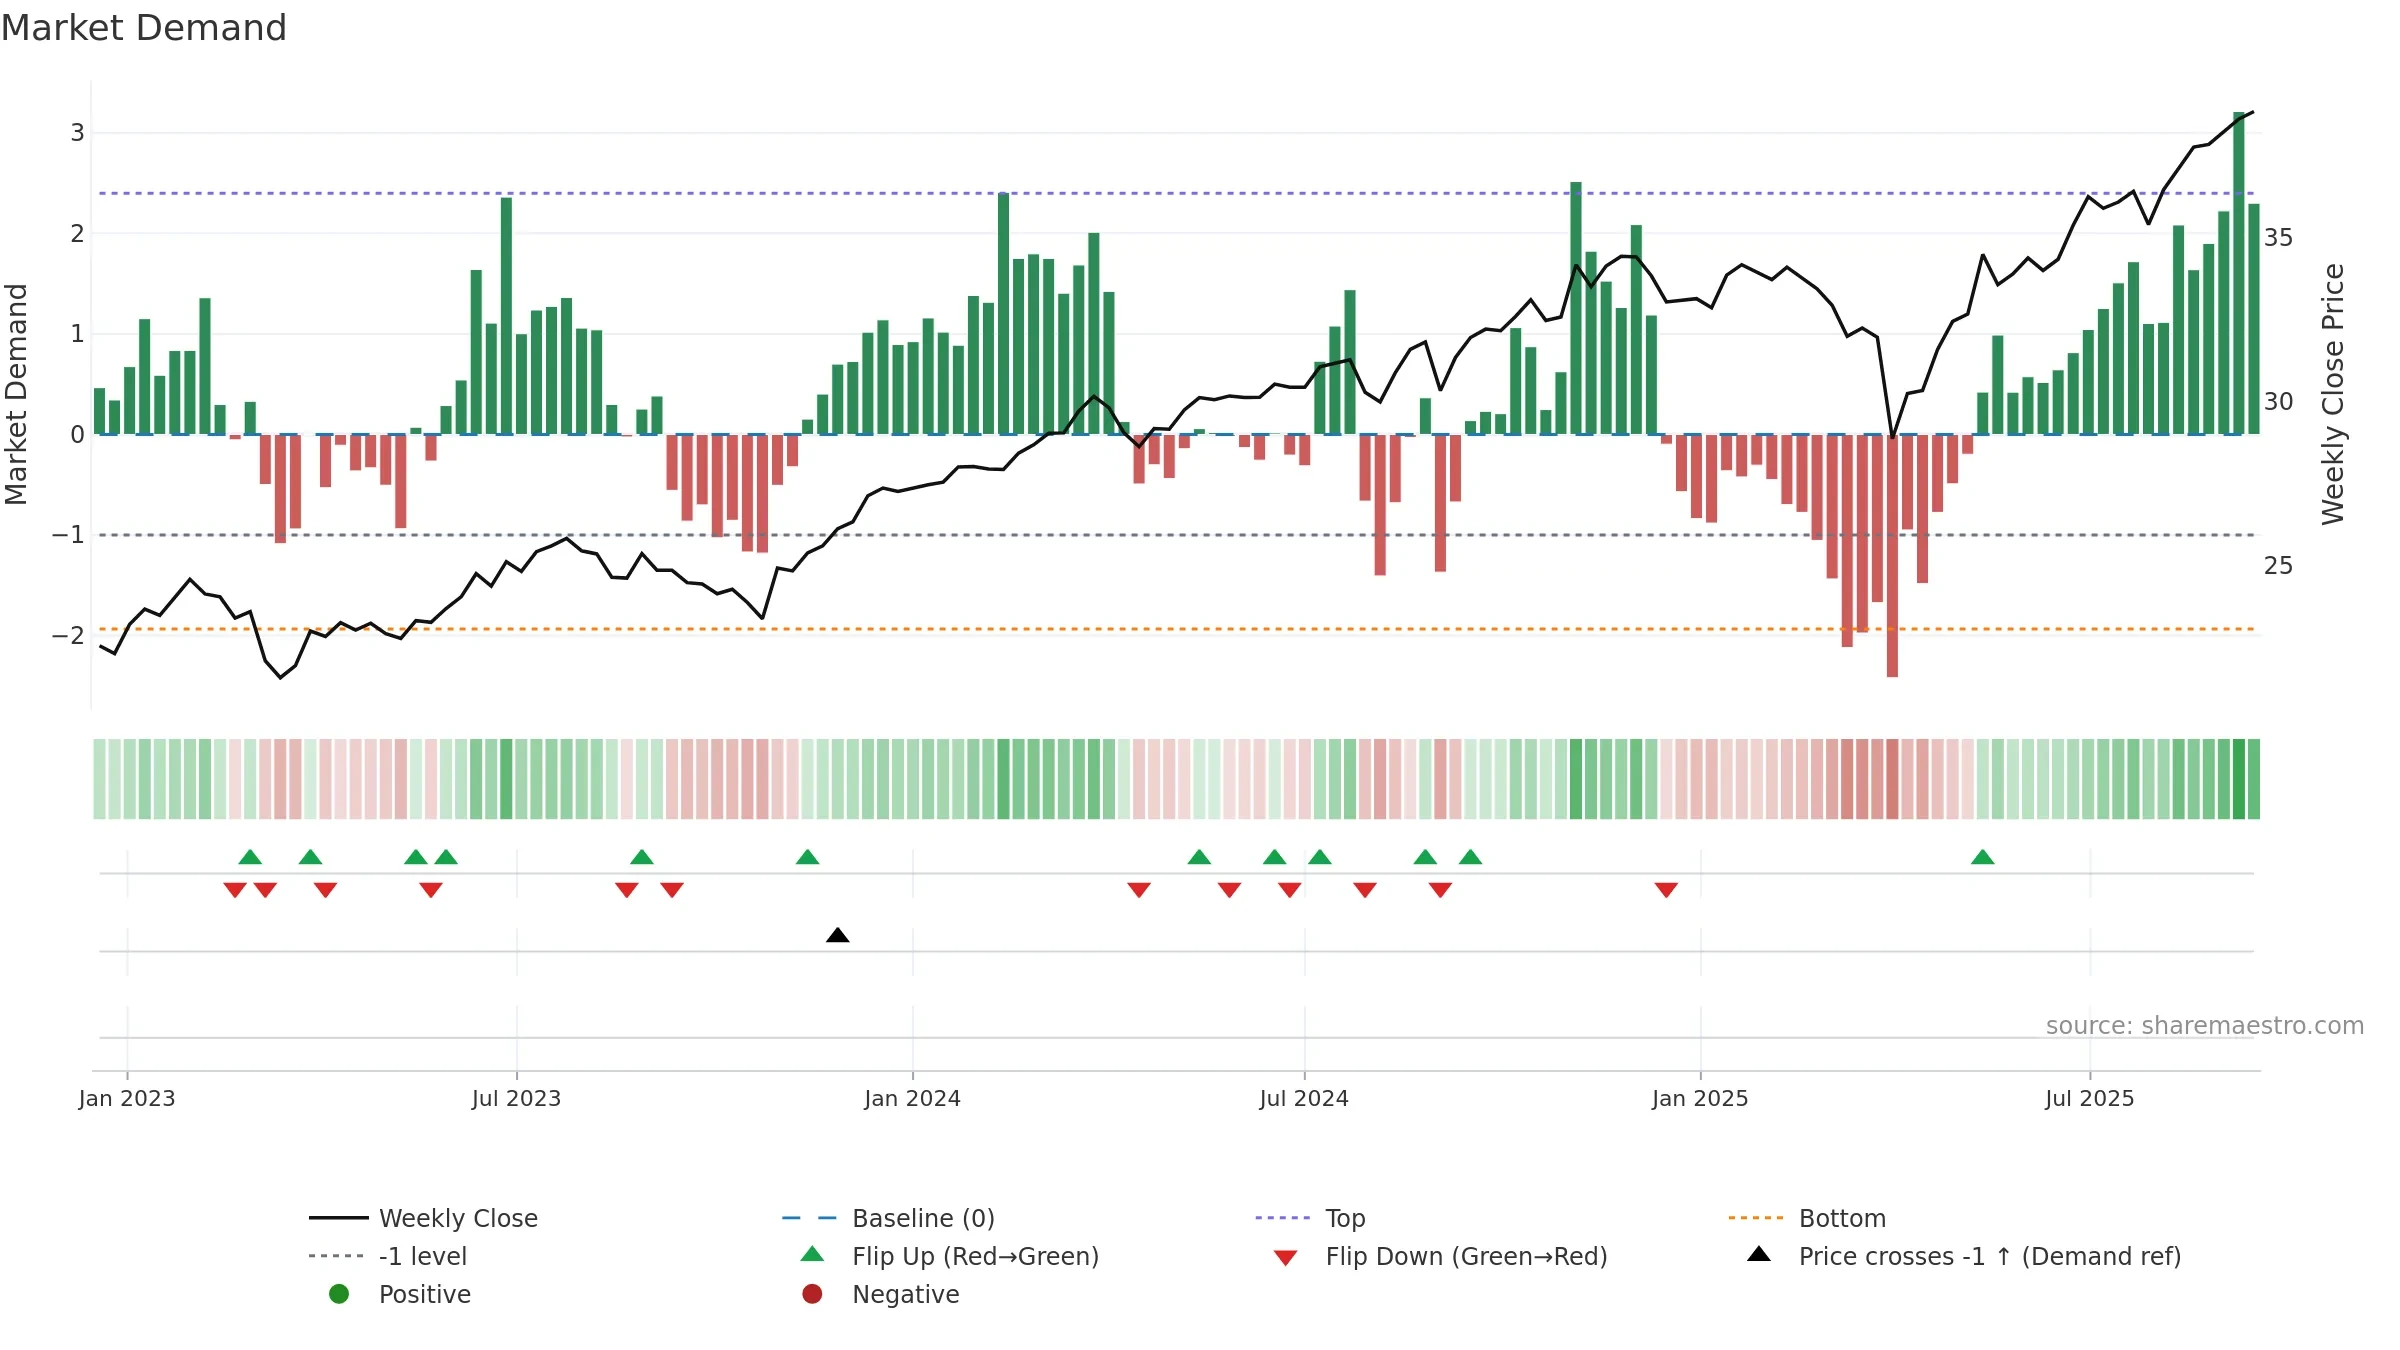
  • Momentum is bullish and rising
  • Price holds above 8w & 26w averages
  • Constructive moving-average stack
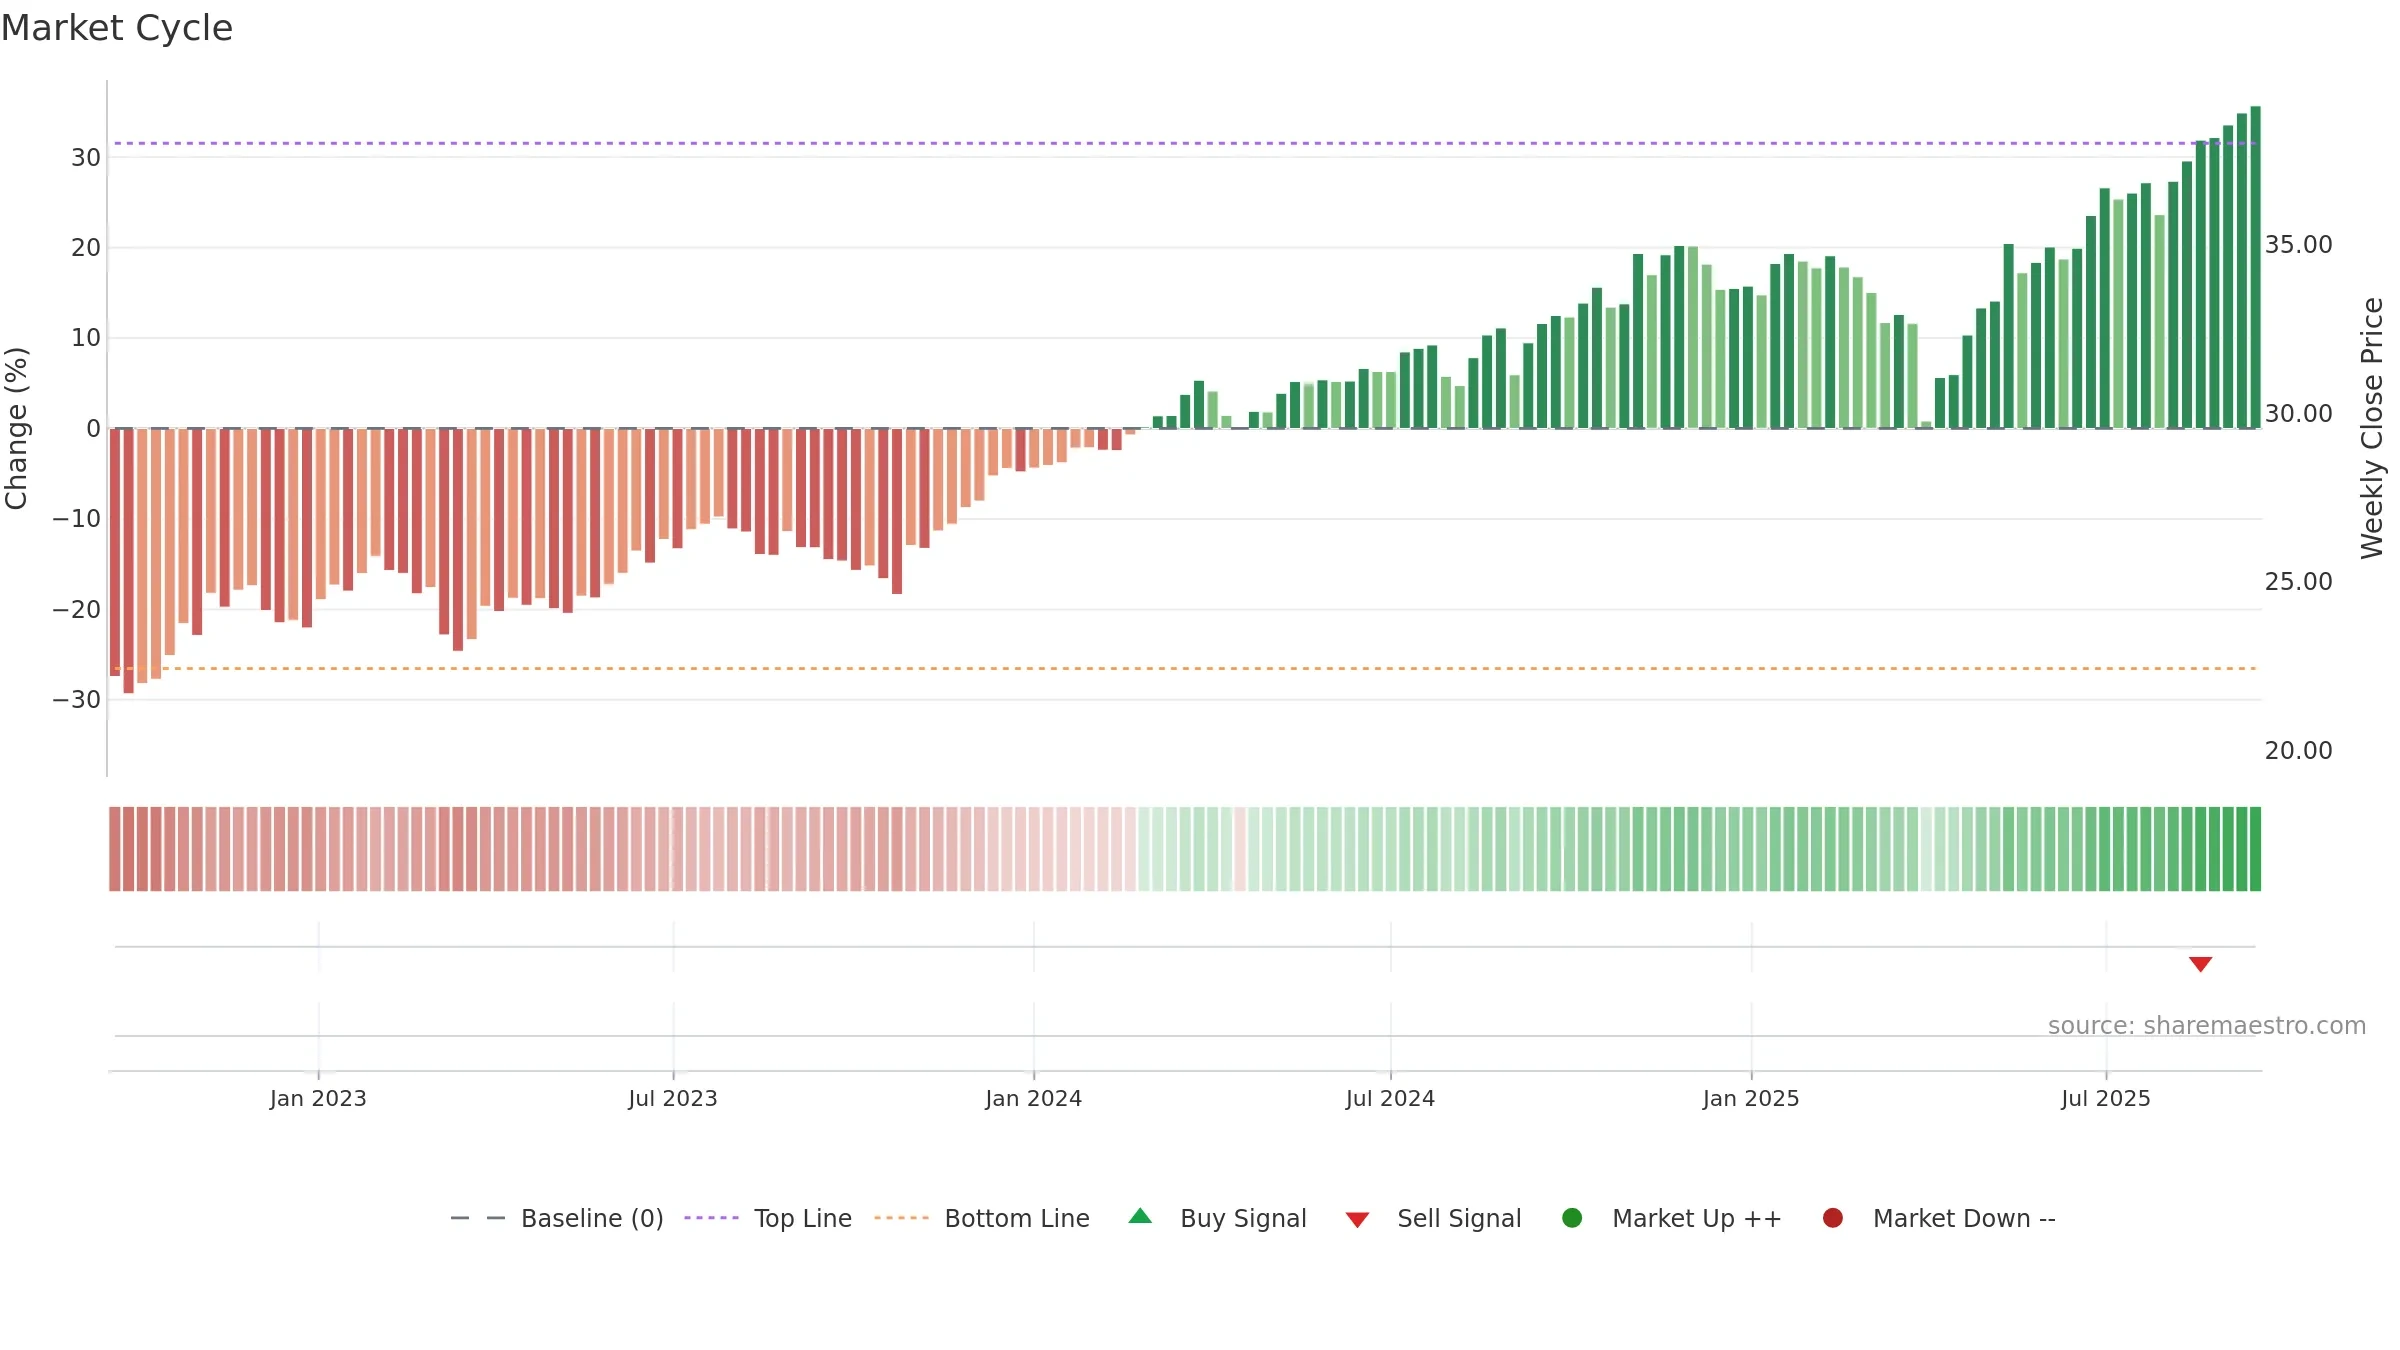
  • Liquidity confirms the price trend

Why: Price window 9.73% over 8w. Close is 0.58% above the prior-window high. Return volatility 1.84%. Volume trend rising. Liquidity convergence with price. MA stack constructive. Momentum bullish and rising .

Price Window Endpoint return over the last N weeks using weekly closes: (Closelast − Closefirst)/Closefirst × 100.
Return Volatility Std-dev of weekly returns (%). Higher = choppier.
Volume Trend Slope of weekly volume across the window (rising / falling / flat).
Vs N-week High % distance of latest close from the highest close in the window.
Accumulation Weeks Weeks price rose on higher volume than the prior week.
Distribution Weeks Weeks price fell on higher volume than the prior week.
MA Stack Relative order of short / intermediate / long MAs. Short > long is constructive.
4–8 Crossover Latest cross of 4-week vs 8-week MA (bullish / bearish / none).
Price vs MAs Whether the close is above/below key averages (8w & 26w).
Baseline Deviation % distance from the market-cycle baseline (fair-value track).
Gauge Reading Smoothed trend signal mapped to 0–100.
Direction Slope sign of the gauge across the window (rising / falling).
Acceleration Change in the slope of the gauge (accelerating / decelerating).
Gauge Volatility Variability of the gauge (low / normal / high).
Zone Label Classification by level (Bullish / Neutral / Bearish).
Target Price (Flag) If flagged: Positive/Negative stance. Otherwise: numeric fair value.
Composite Score Overall model score (0–10).
Hybrid Efficiency Efficiency of growth × quality (0–10).
Rating Model’s verdict for the snapshot.
Weekly Close Sparkline of the last 52 weekly closing prices.
Trend Line Sparkline of the smoothed trend signal over the last 52 weeks.

Tip: Most metrics also include a hover tooltip where they appear in the report.

Download JSON Download CSV JSON-LD Snapshots: 2025-09-15