AlTi Global, Inc.
ALTI NASDAQ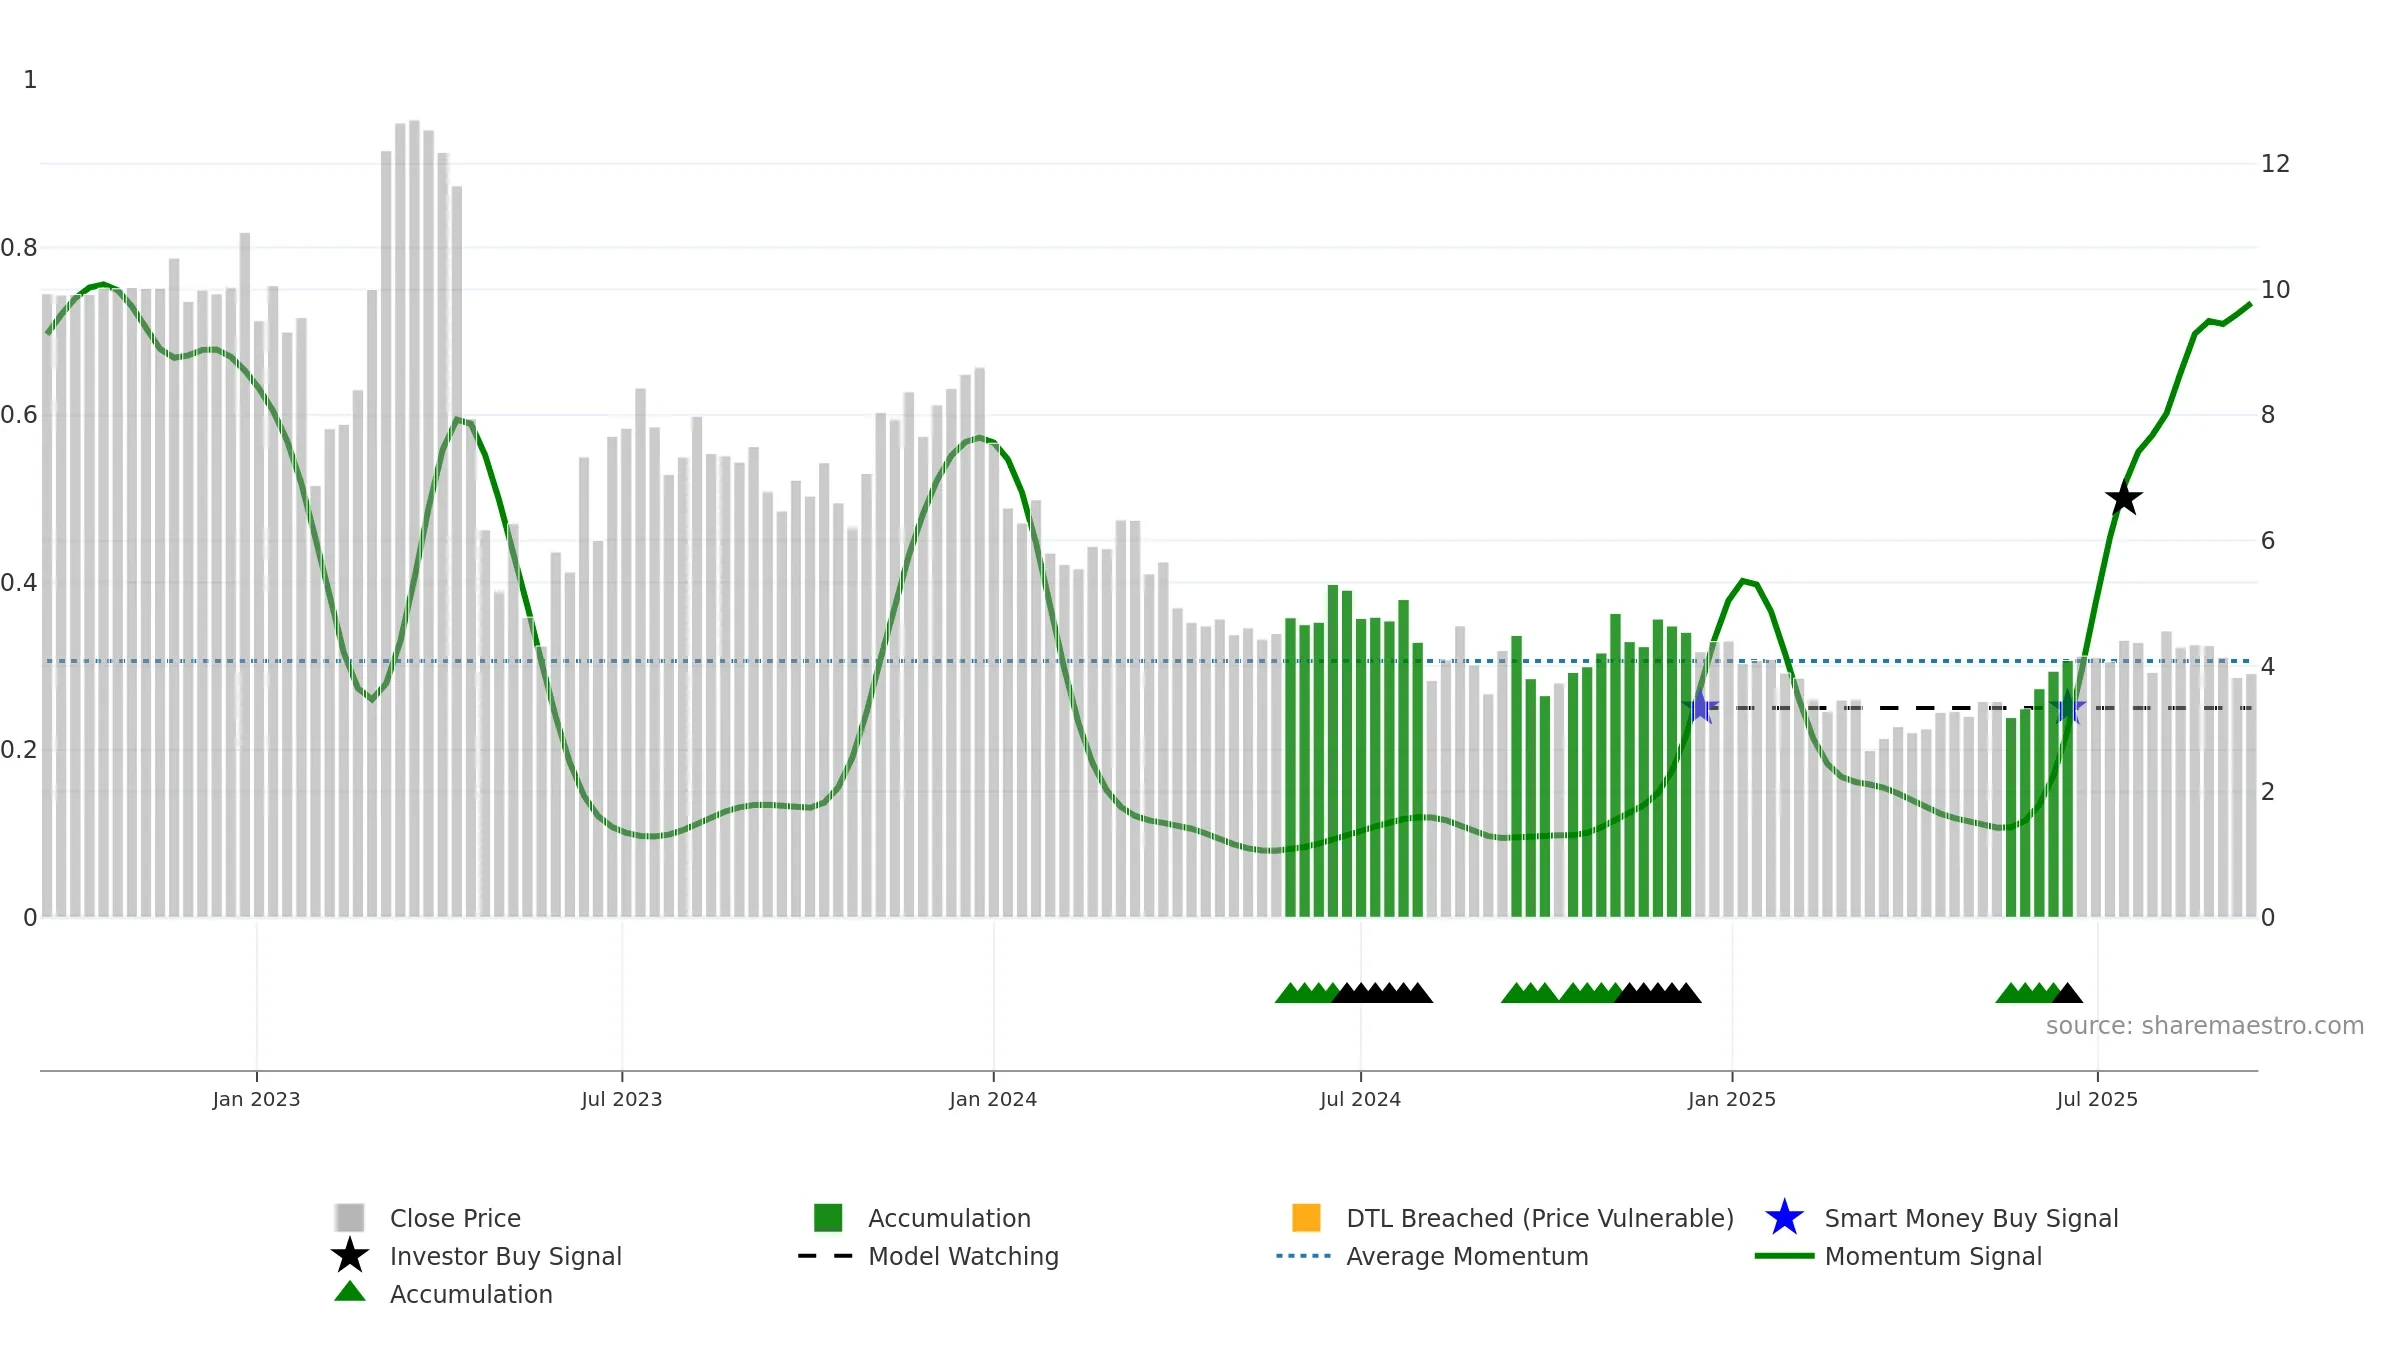
Weekly Summary
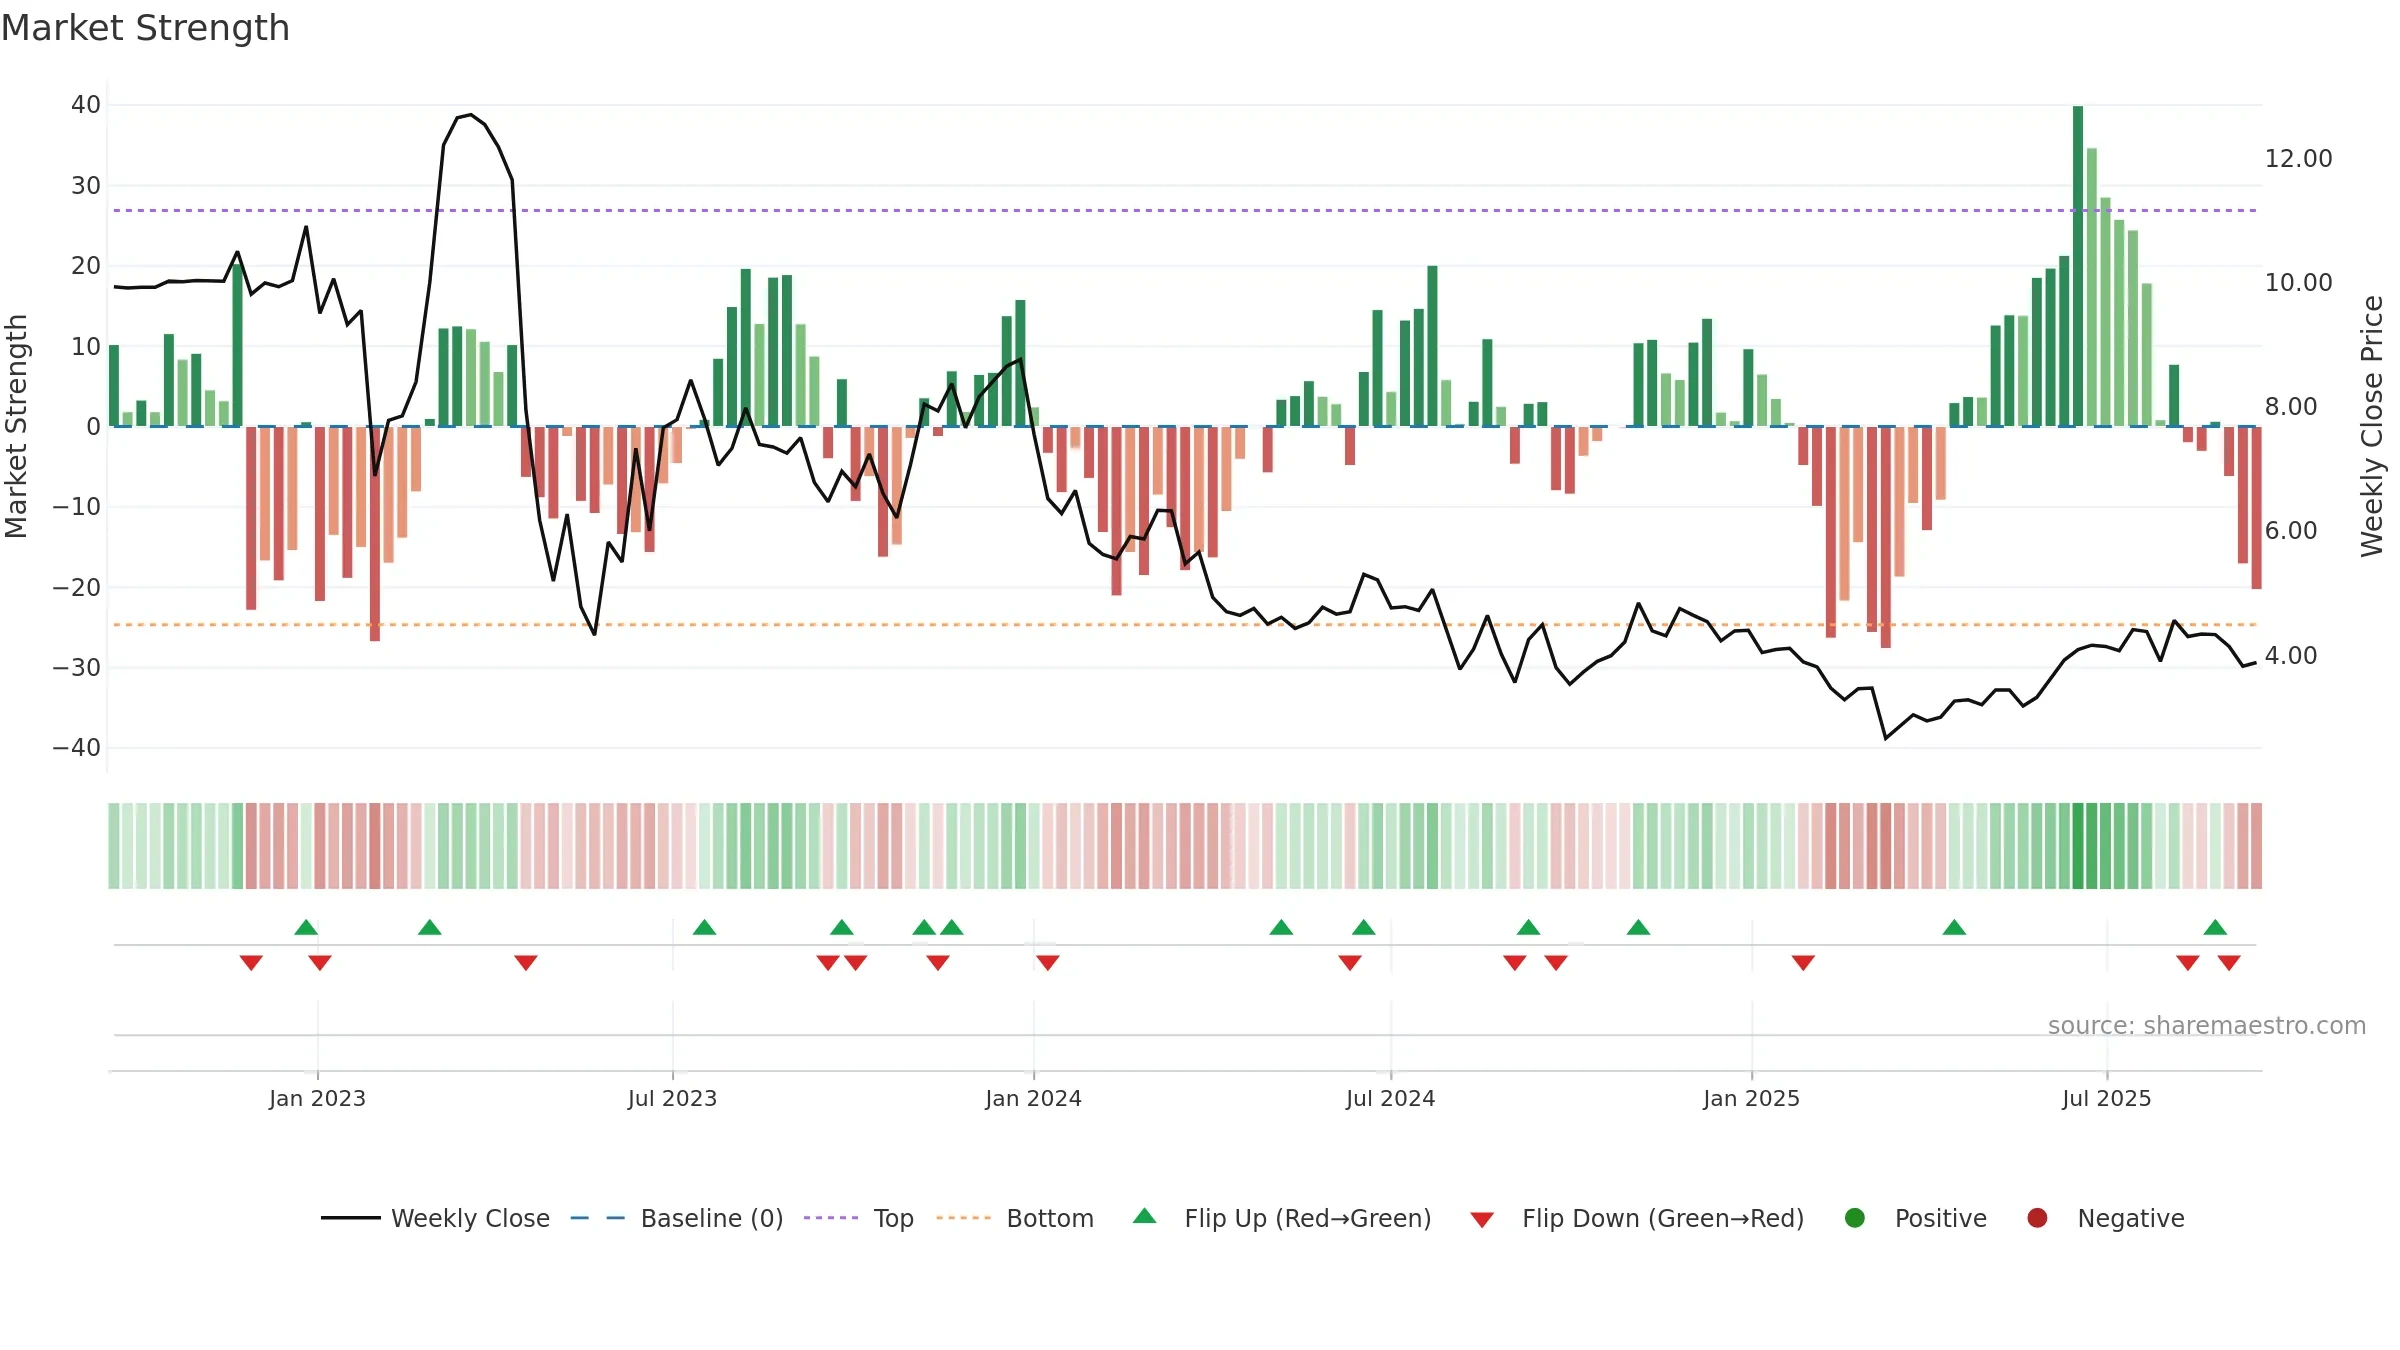
AlTi Global, Inc. closed at 3.8800 (1.31% WoW) . Data window ends Mon, 15 Sep 2025.
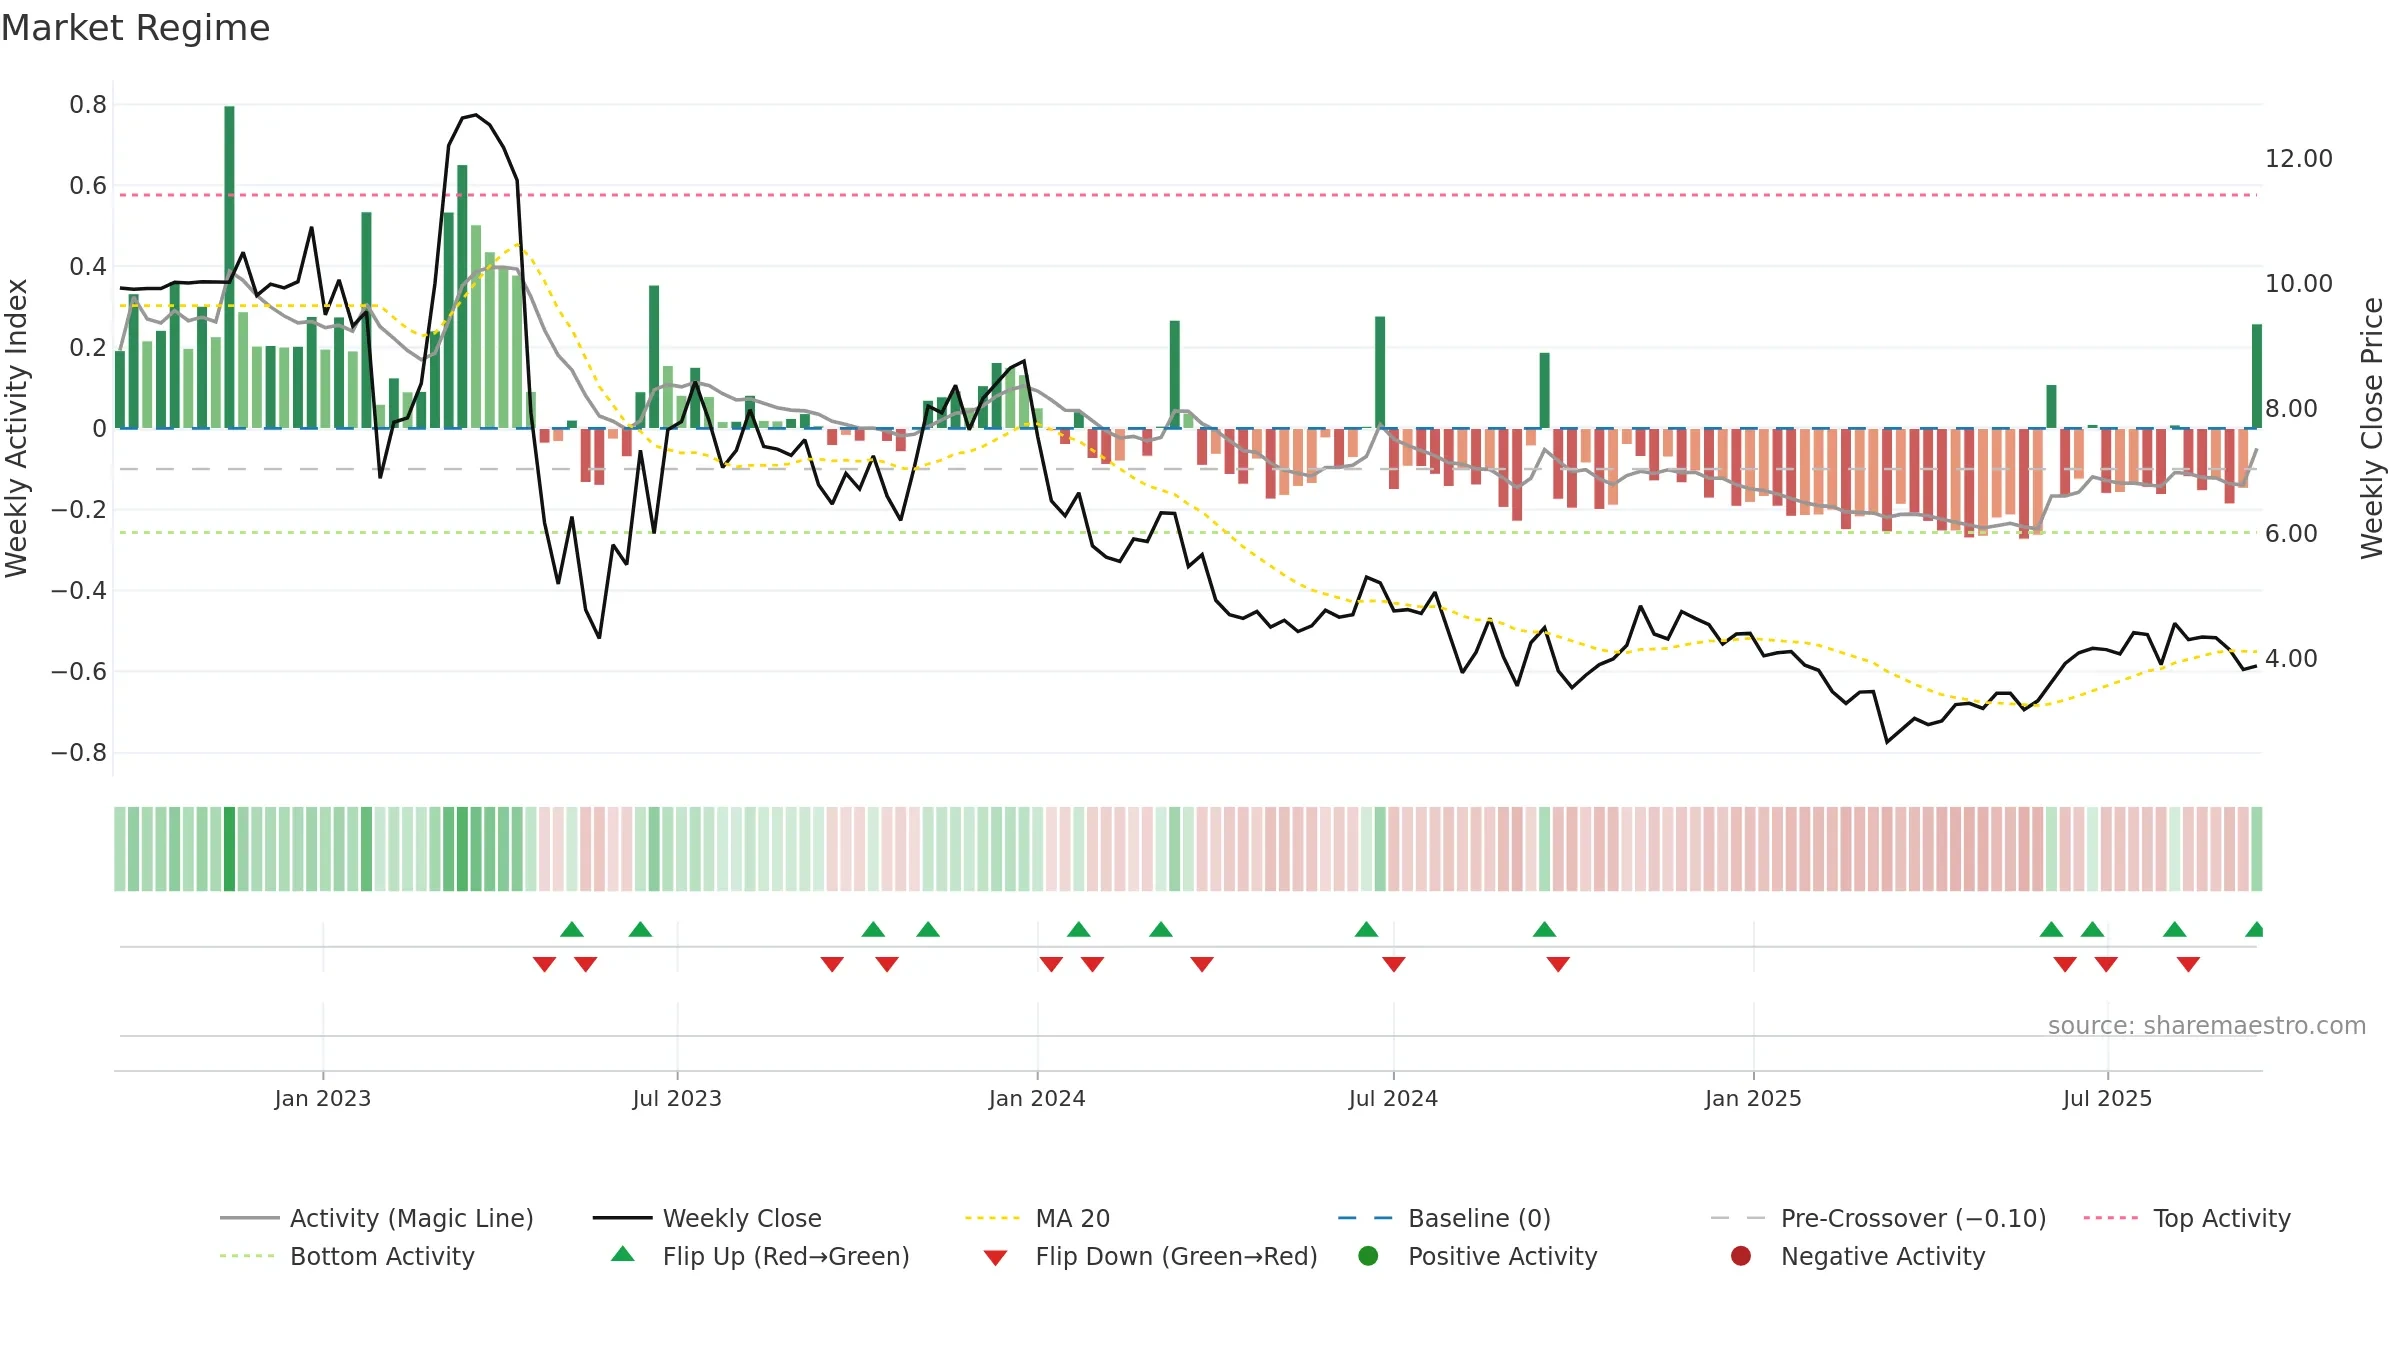
How to read this — Price slope is downward, indicating persistent supply pressure. Elevated weekly volatility increases whipsaw risk. Volume trend diverges from price — watch for fatigue or rotation. Returns are positively correlated with volume — strength tends to arrive on higher activity.
Down-slope argues for patience; rallies can fade sooner unless participation improves. Because liquidity isn’t confirming, prefer evidence of fresh demand before chasing moves.
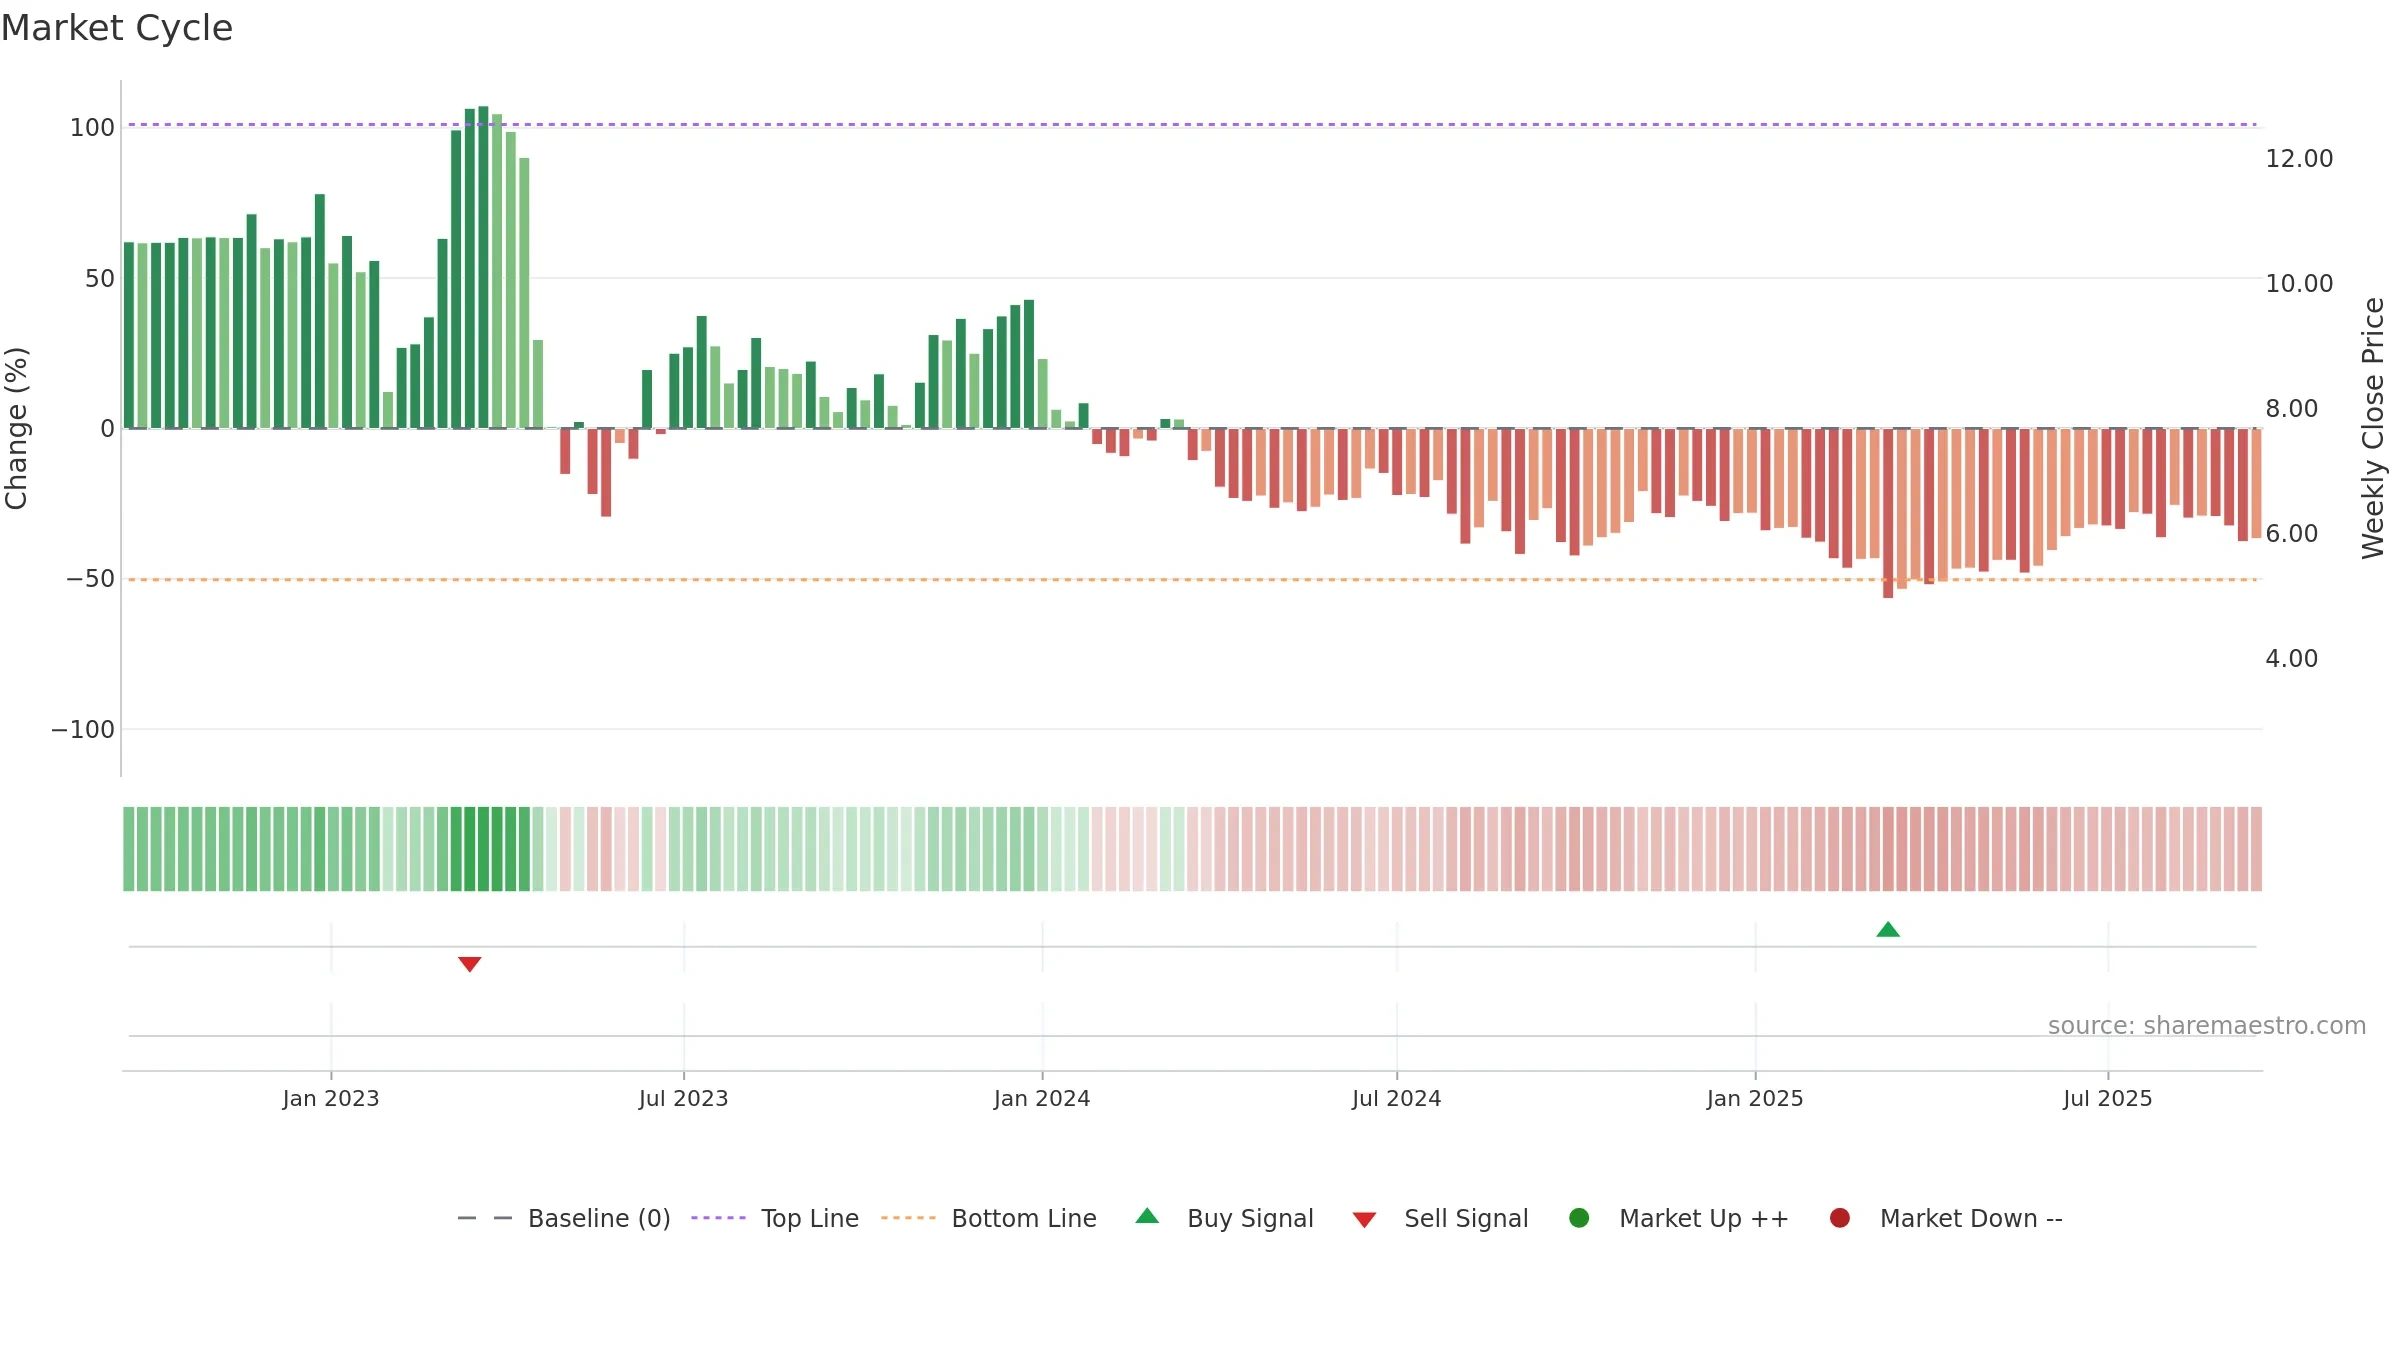
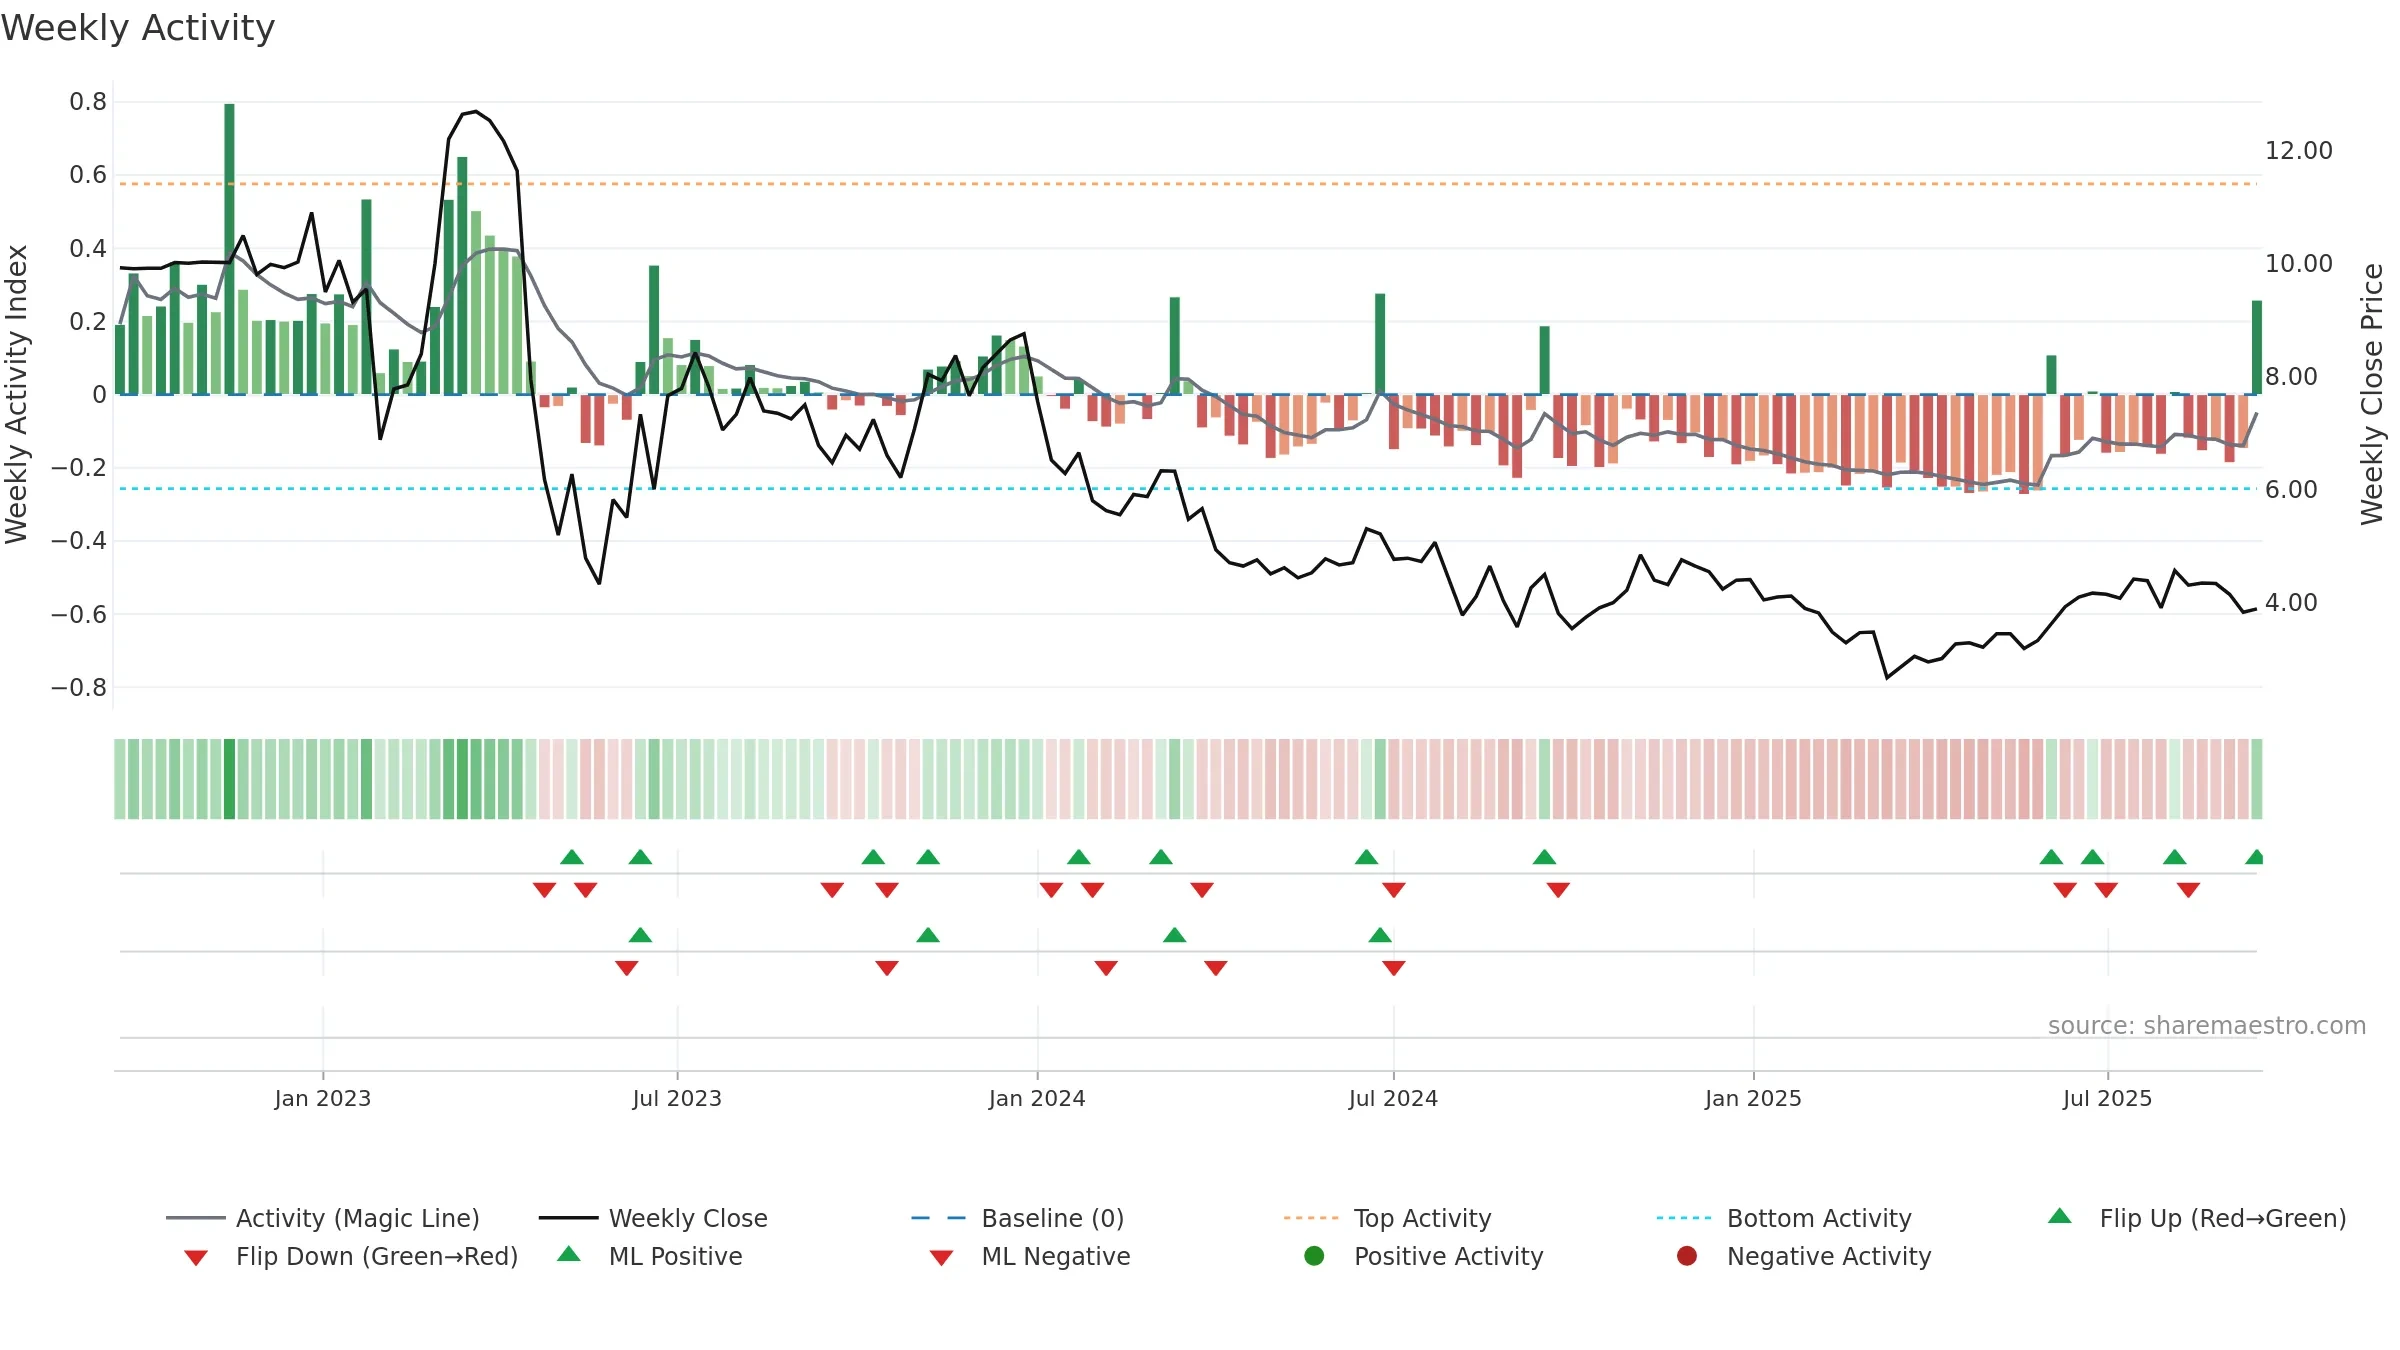
Gauge maps the trend signal to a 0–100 scale.
How to read this — Range-bound conditions; conviction is limited until a break or acceleration emerges.
Wait for a directional break or improving acceleration.

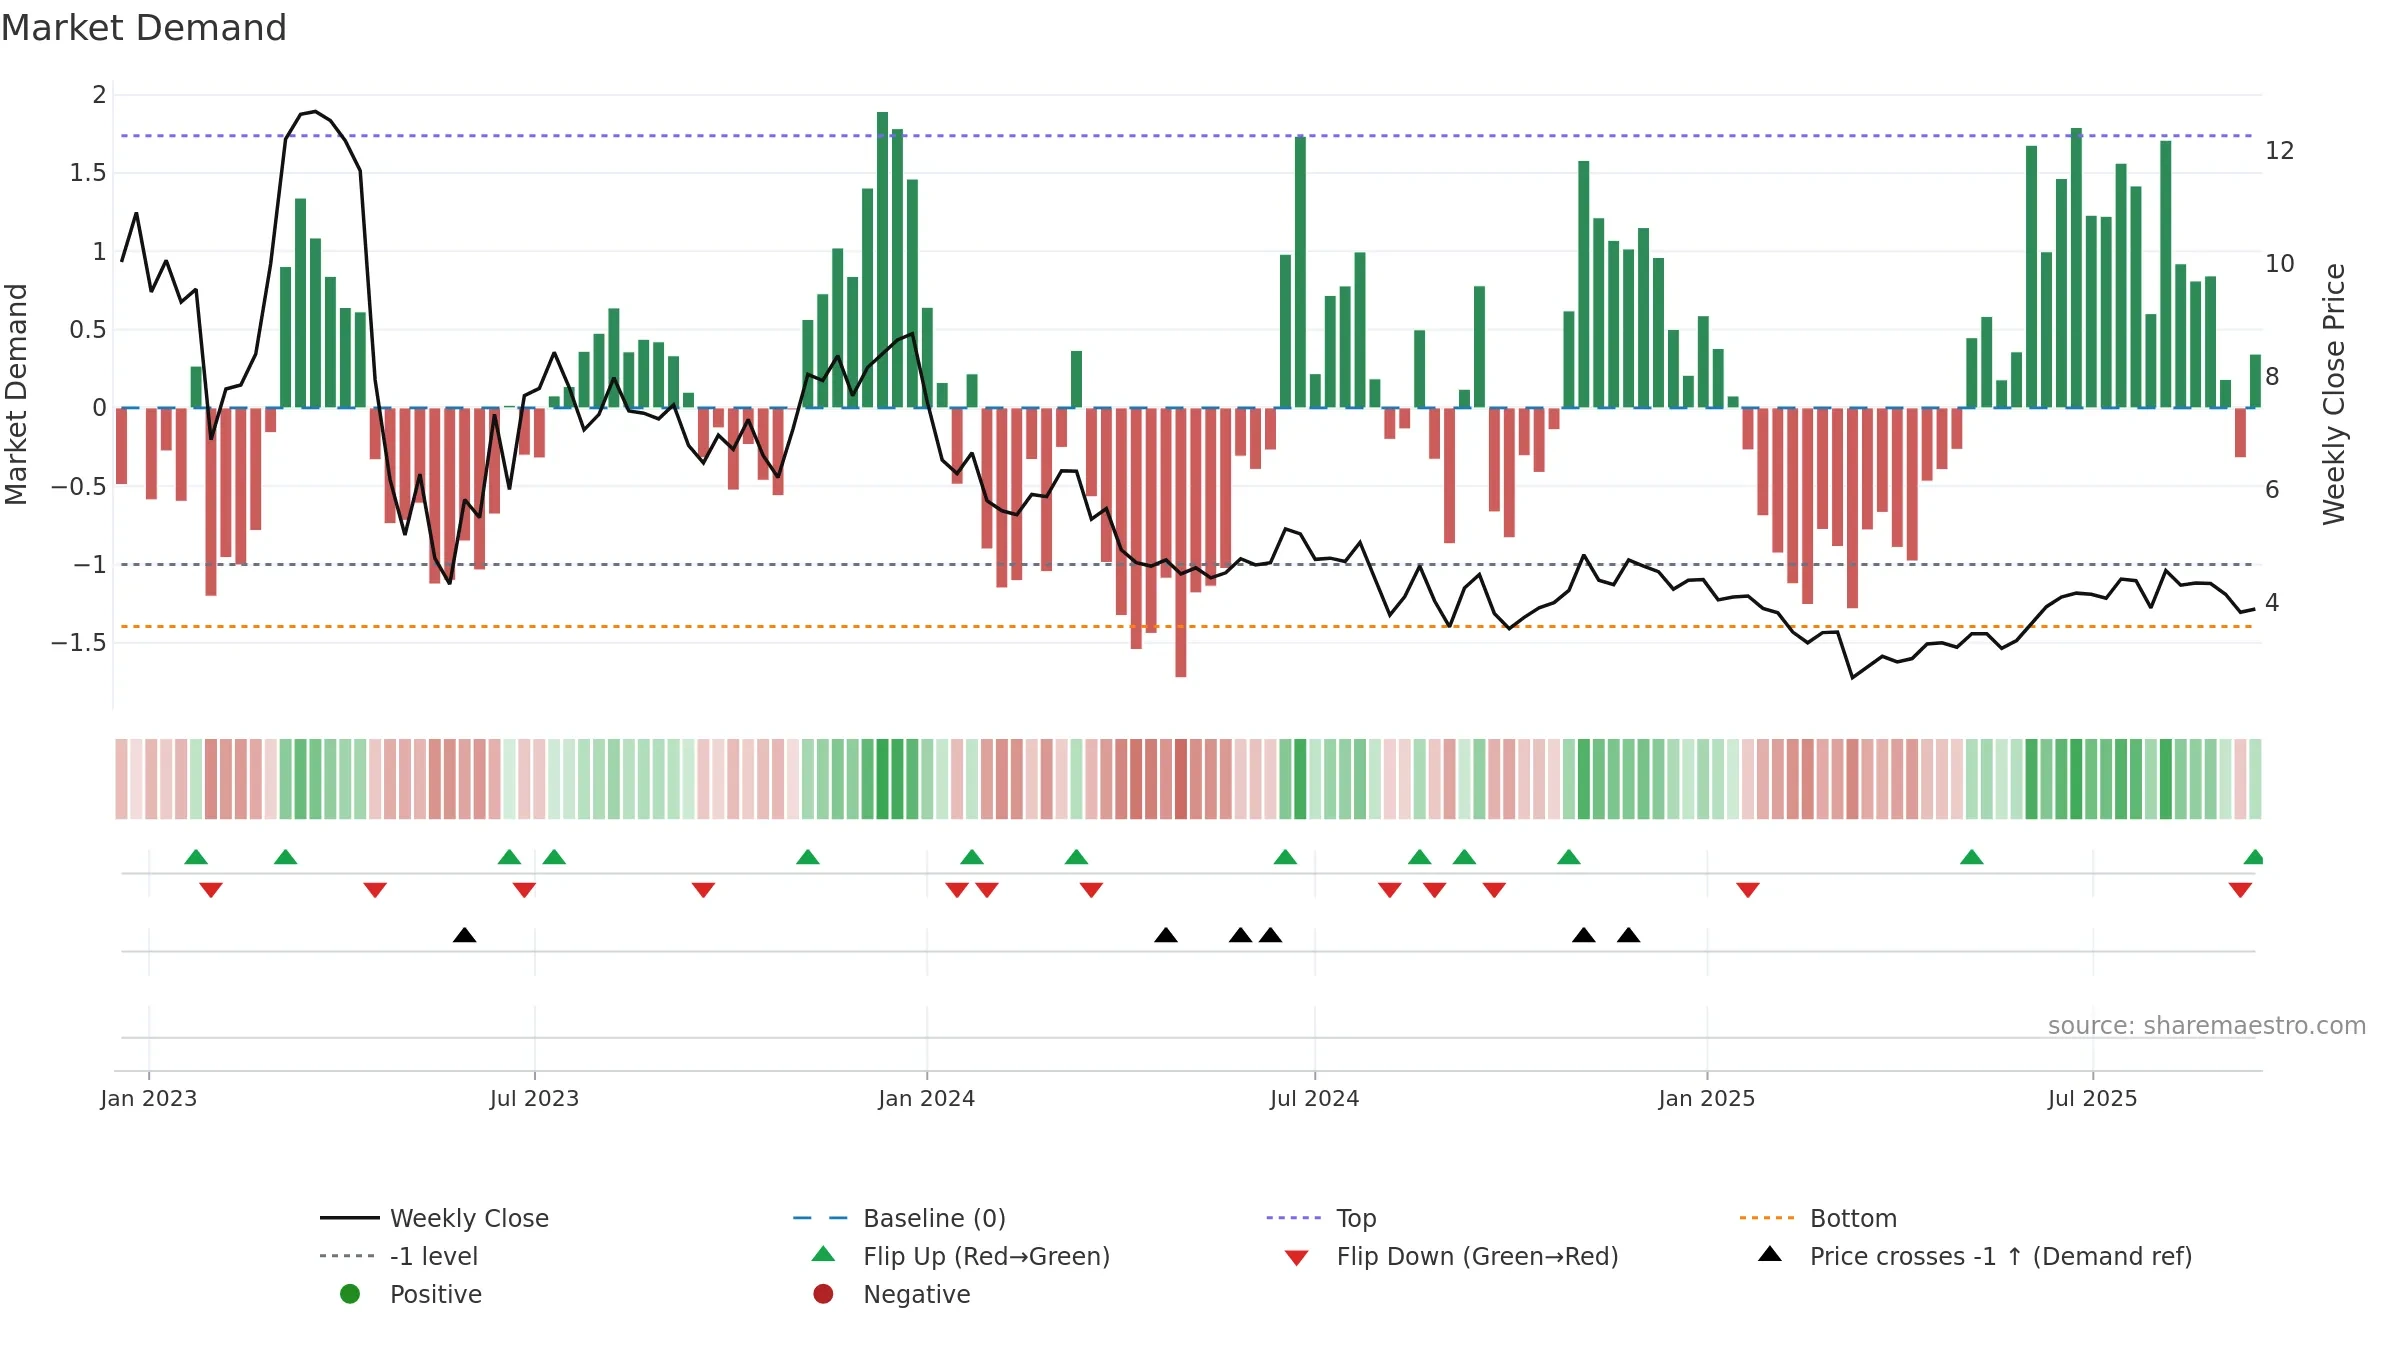
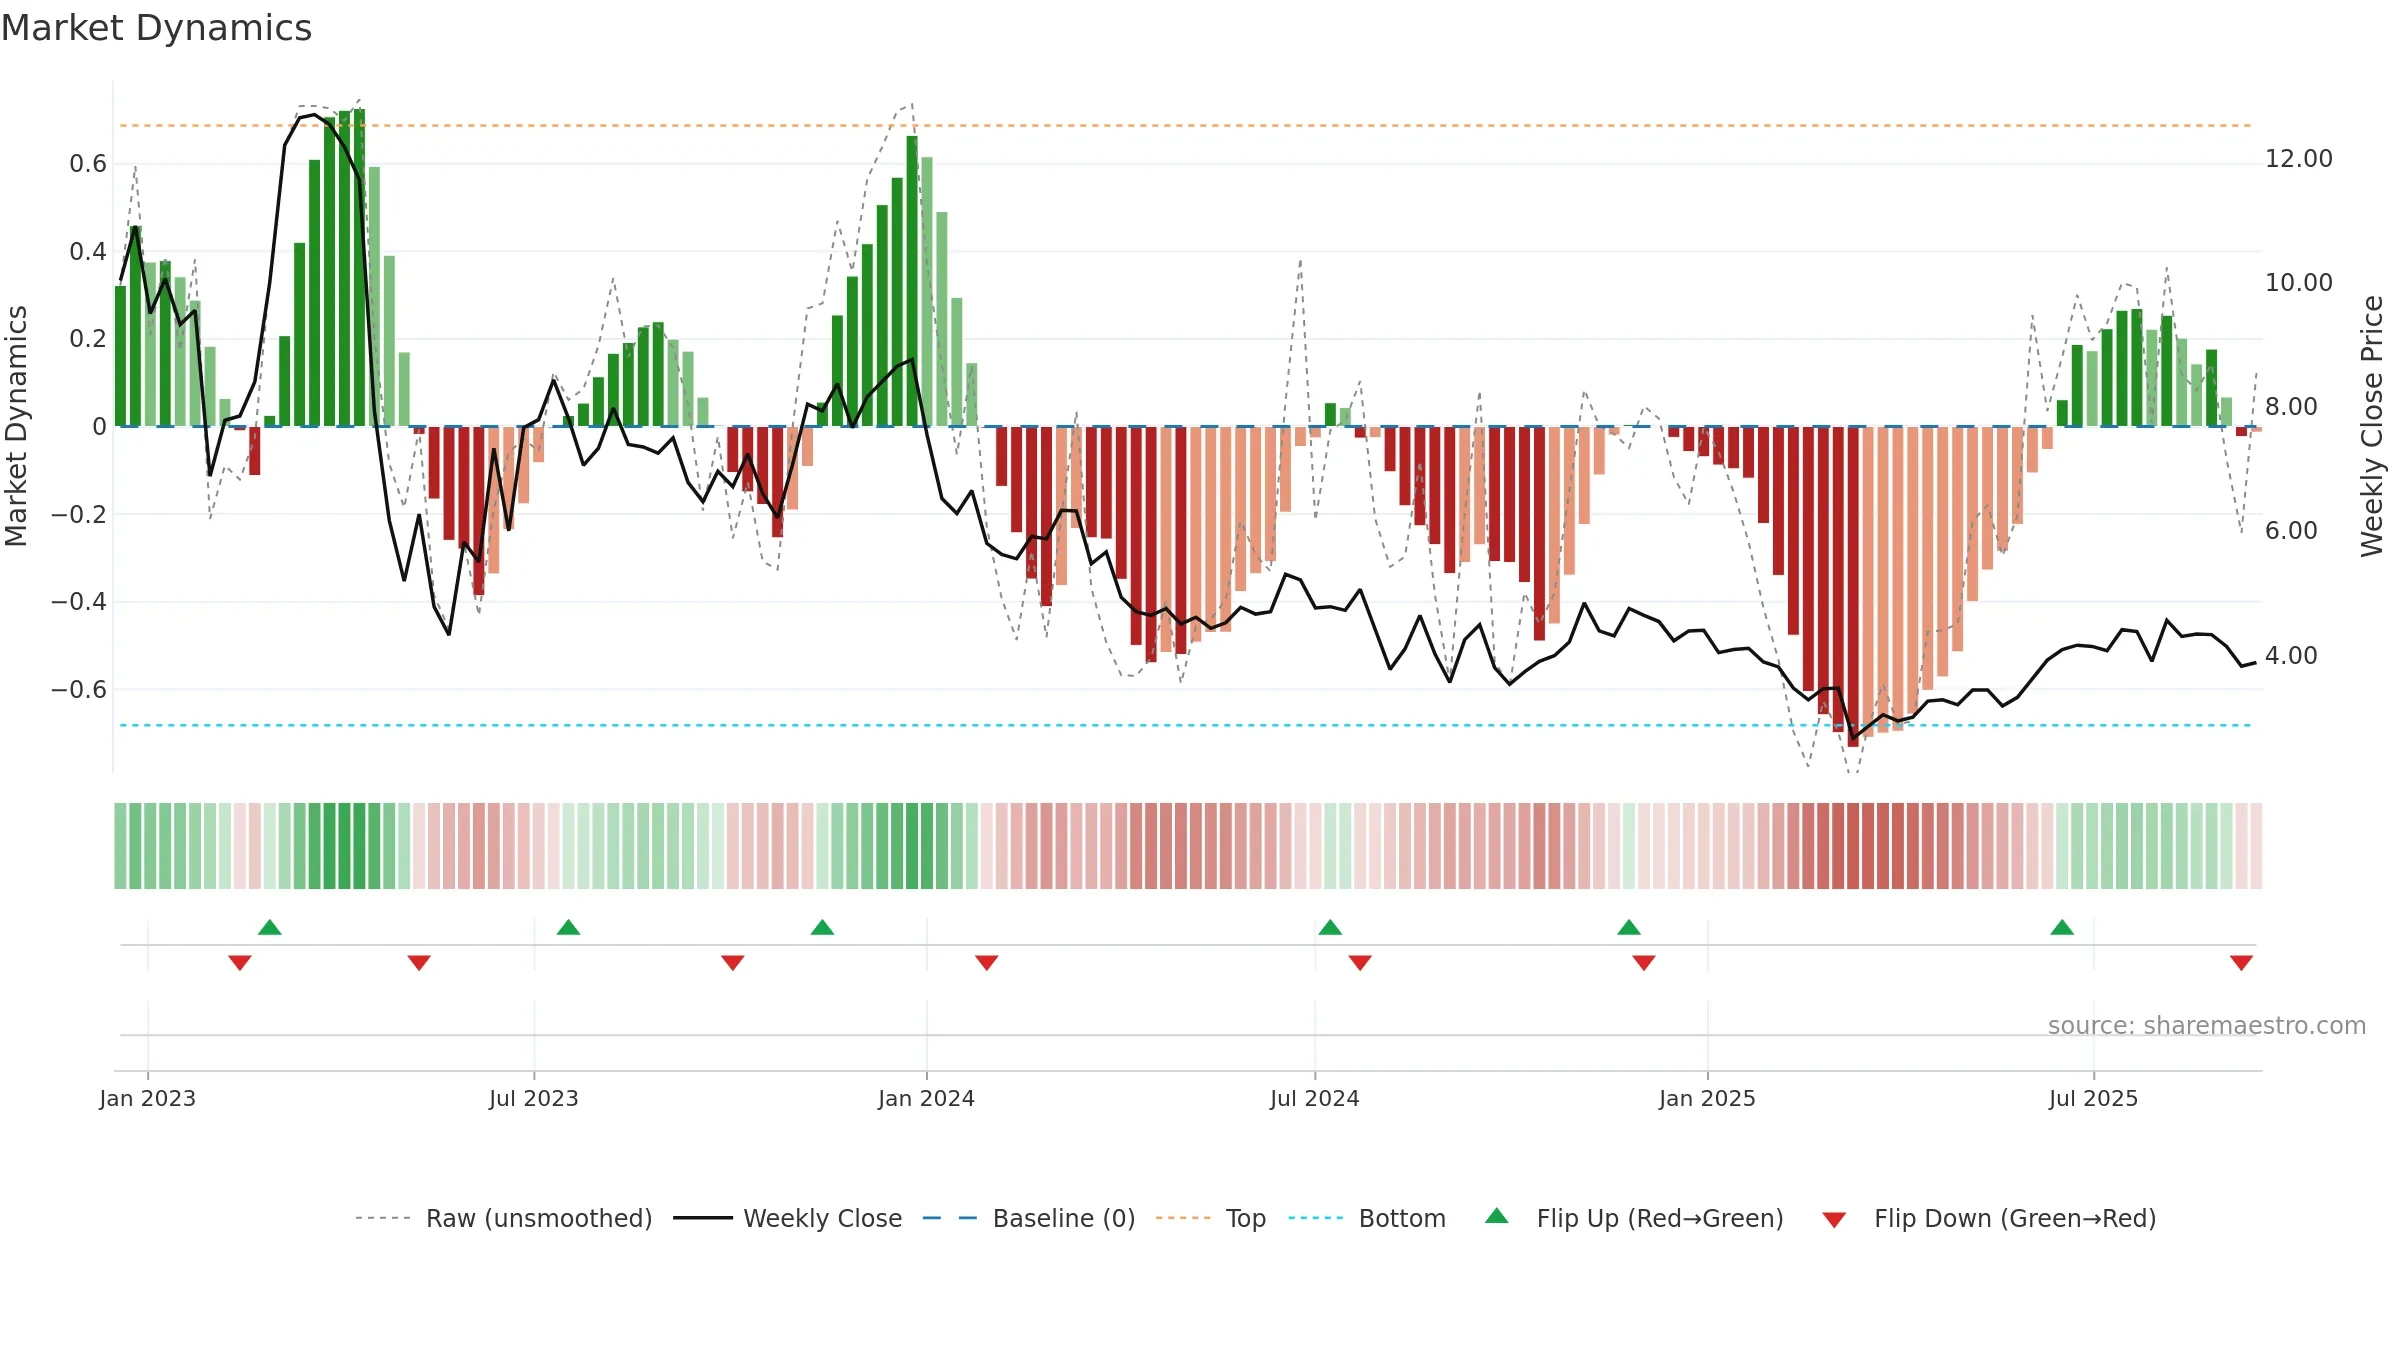
Relative strength is Negative
(< 0%, underperforming).
Latest MRS: -11.18% (week ending Fri, 19 Sep 2025).
Slope: Falling over 8w.
Notes:
- Below zero line indicates relative weakness vs benchmark.
- MRS slope falling over ~8 weeks.
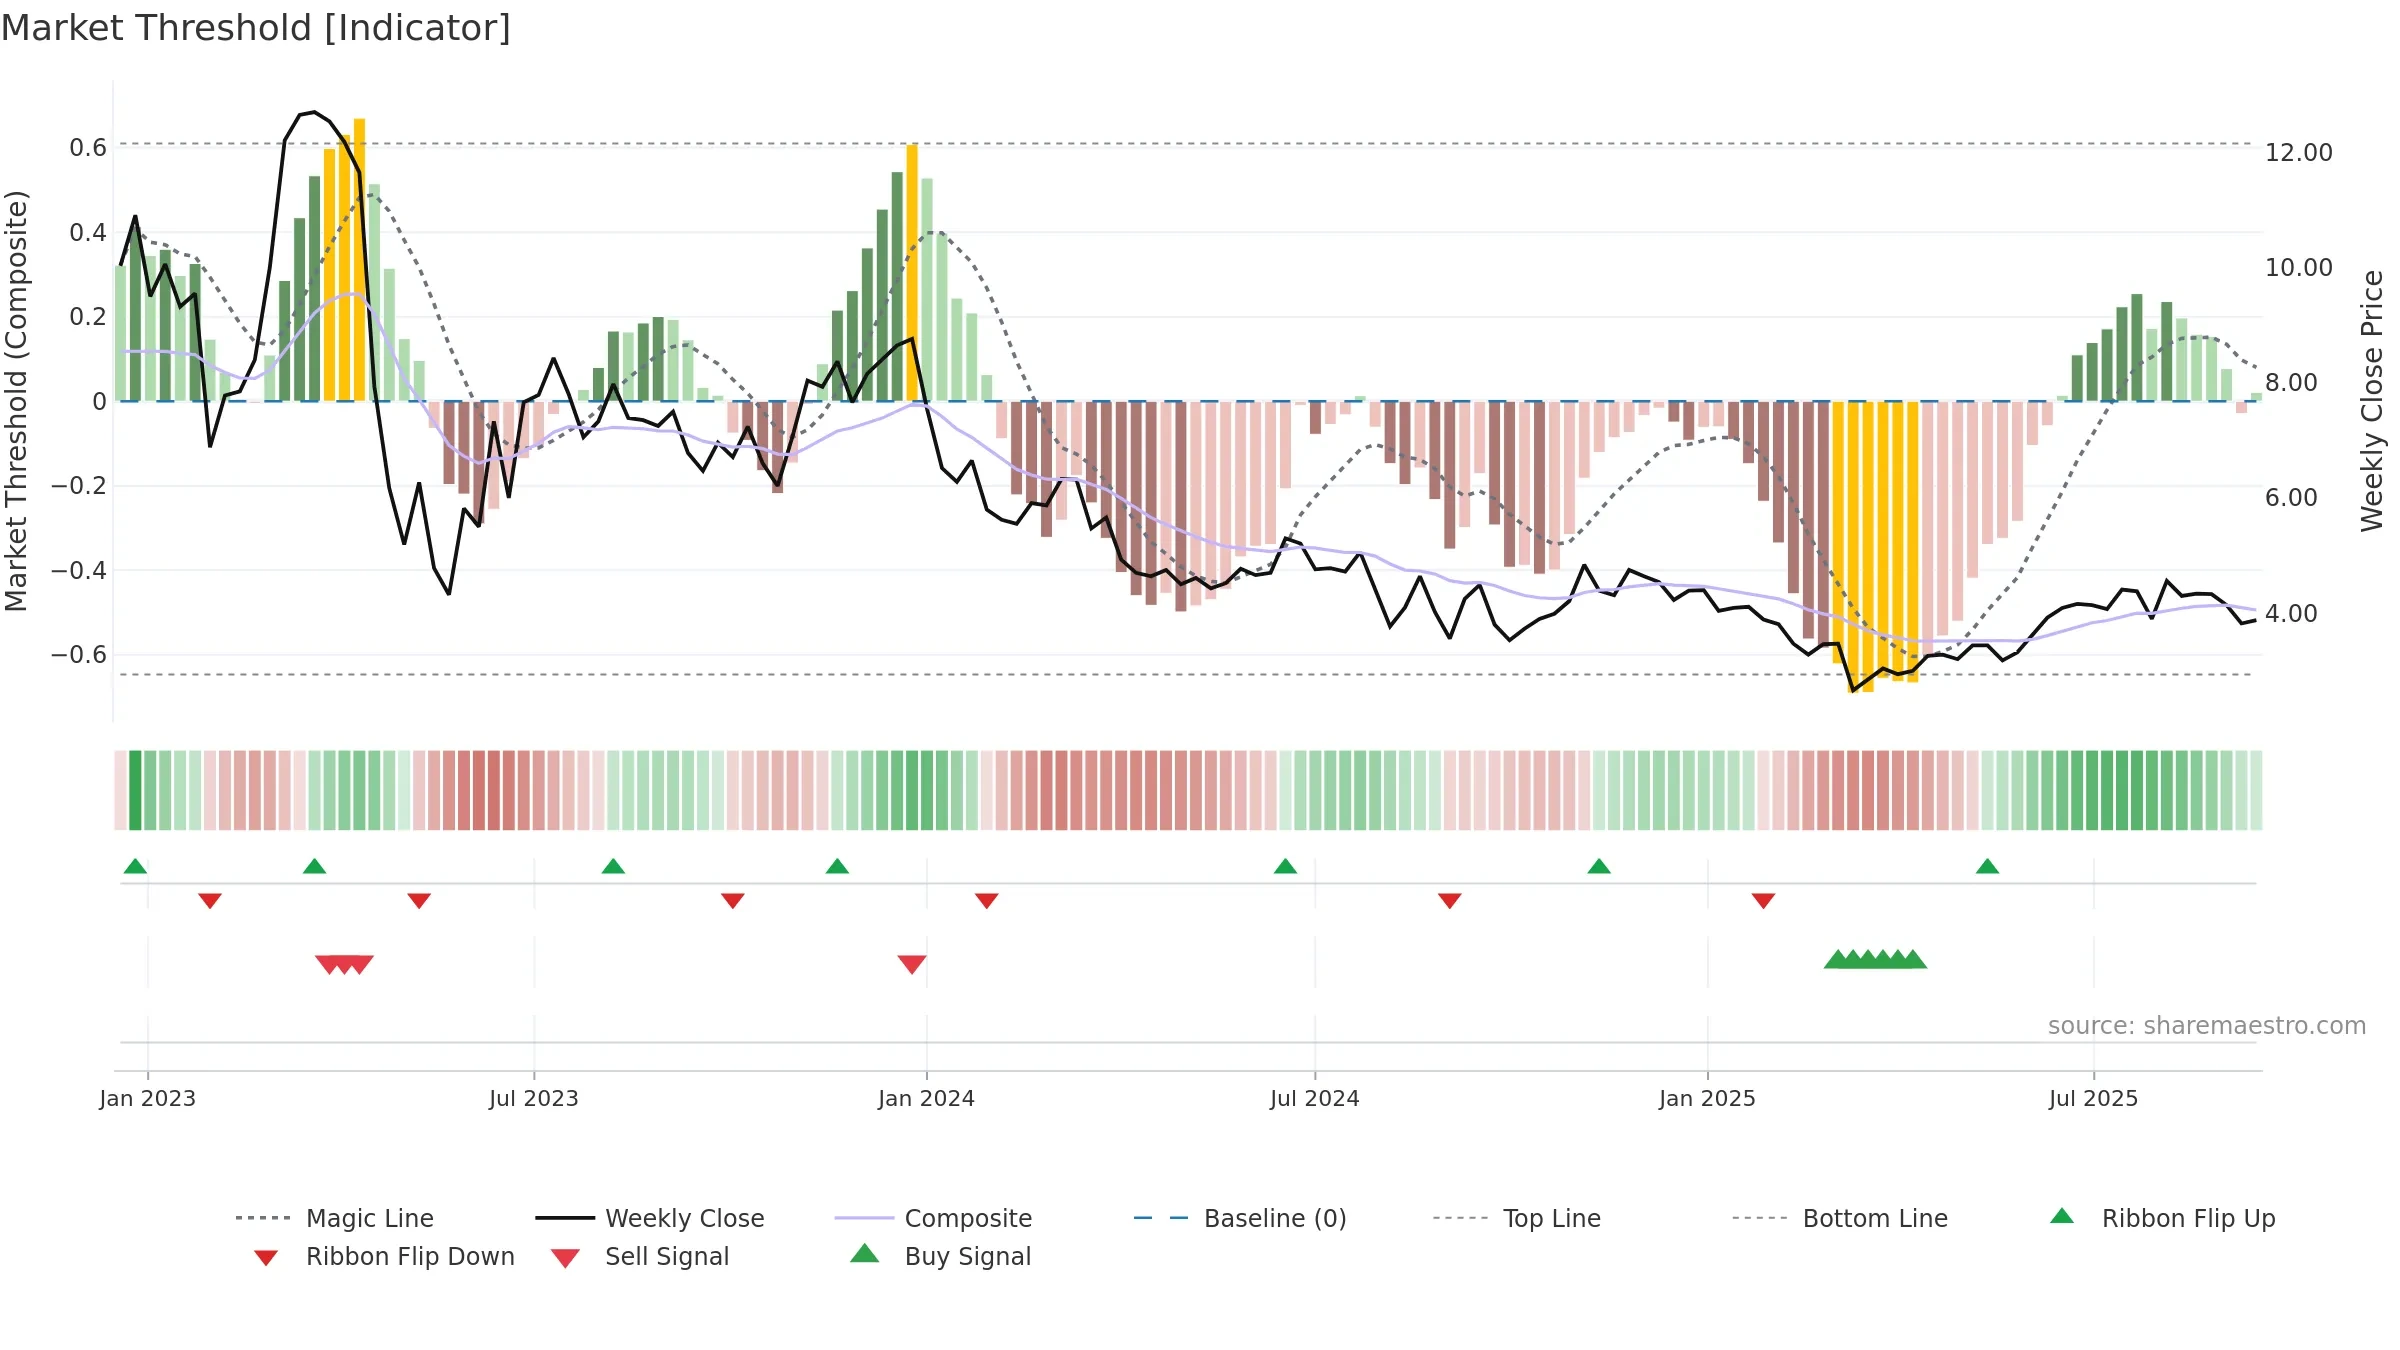
Conclusion
Negative setup. ★⯪☆☆☆ confidence. Trend: Range / Neutral · -0.51% over window · vol 7.62% · liquidity divergence · posture mixed · RS weak
- Momentum is bullish and rising
- Price is not above key averages
- Liquidity diverges from price
- High return volatility raises whipsaw risk
- Negative multi-week performance
Why: Price window -0.51% over w. Close is -14.91% below the prior-window high. Return volatility 7.62%. Volume trend rising. Liquidity divergence with price. Trend state range / neutral. Momentum bullish and rising.
Tip: Most metrics include a hover tooltip where they appear in the report.