JBM Auto Limited
JBMA NSE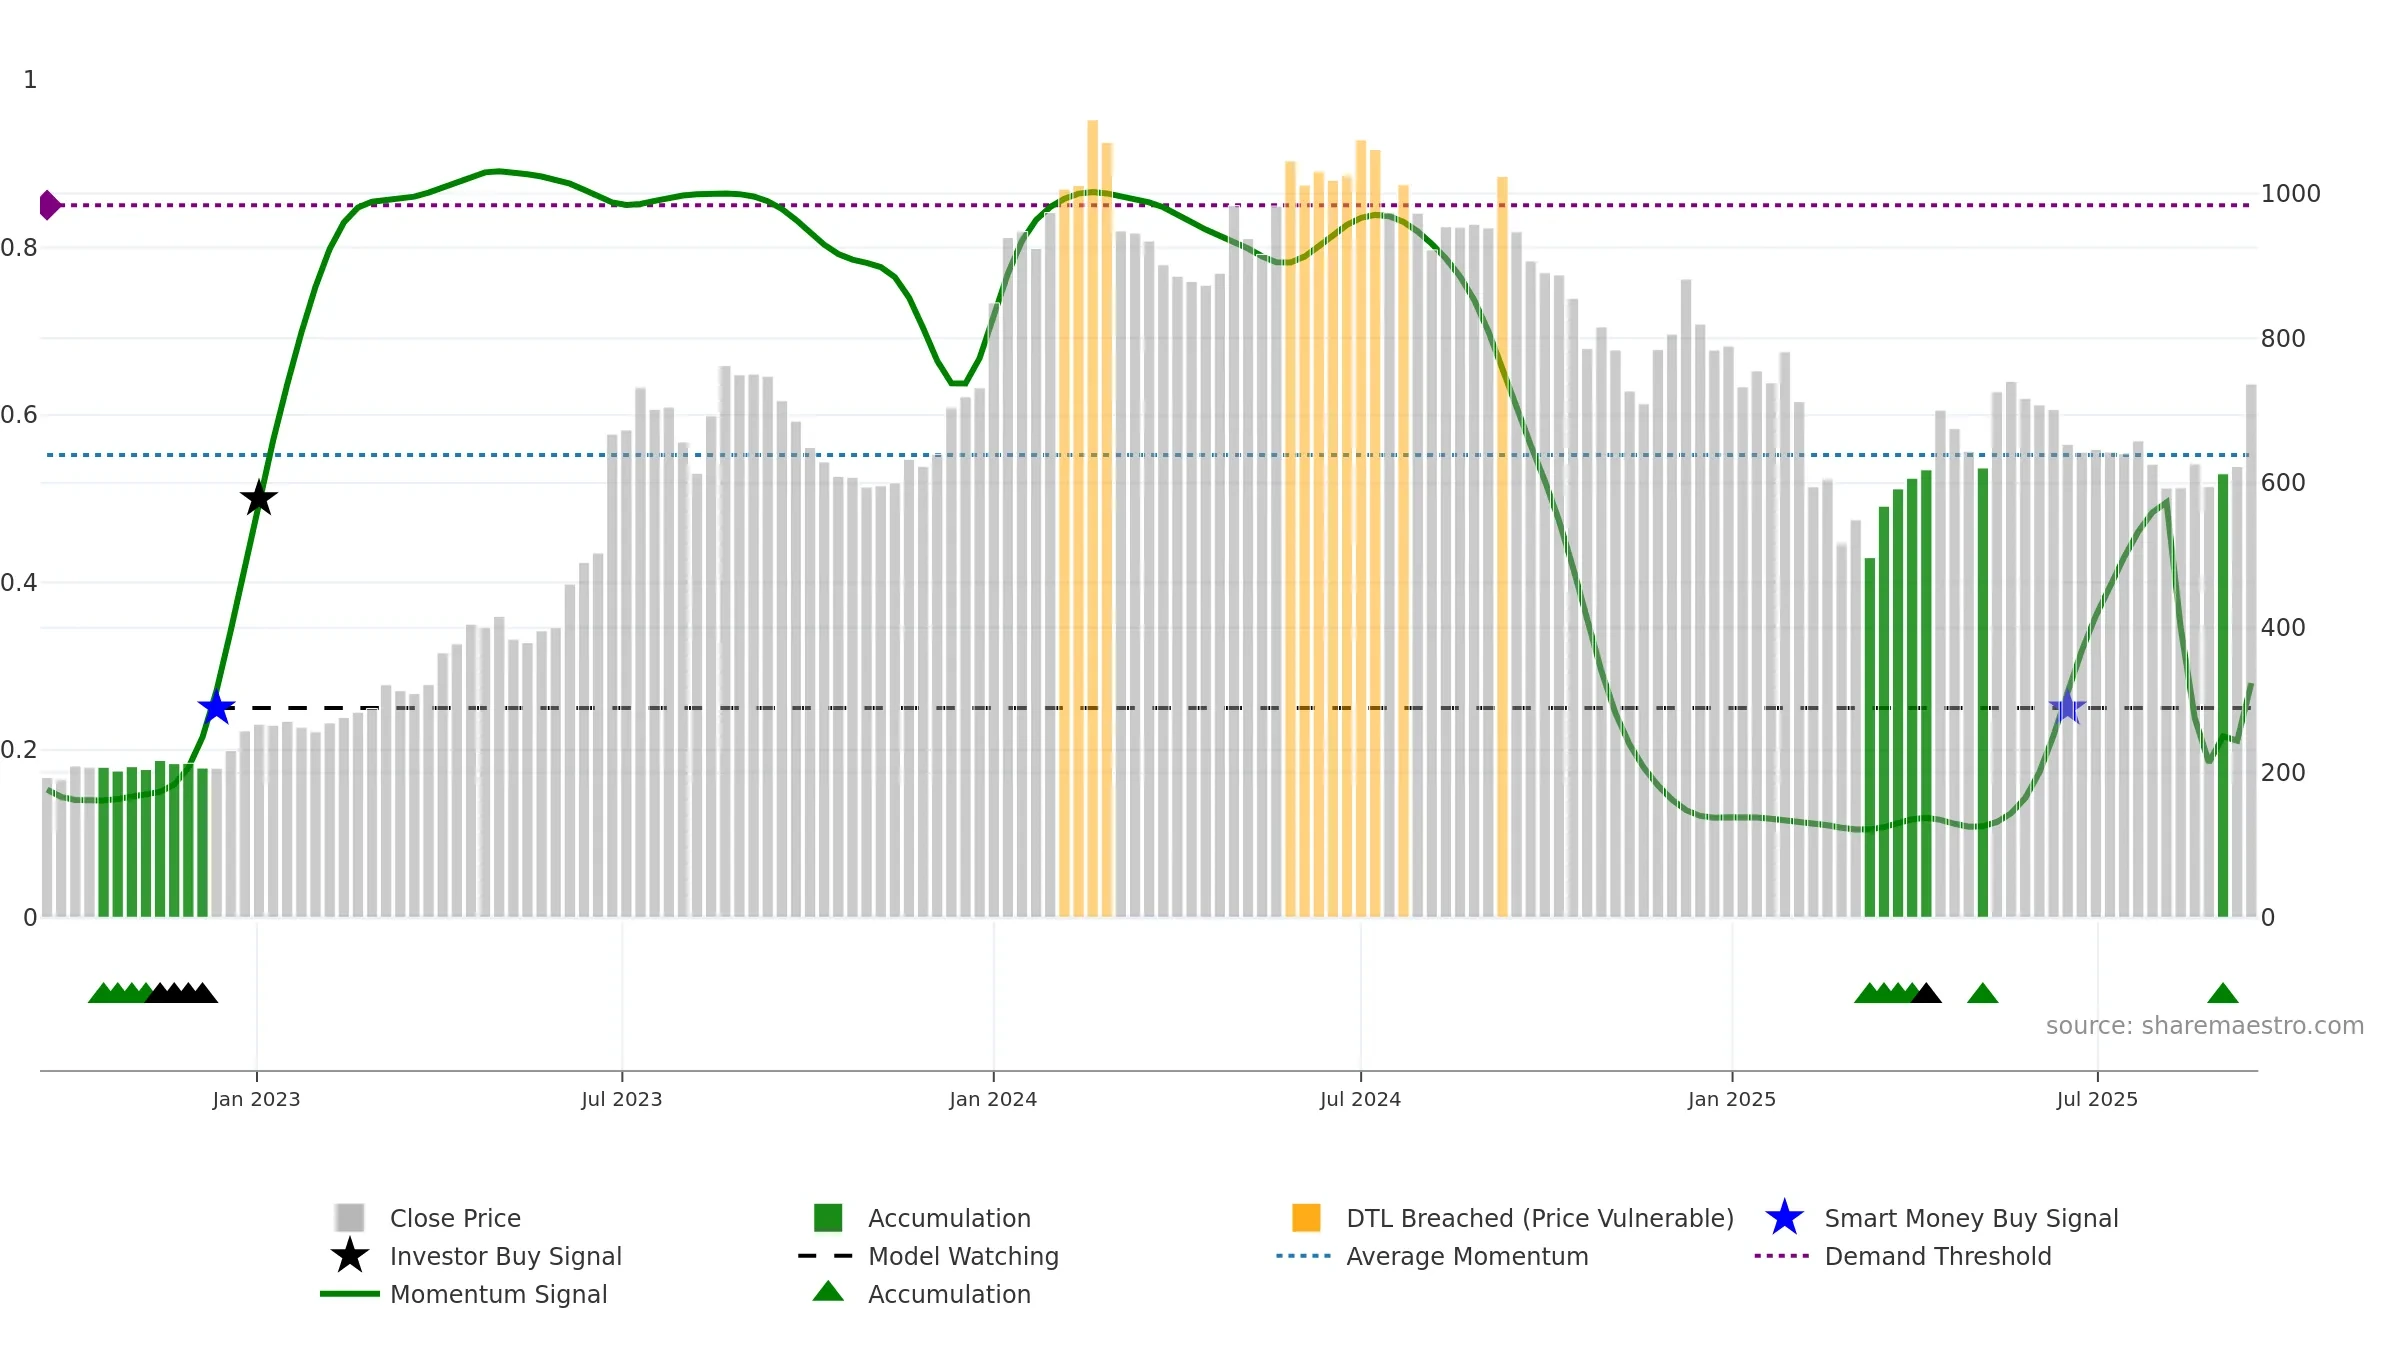
Weekly Report
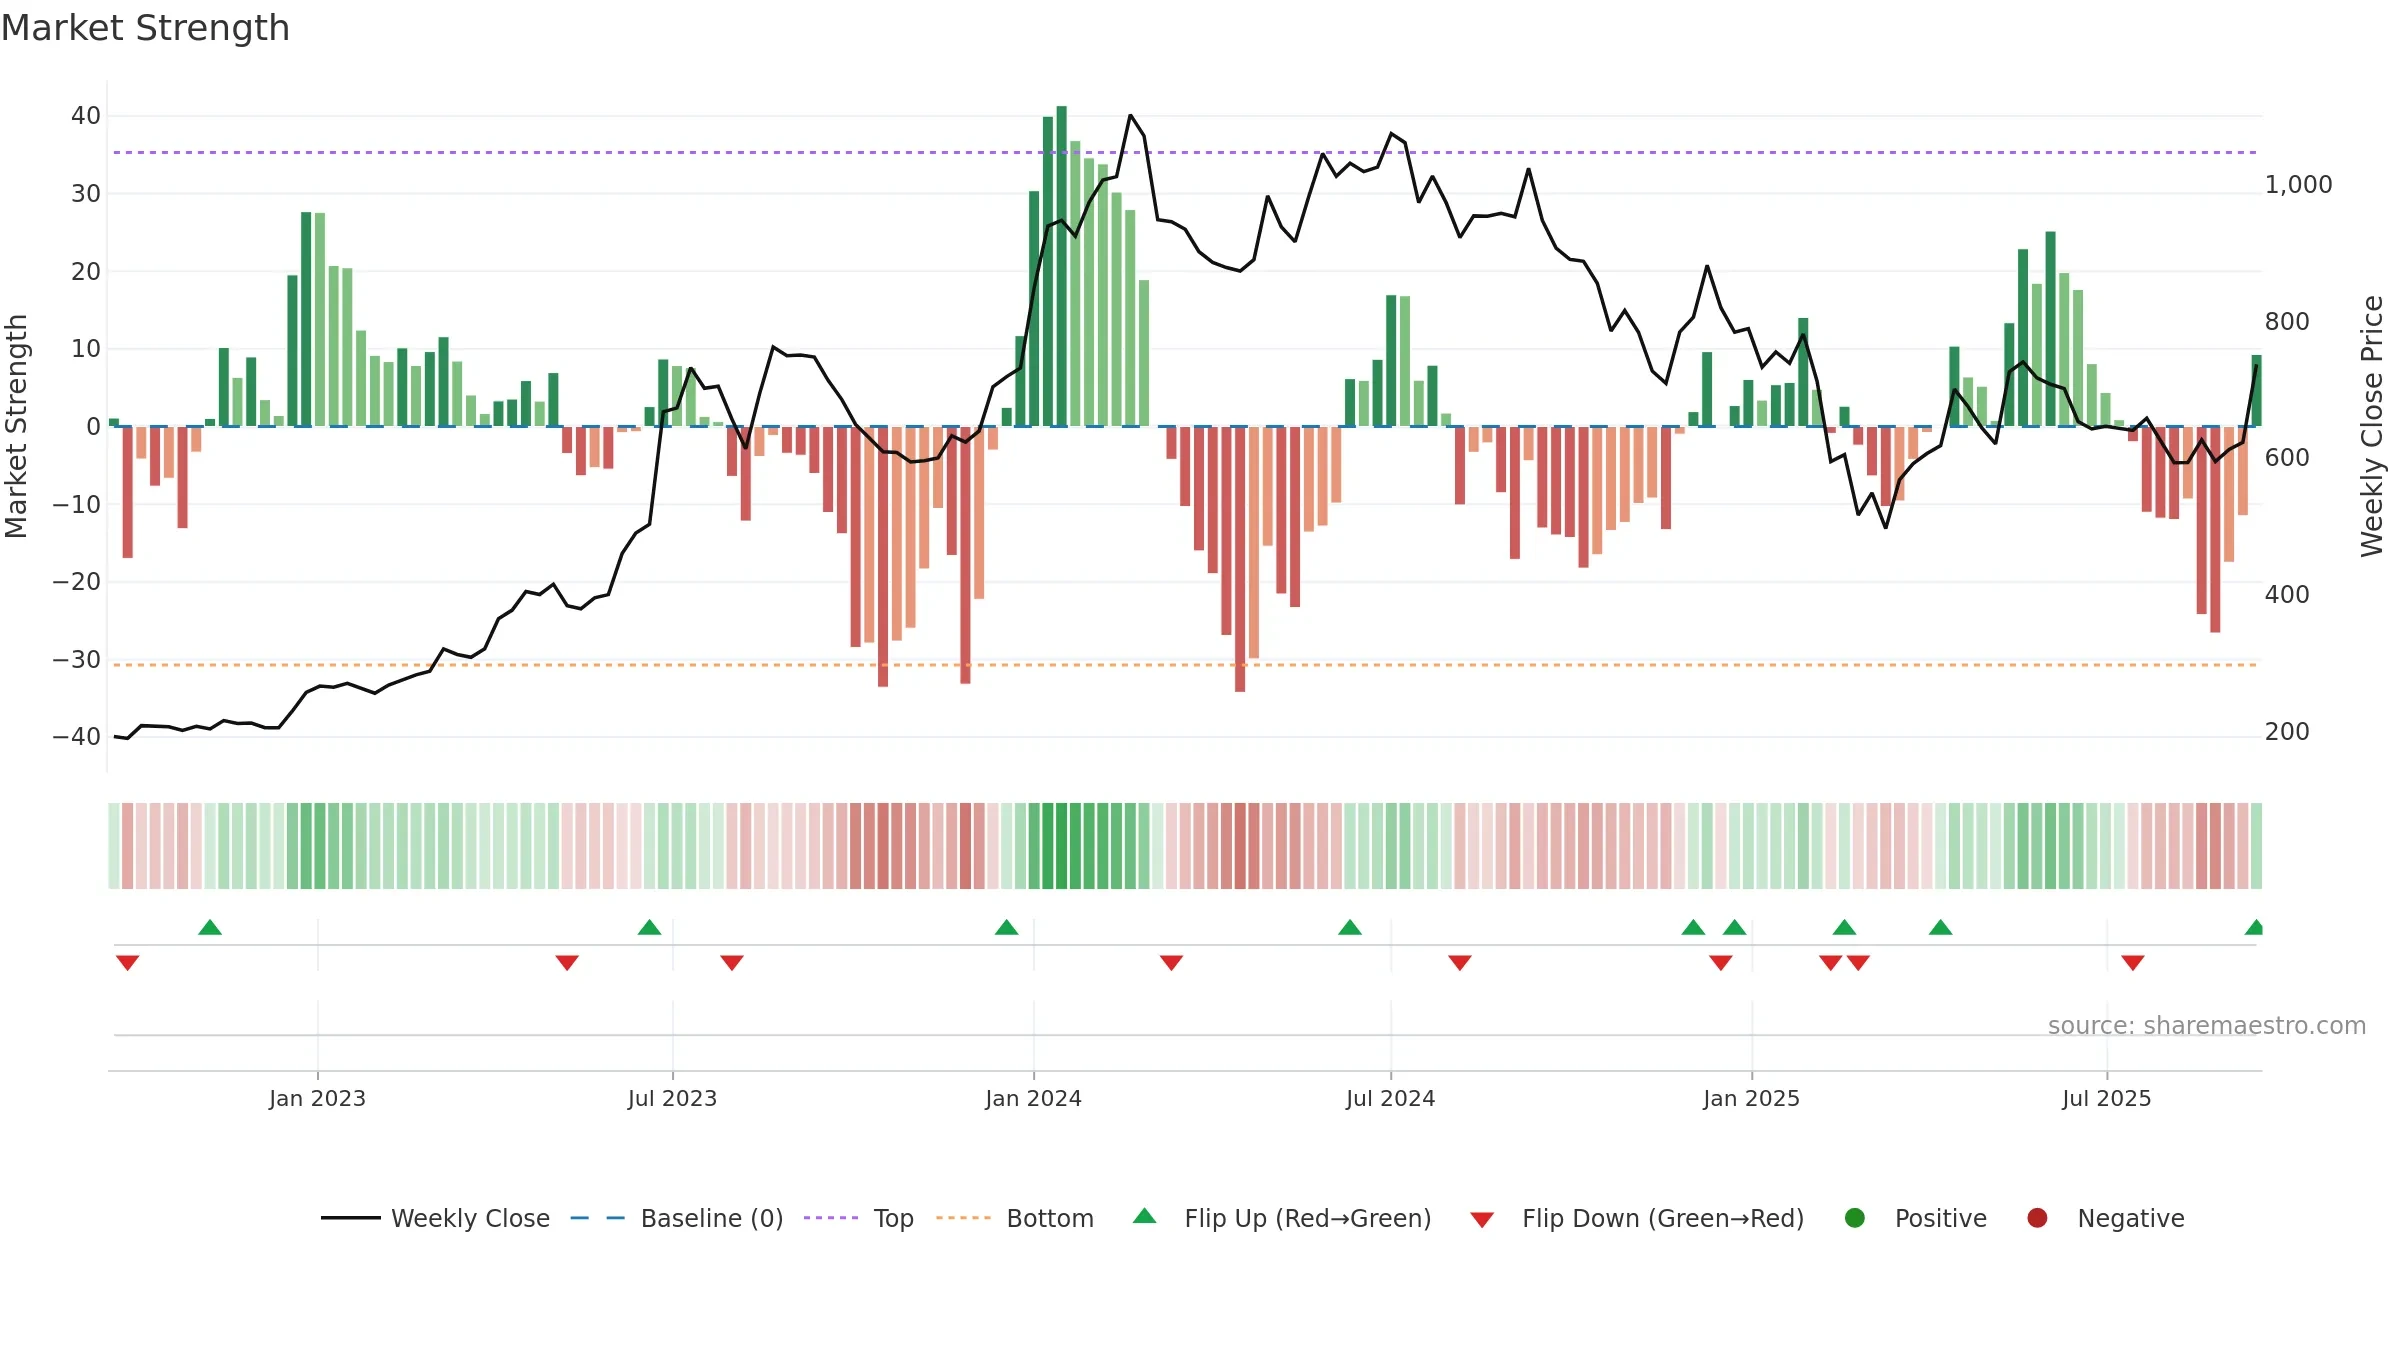
JBM Auto Limited closed at 736.7500 (3.04% WoW) . Data window ends Mon, 15 Sep 2025.
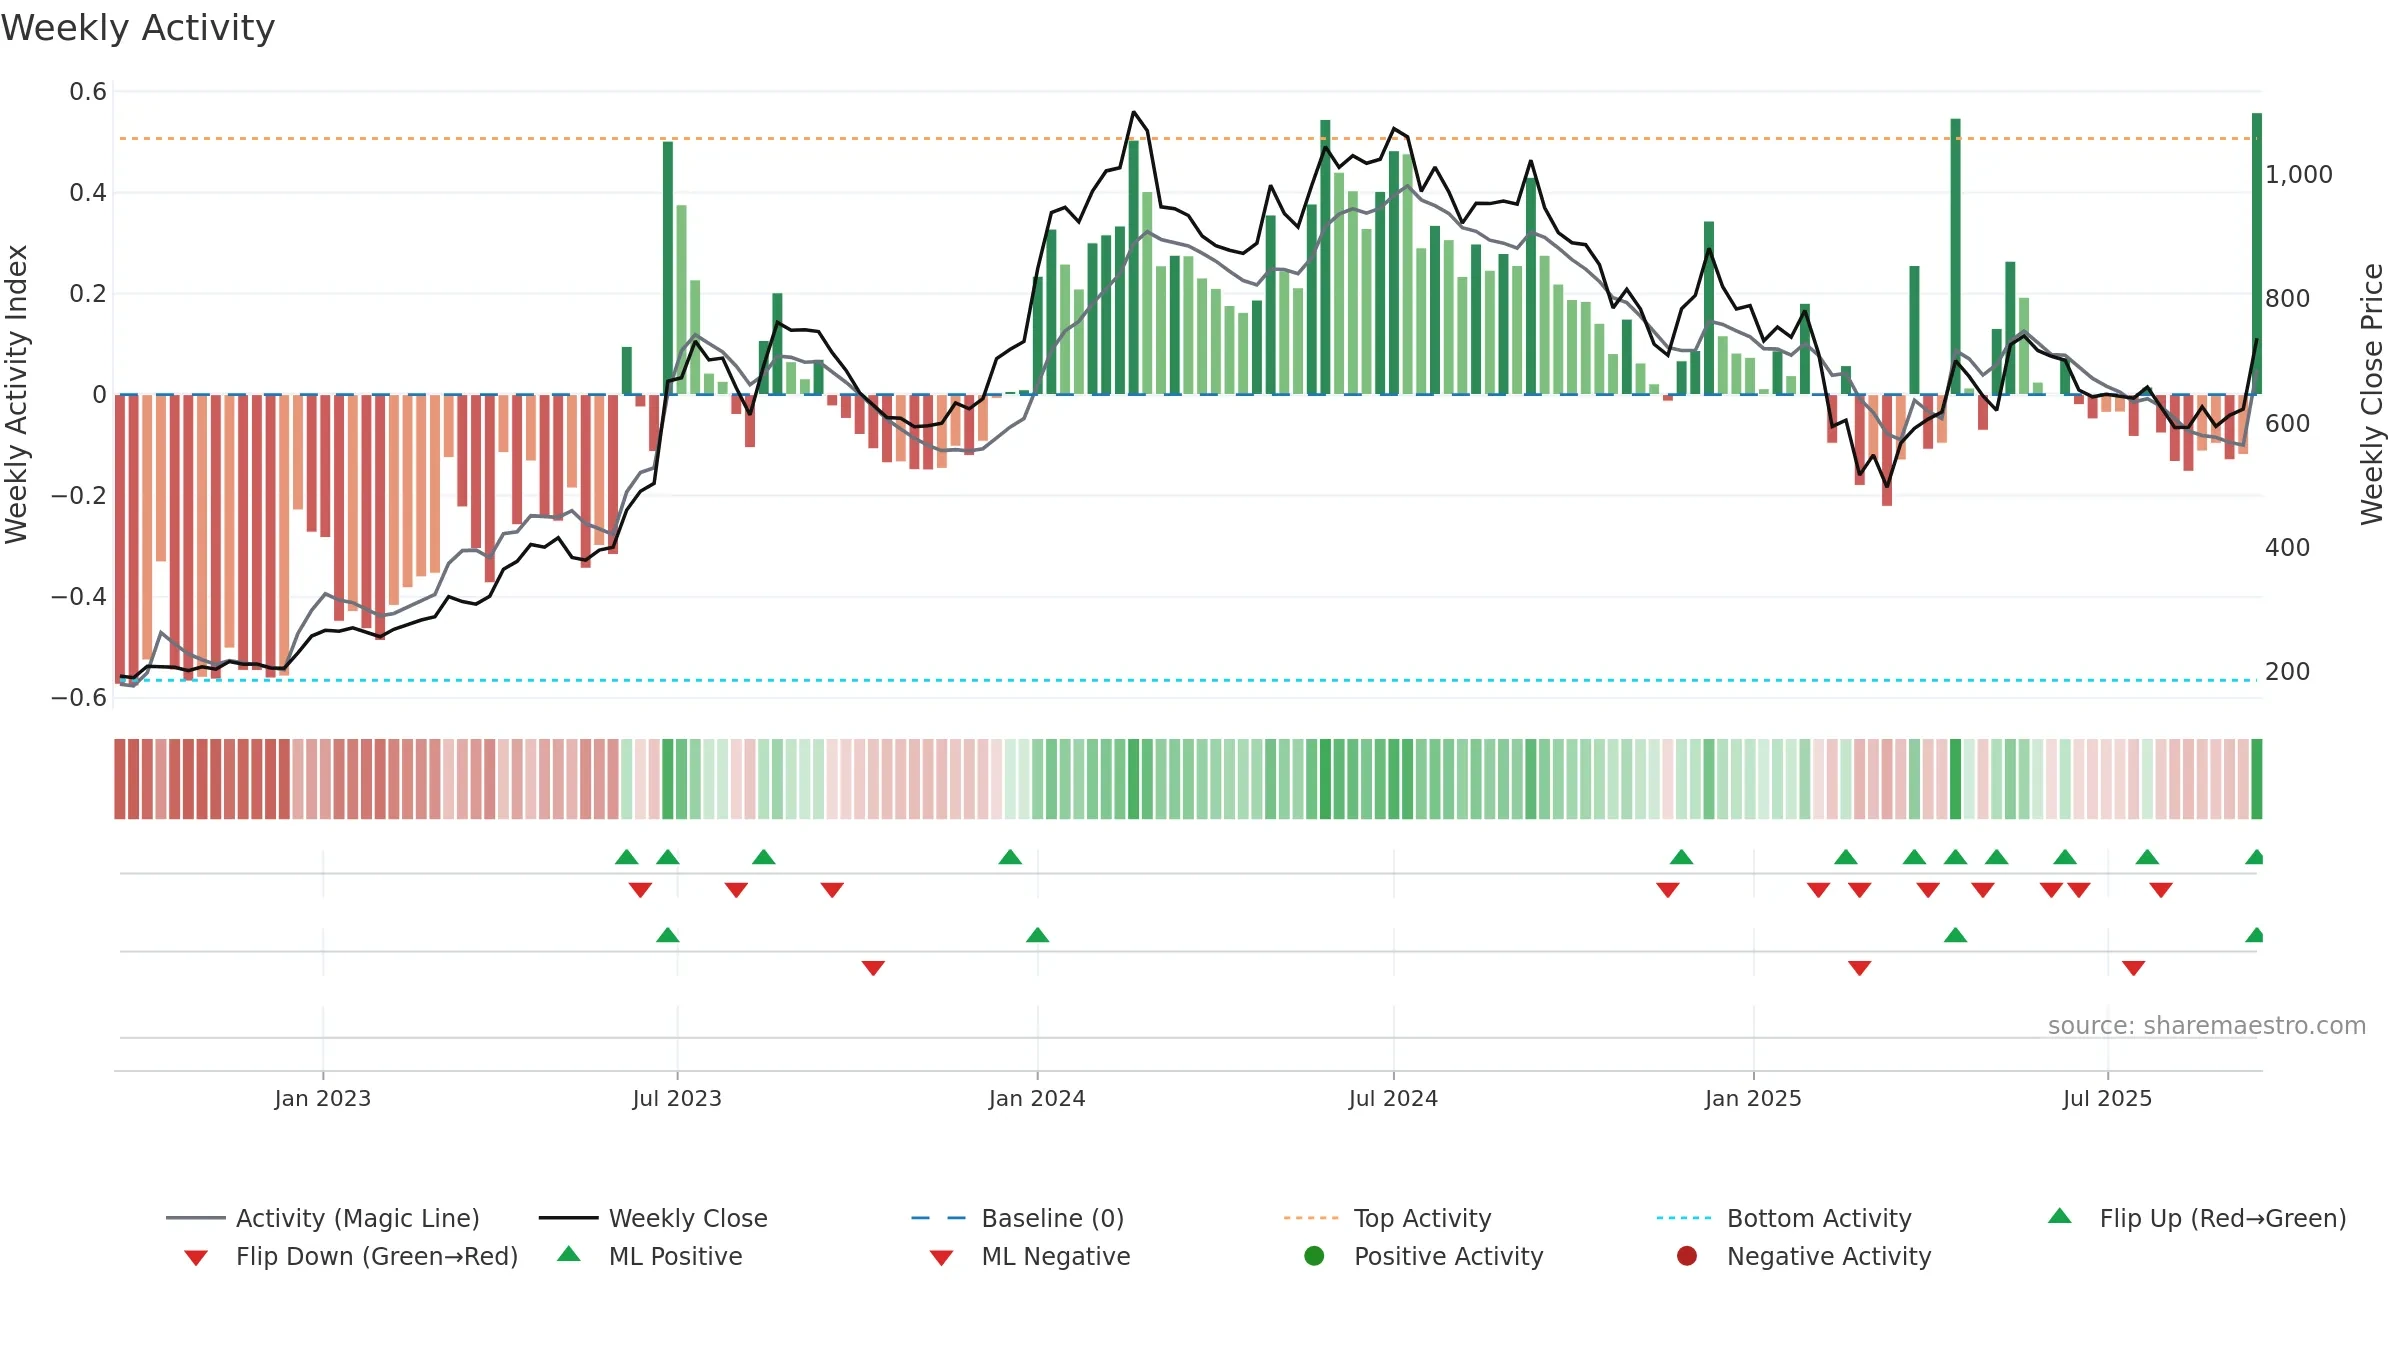
How to read this — Price slope is upward, indicating persistent buying over the window. Volume and price are moving in the same direction — a constructive confirmation. Returns are positively correlated with volume — strength tends to arrive on higher activity. Distance to baseline is narrowing — reverting closer to its fair-value track. Fresh short-term crossover improves near-term tone. Price holds above key averages, indicating constructive participation.
Up-slope supports buying interest; pullbacks may be contained if activity stays firm.
Gauge maps the trend signal to a 0–100 scale.
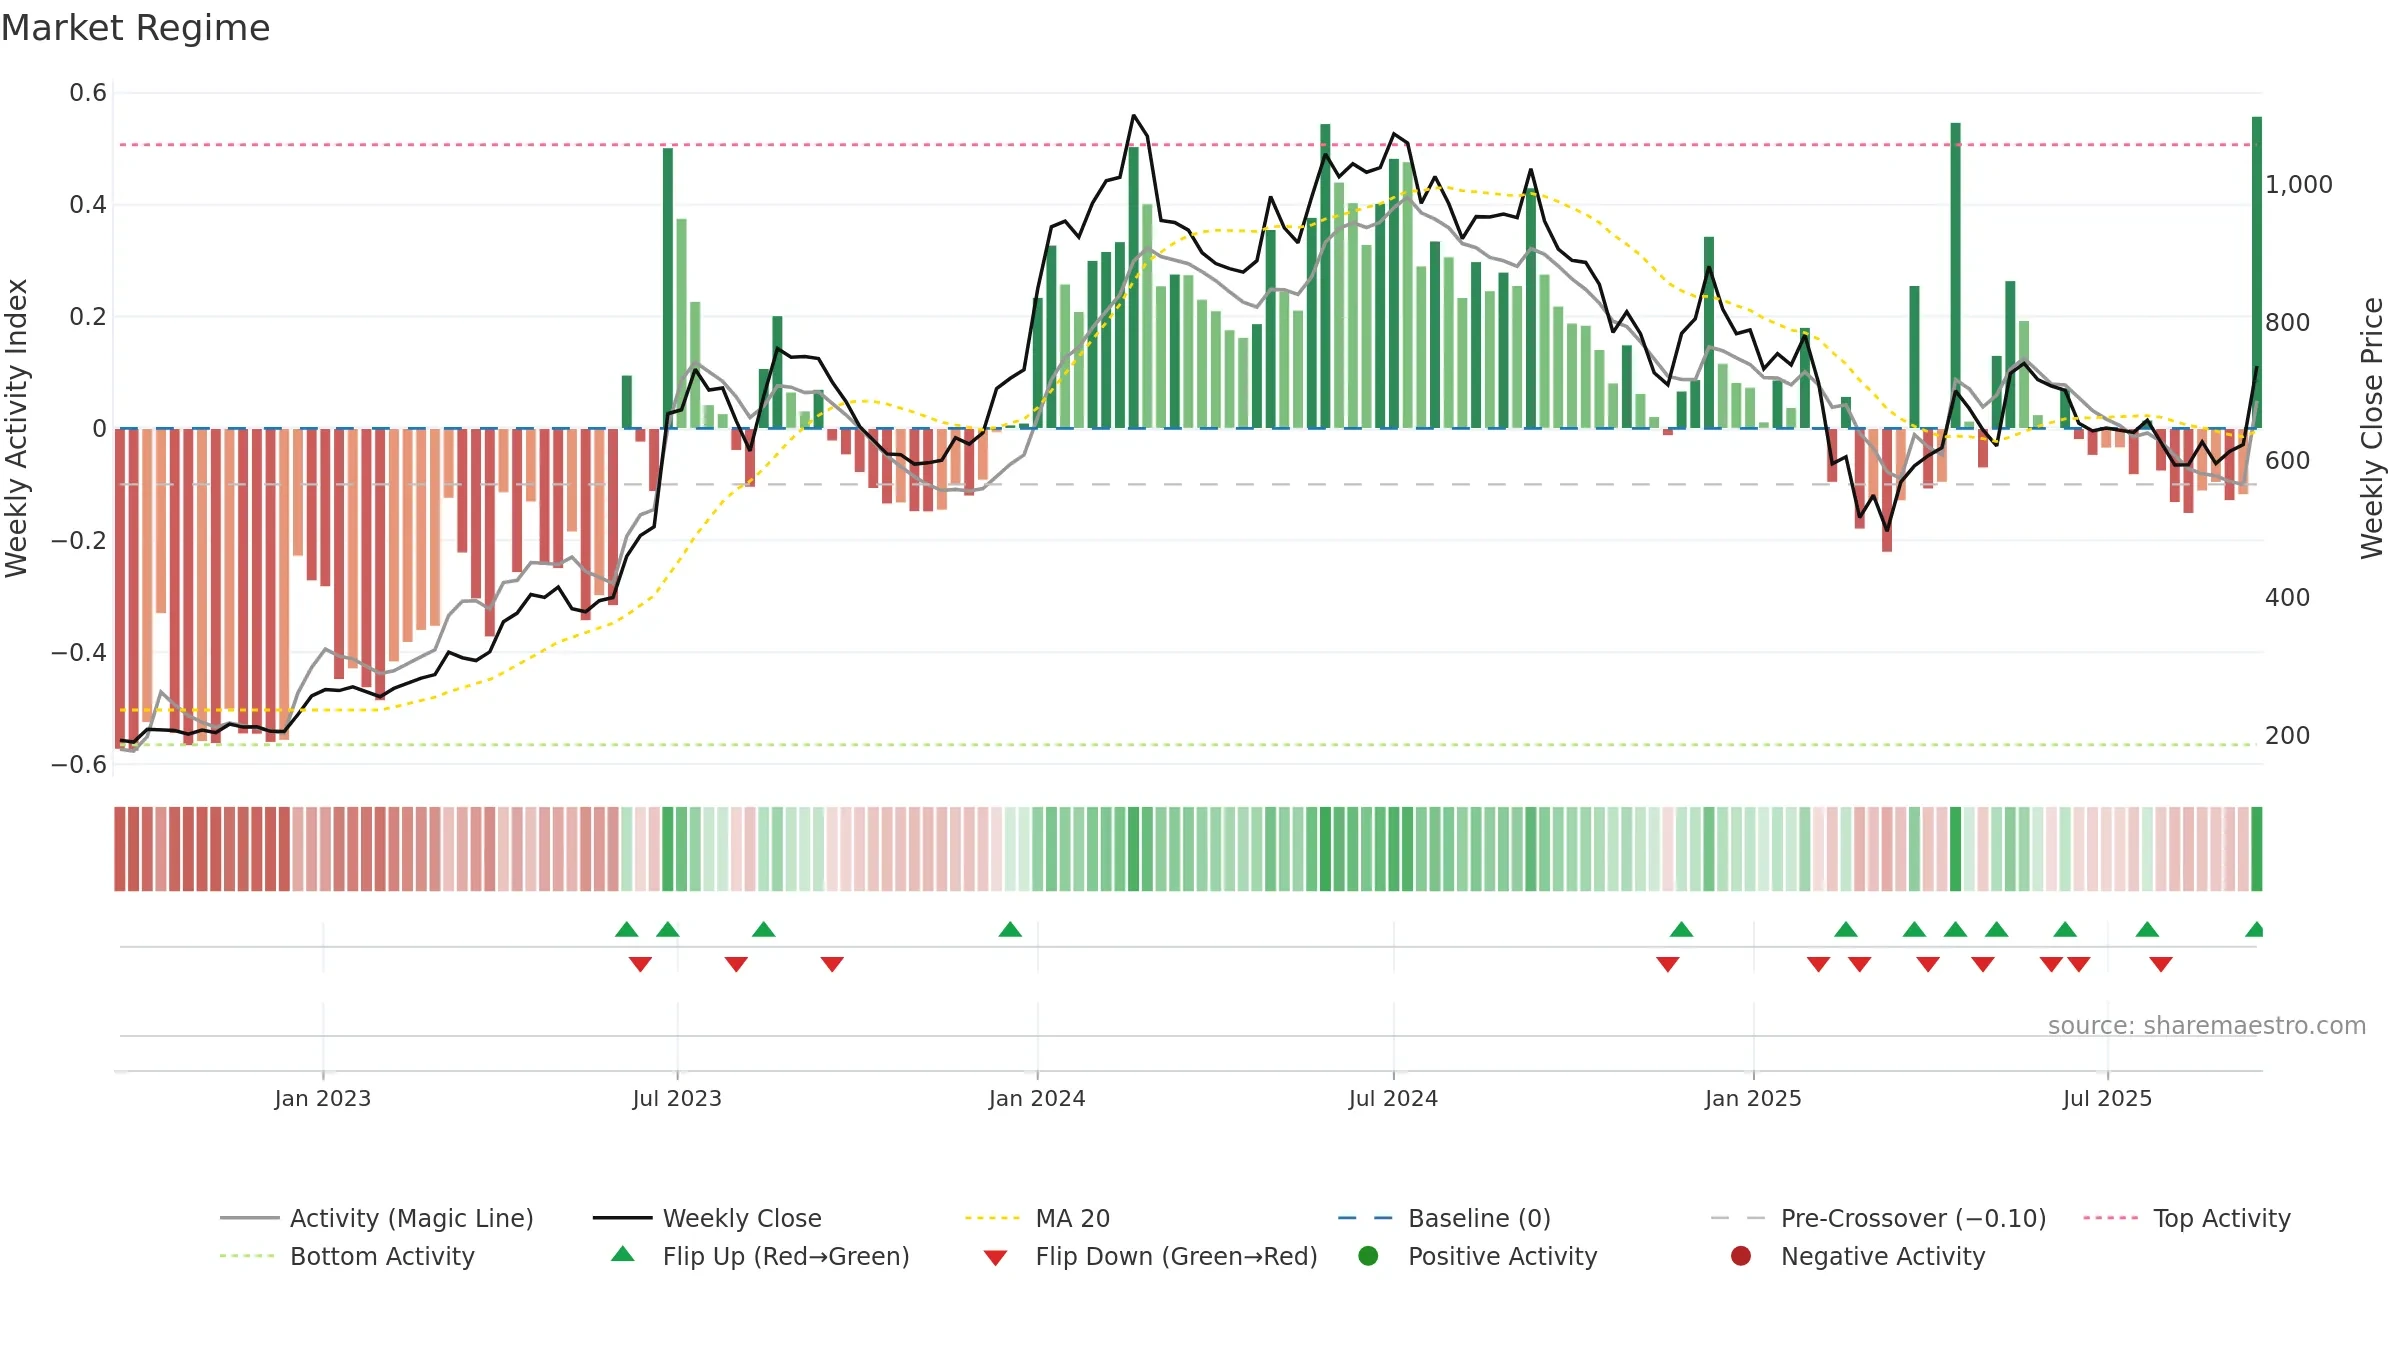
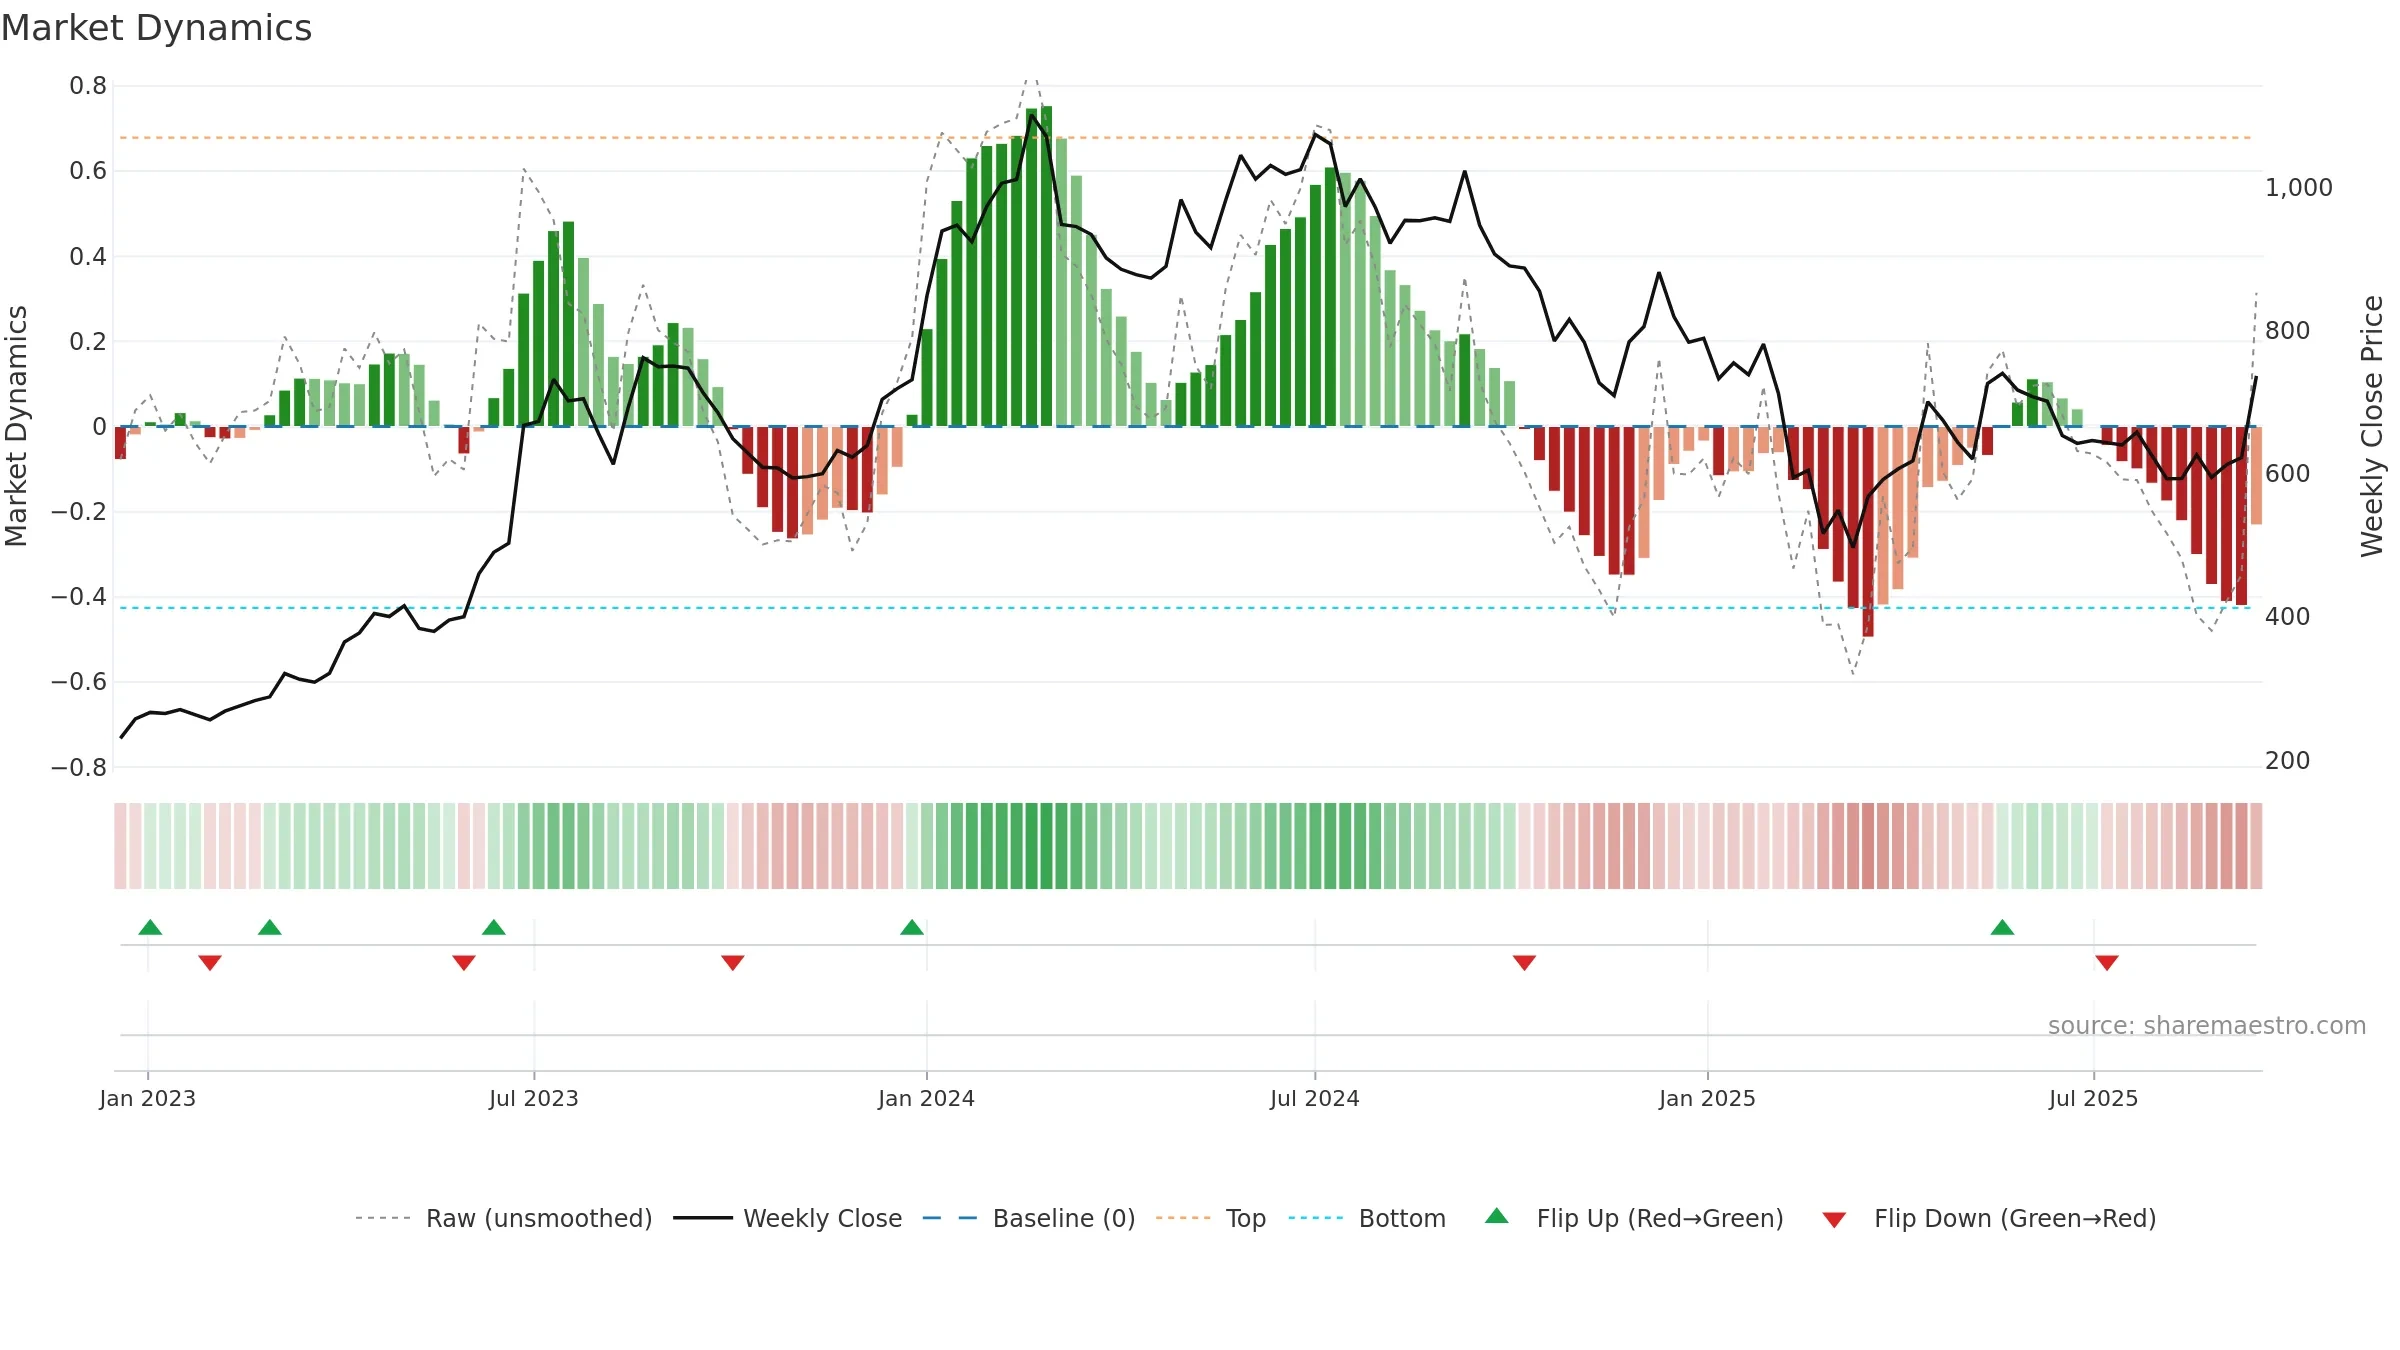
How to read this — Bearish backdrop but short-term momentum is improving; confirmation still needed.
Early improvement — look for a reclaim of 0.50→0.60 to validate.
Price is below fair value; potential upside if momentum constructive.
Conclusion
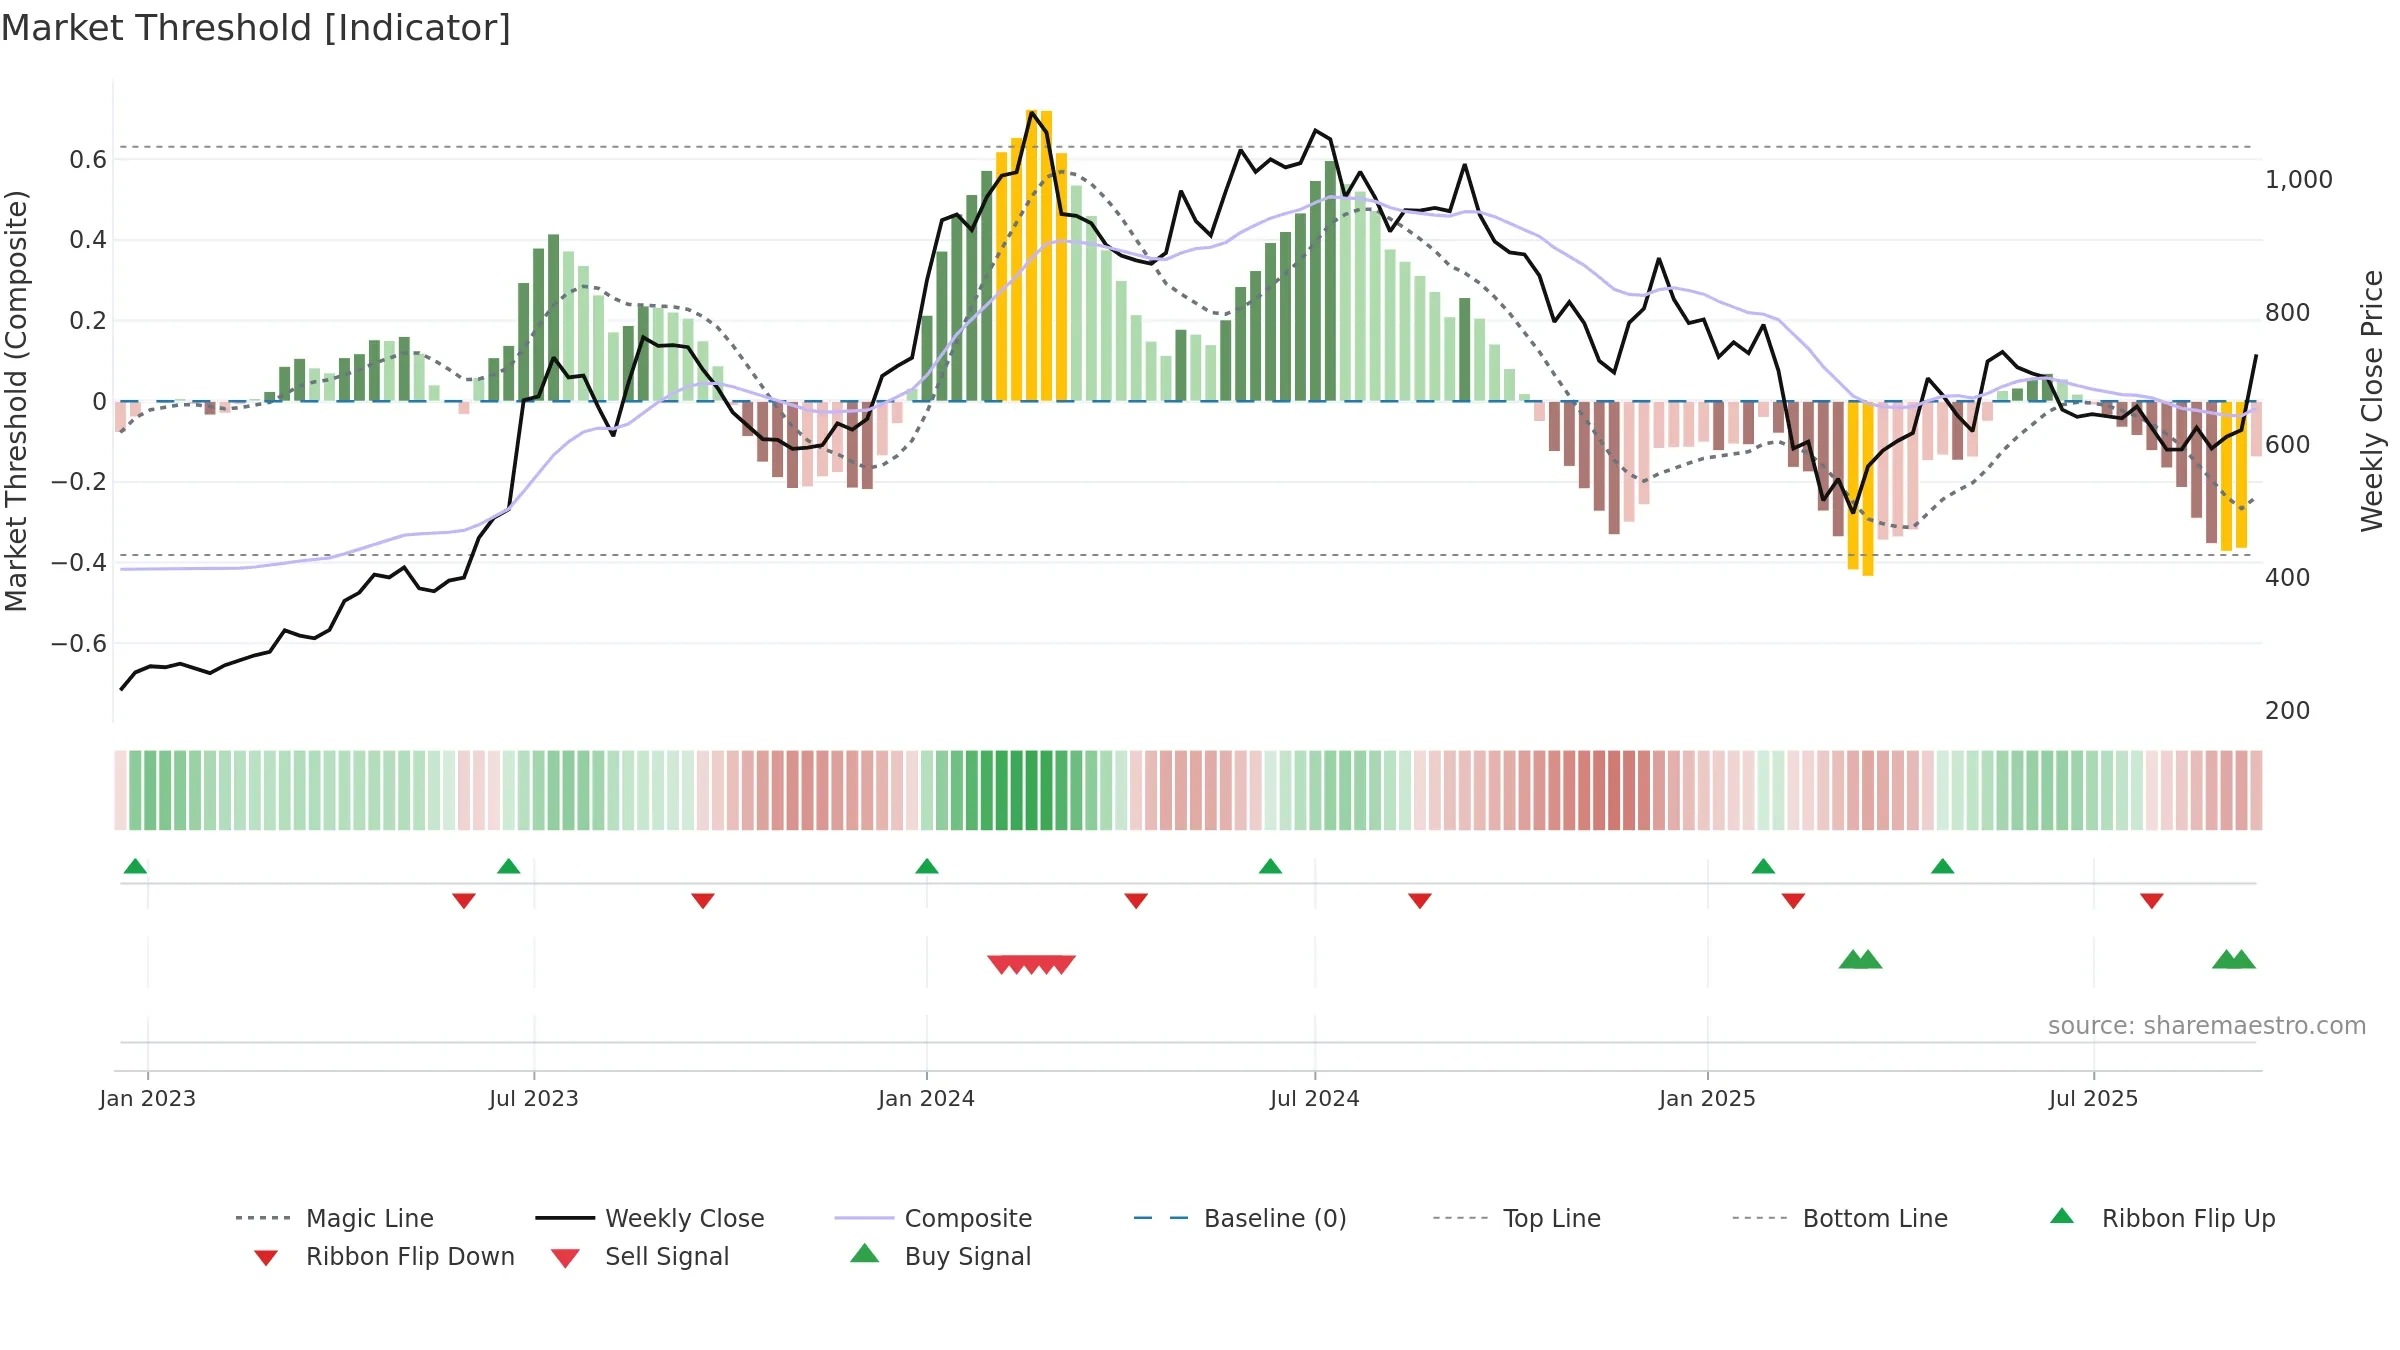
Neutral setup. ★★★☆☆ confidence. Price window: 17. Trend: Bottoming Attempt; gauge 28. In combination, liquidity confirms the move.
- Early improvement from bearish zone (bottoming attempt)
- Price holds above 8w & 26w averages
- Liquidity confirms the price trend
- Solid multi-week performance
- Momentum is weak/falling
Why: Price window 17.69% over 8w. Close is 17.60% above the prior-window high. Volume trend rising. Liquidity convergence with price. Trend state bottoming attempt. Low-regime (≤0.25) upticks 2/4 (50.0%) • Distributing. 4–8w crossover bullish. Momentum bearish and falling. Valuation supportive skew.
Tip: Most metrics include a hover tooltip where they appear in the report.