The Macerich Company
MAC NYSE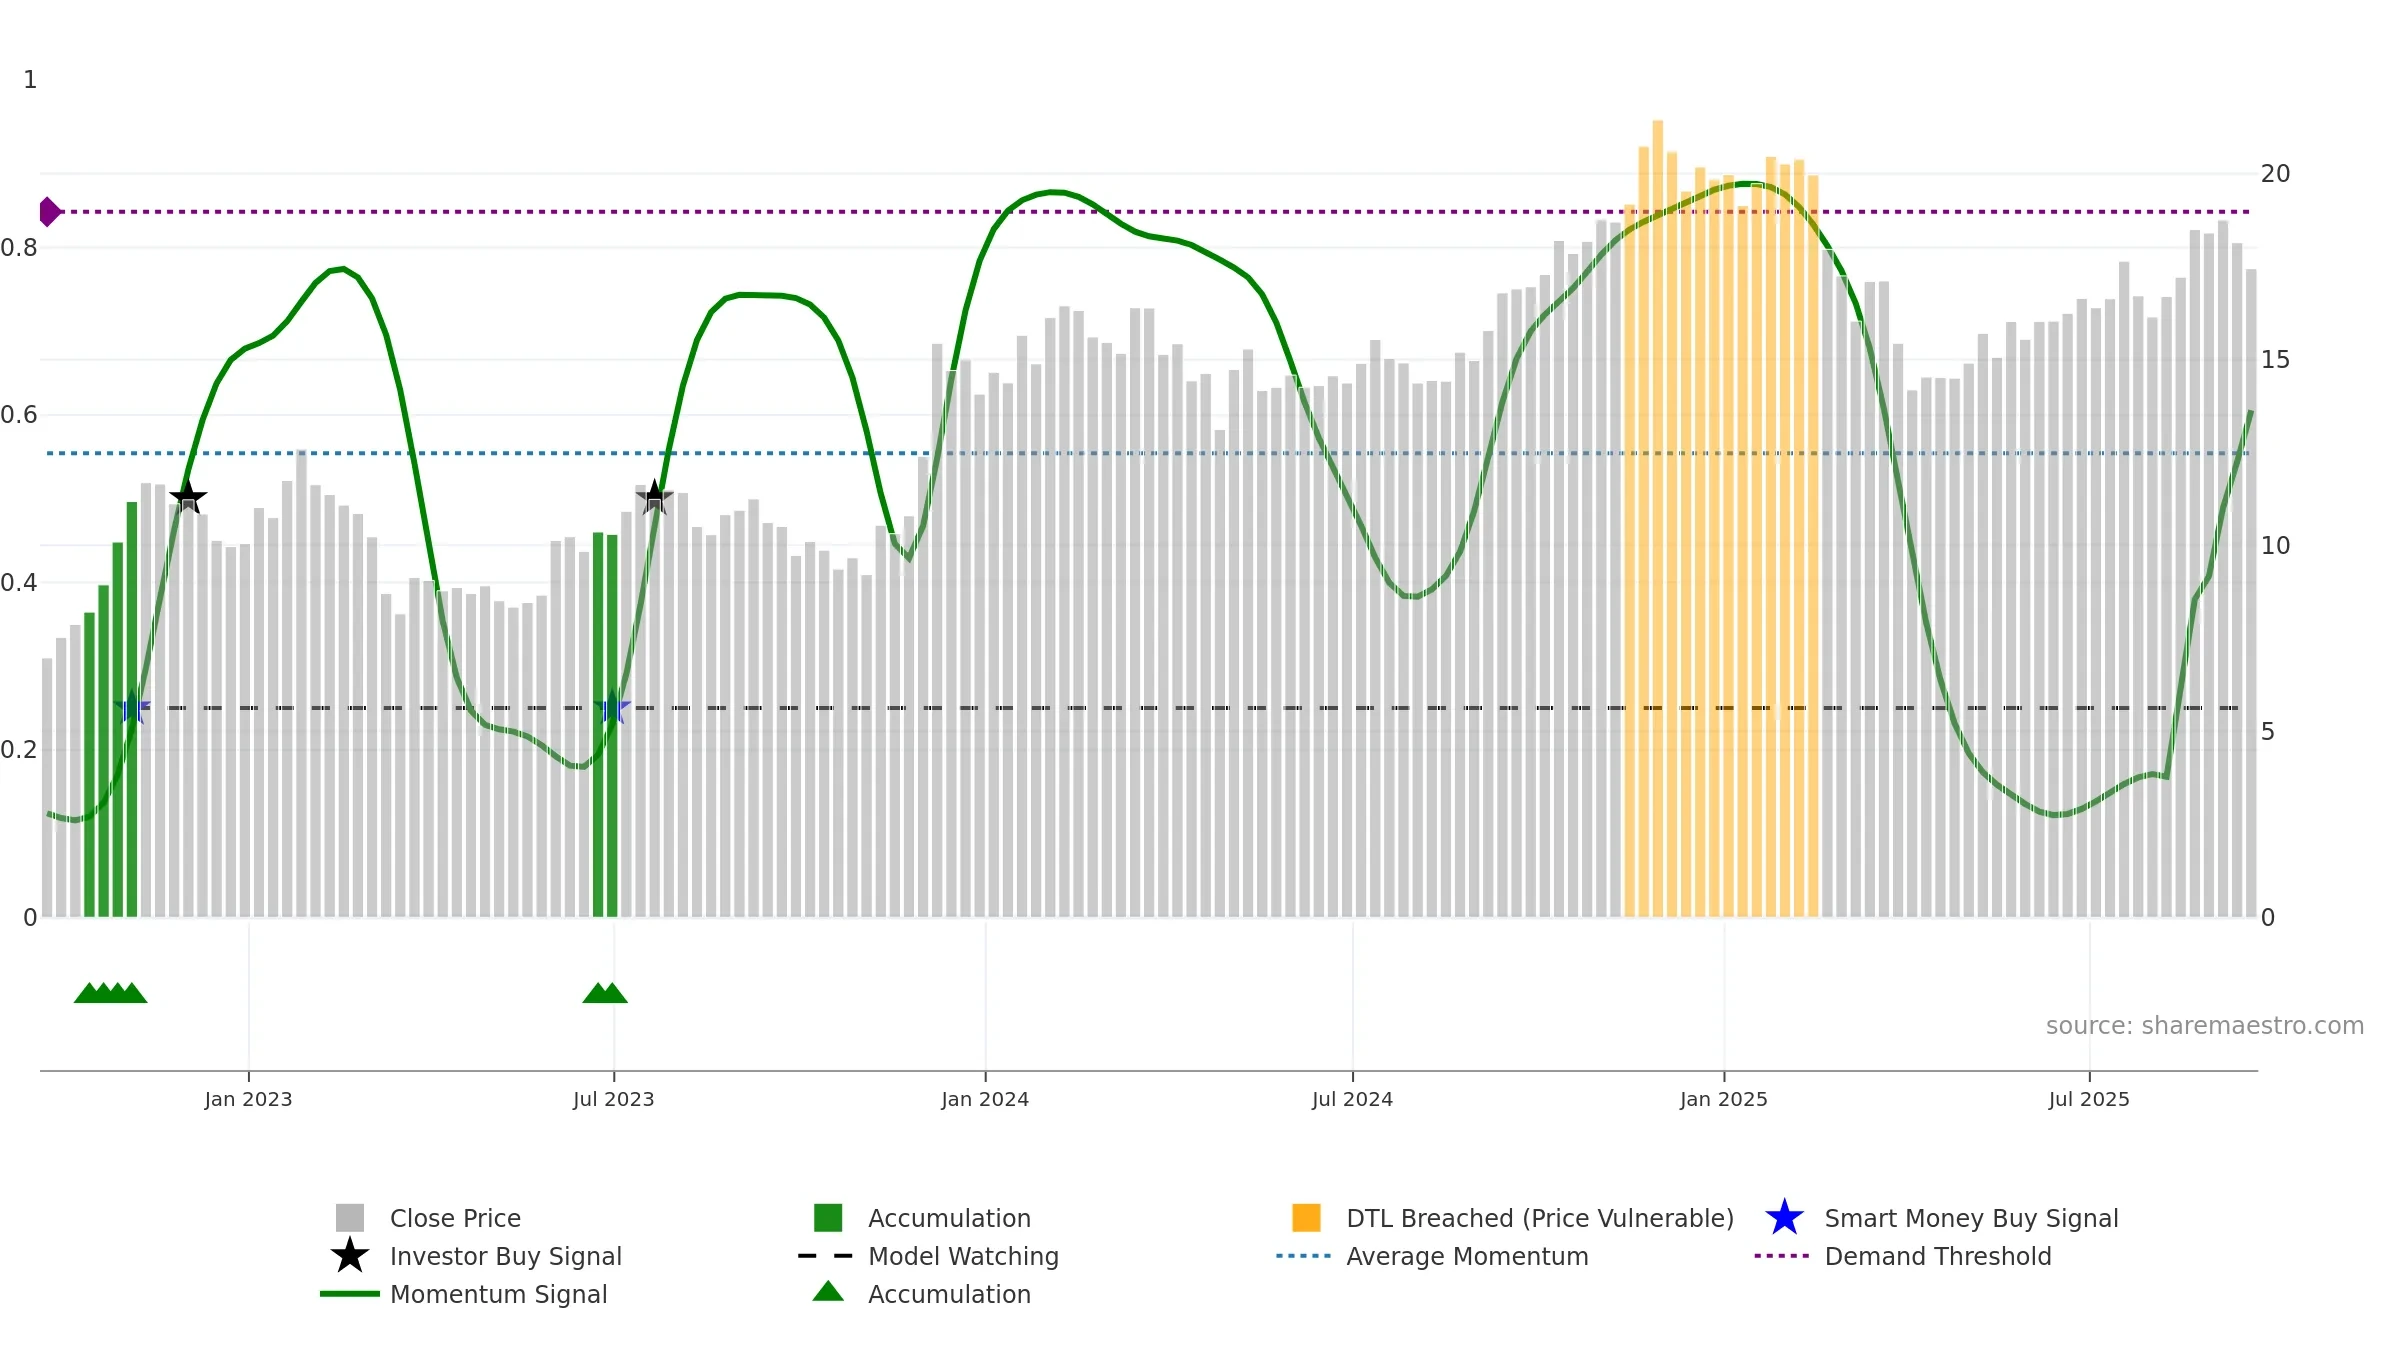
Weekly Report
The Macerich Company closed at 17.4400 (-0.80% WoW) . Data window ends Fri, 19 Sep 2025.
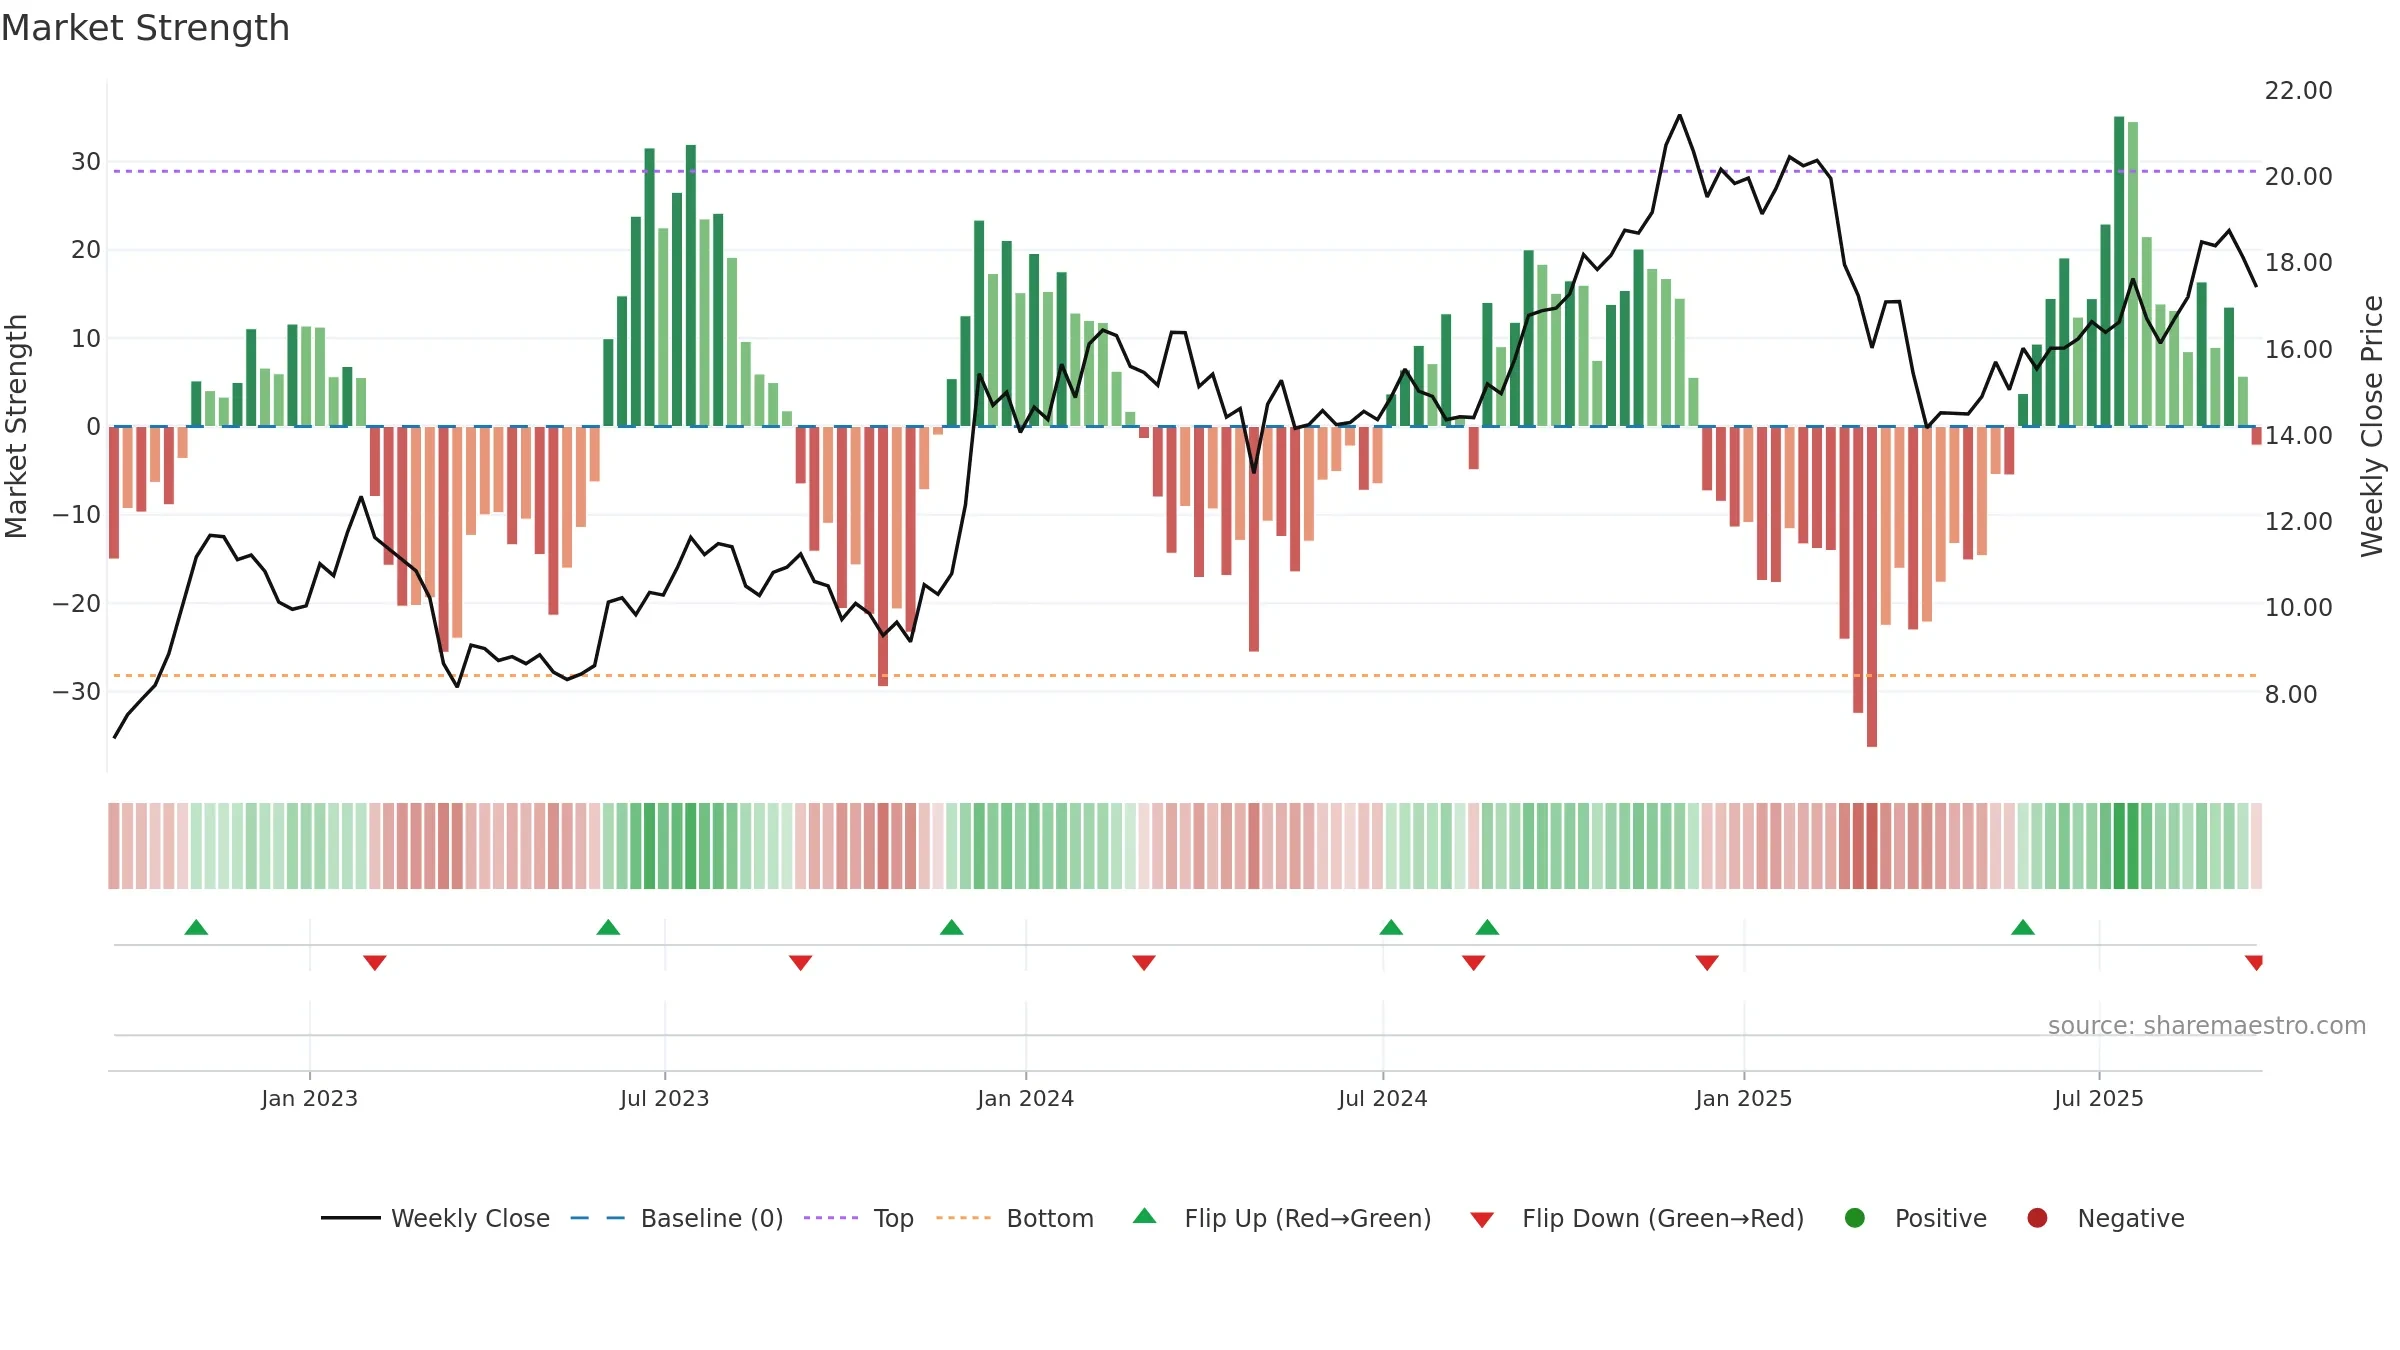
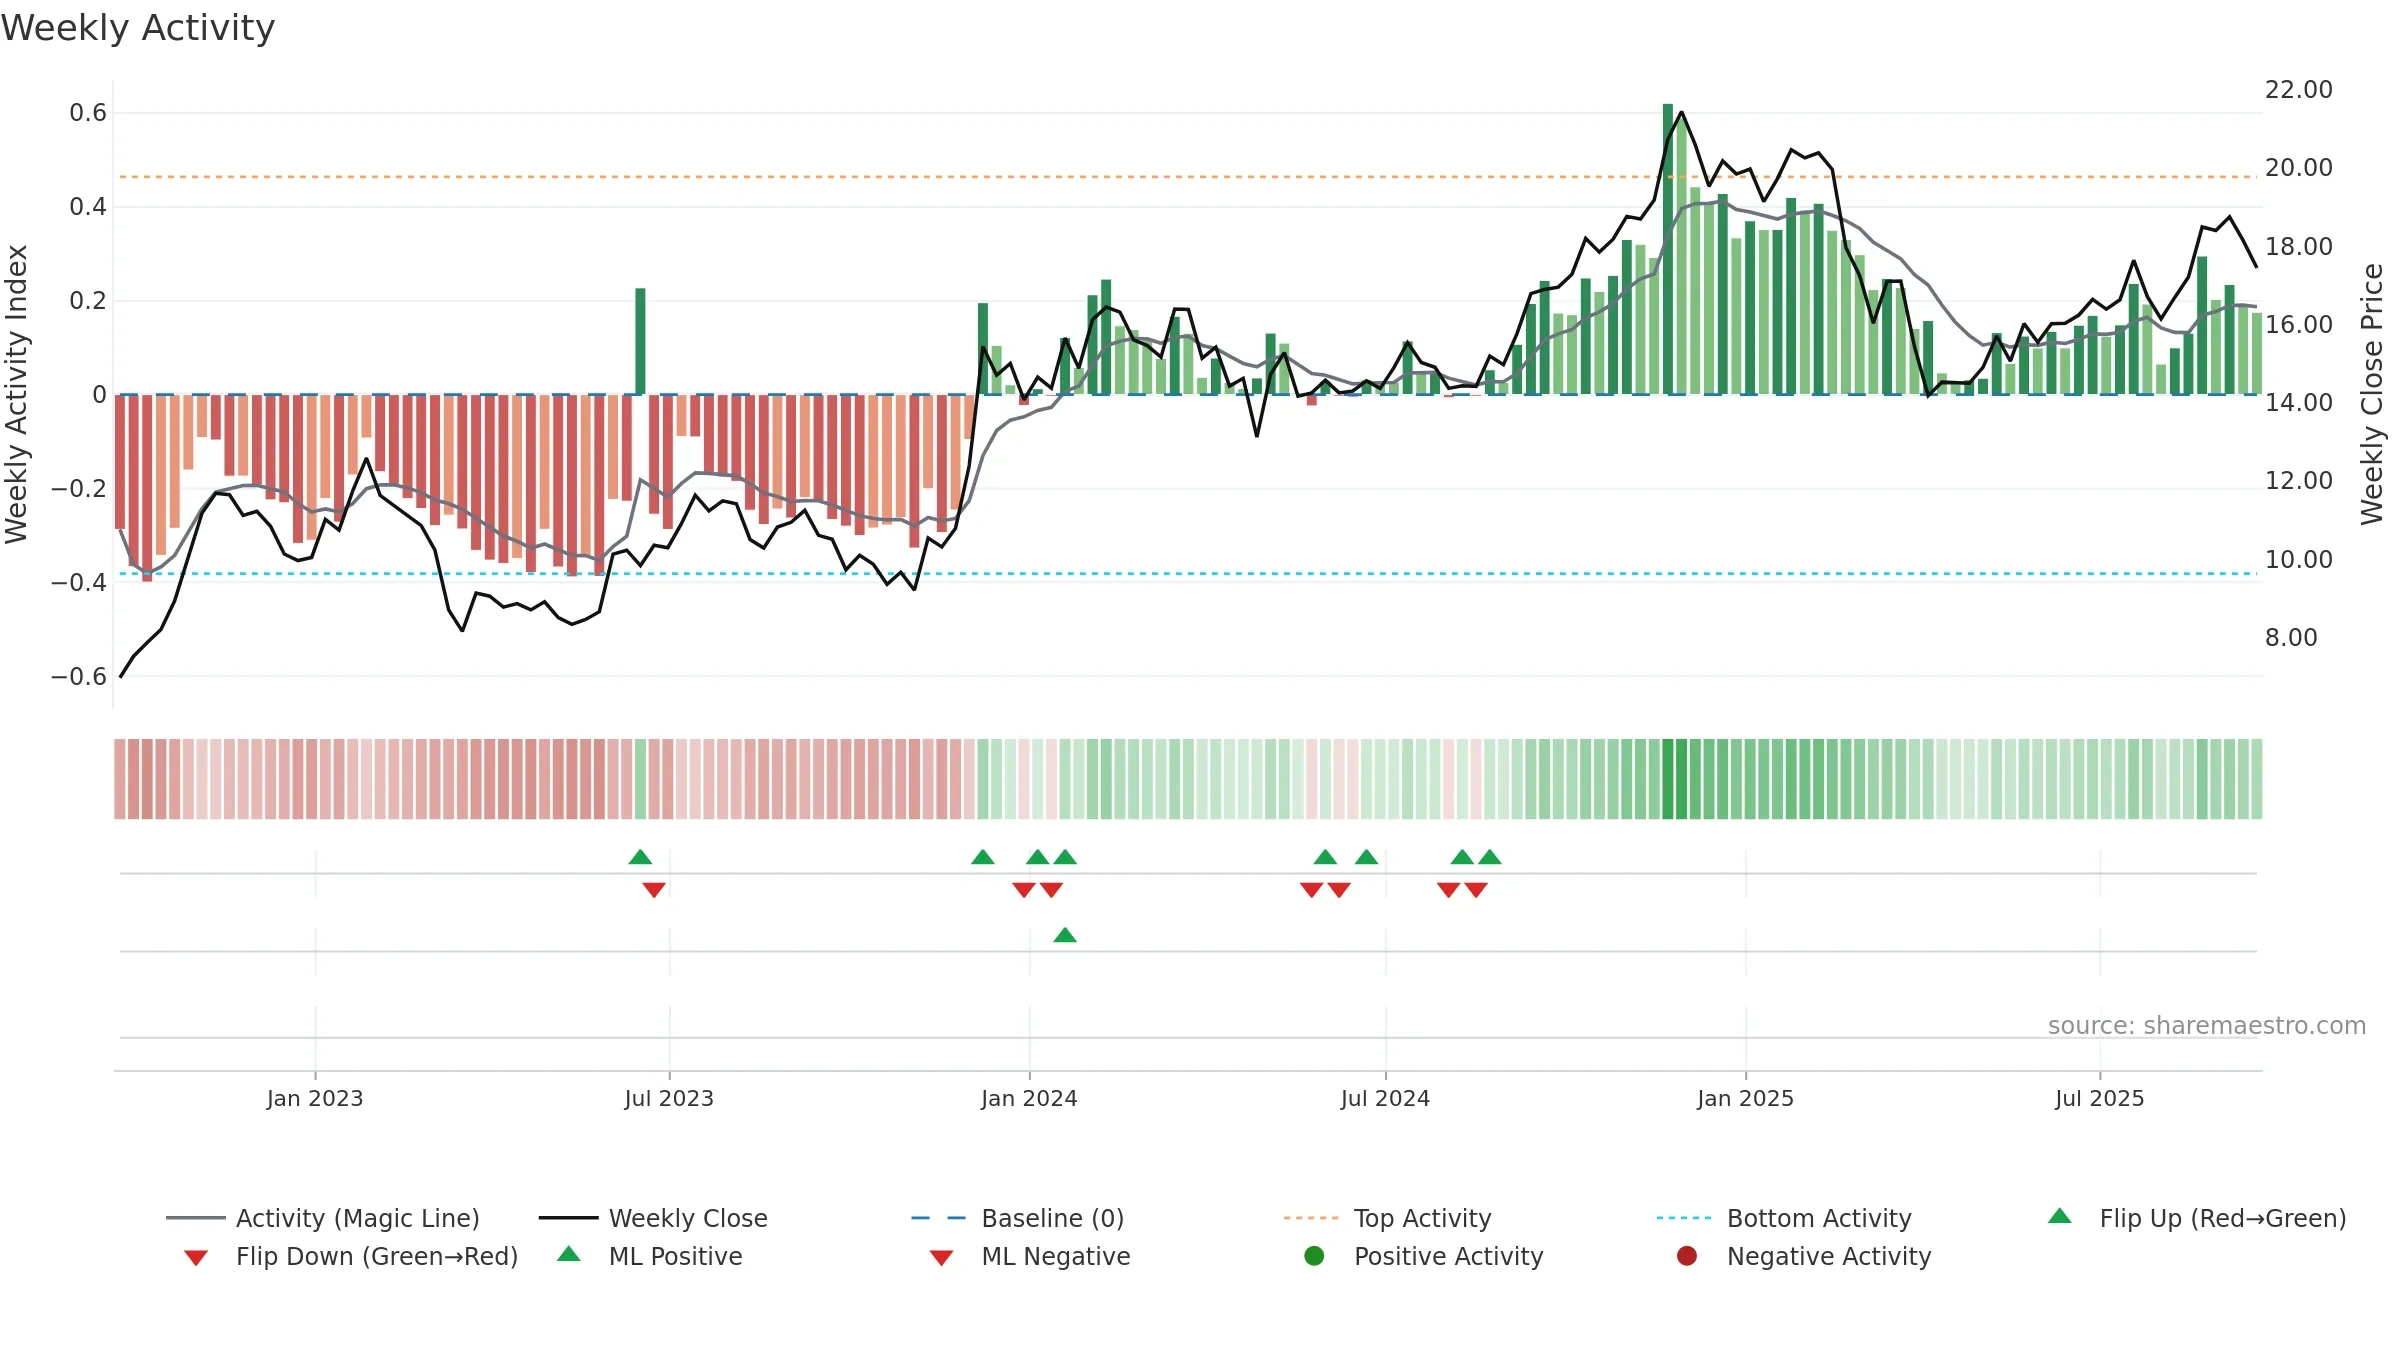
How to read this — Price slope is upward, indicating persistent buying over the window. Volume and price are moving in the same direction — a constructive confirmation. Returns are positively correlated with volume — strength tends to arrive on higher activity. Constructive MA stack supports the up-drift; pullbacks may find support at the 8–13 week region.
Up-slope supports buying interest; pullbacks may be contained if activity stays firm.
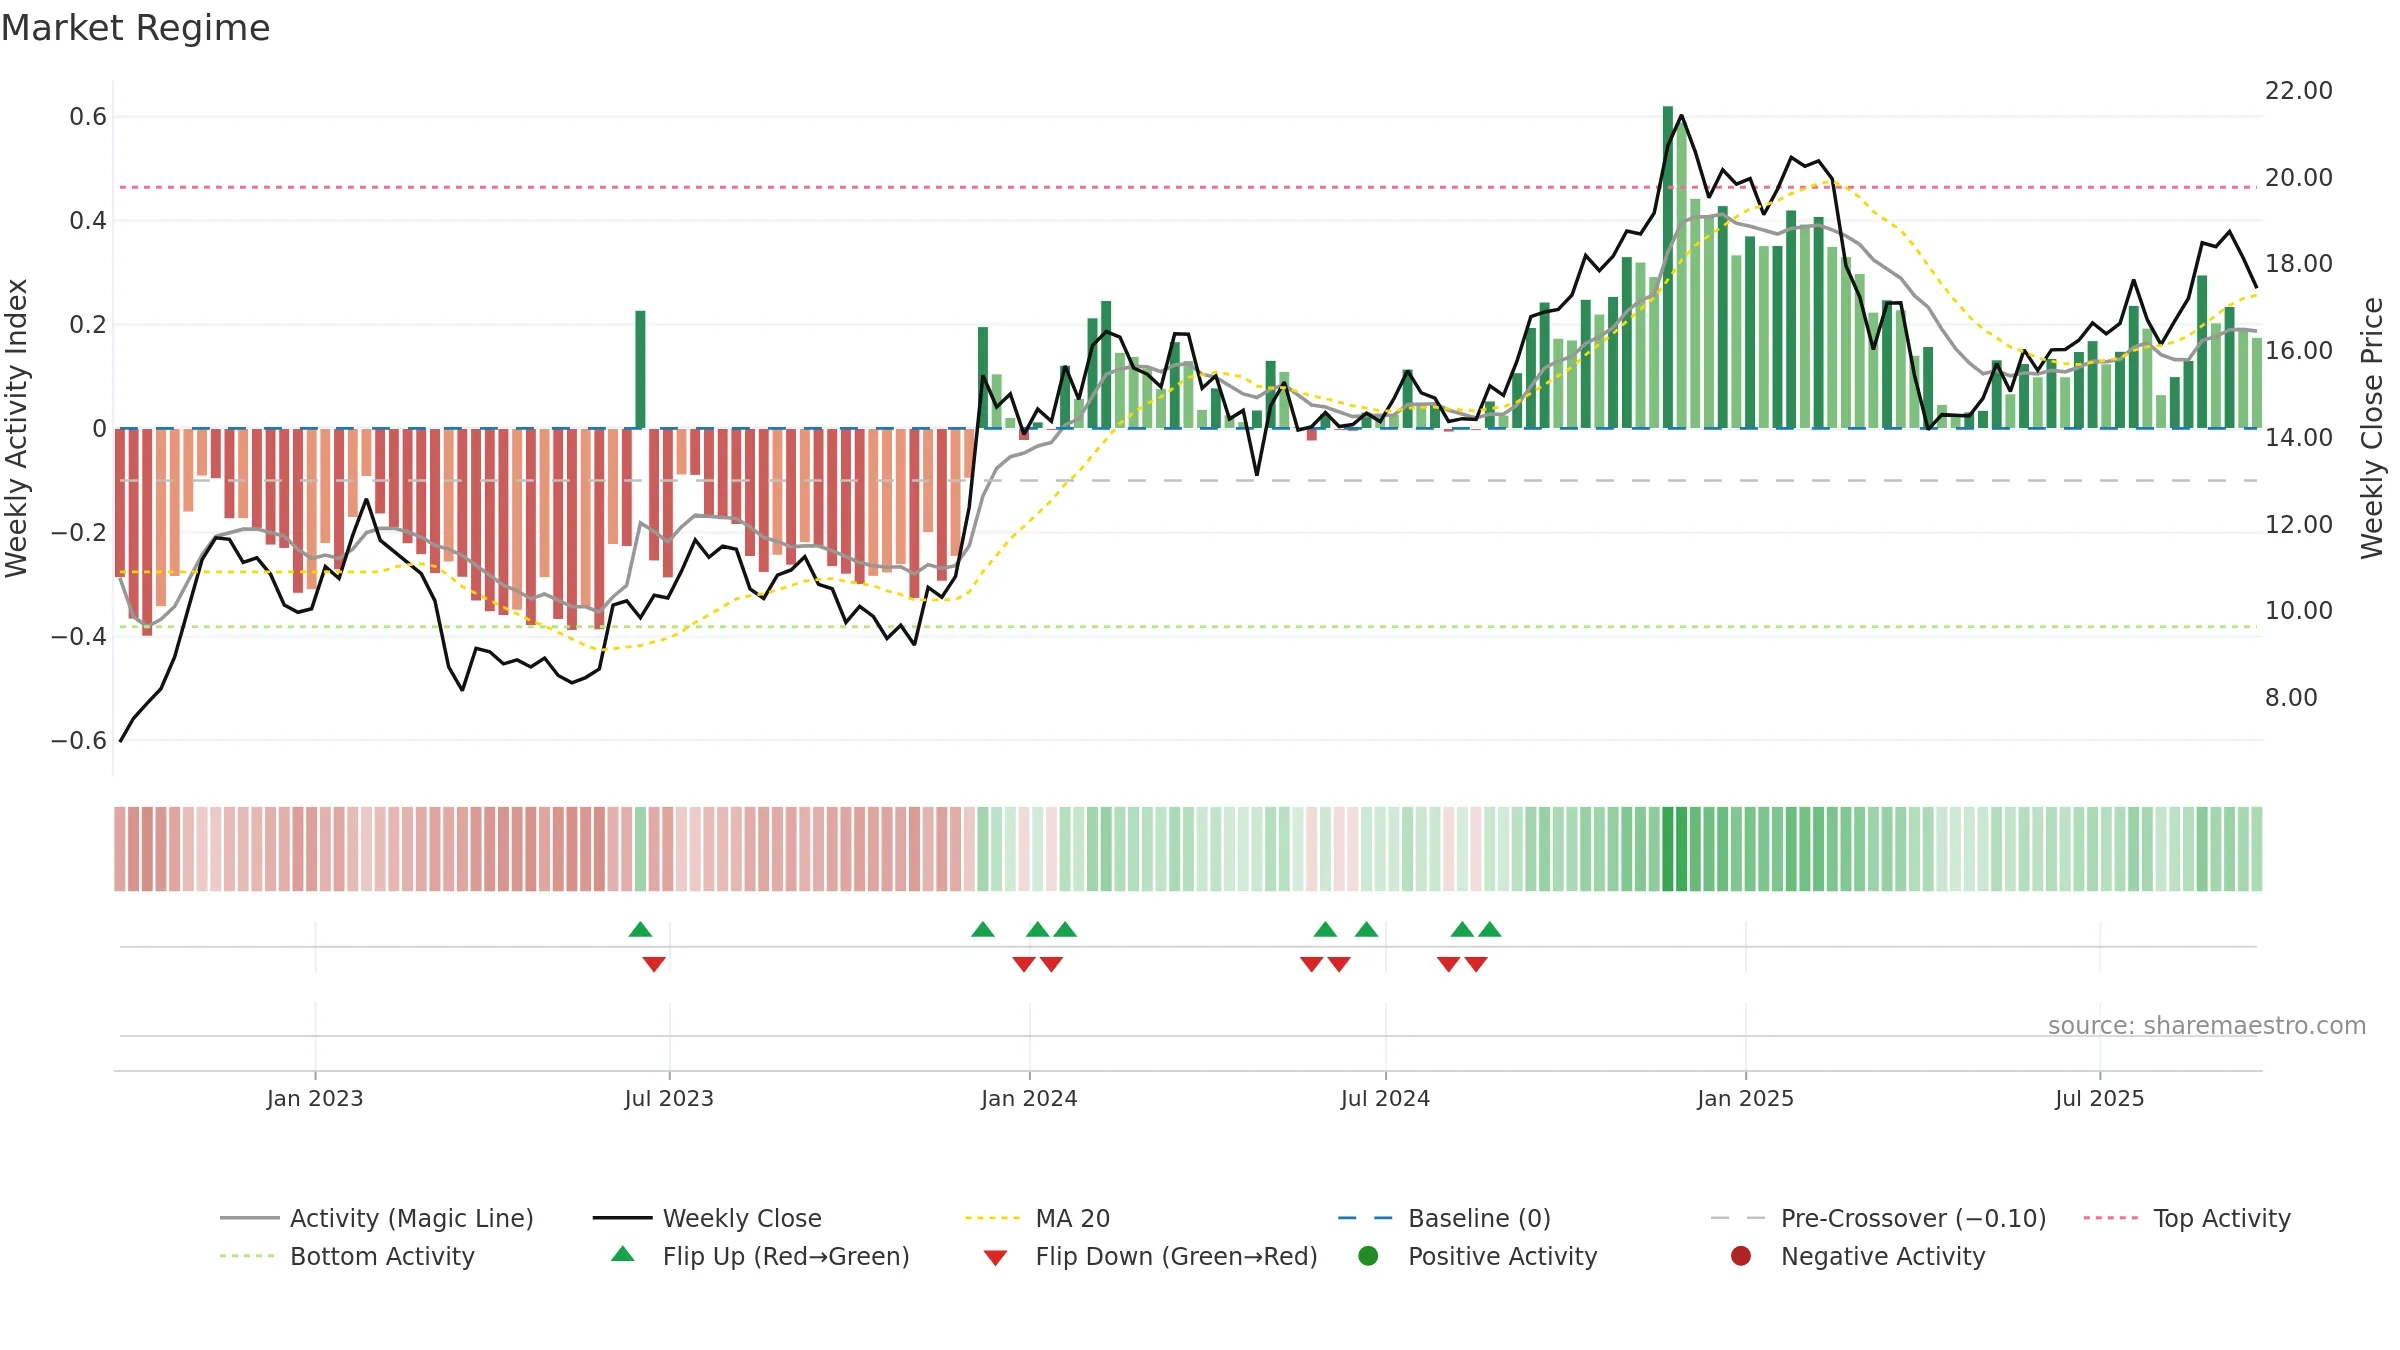
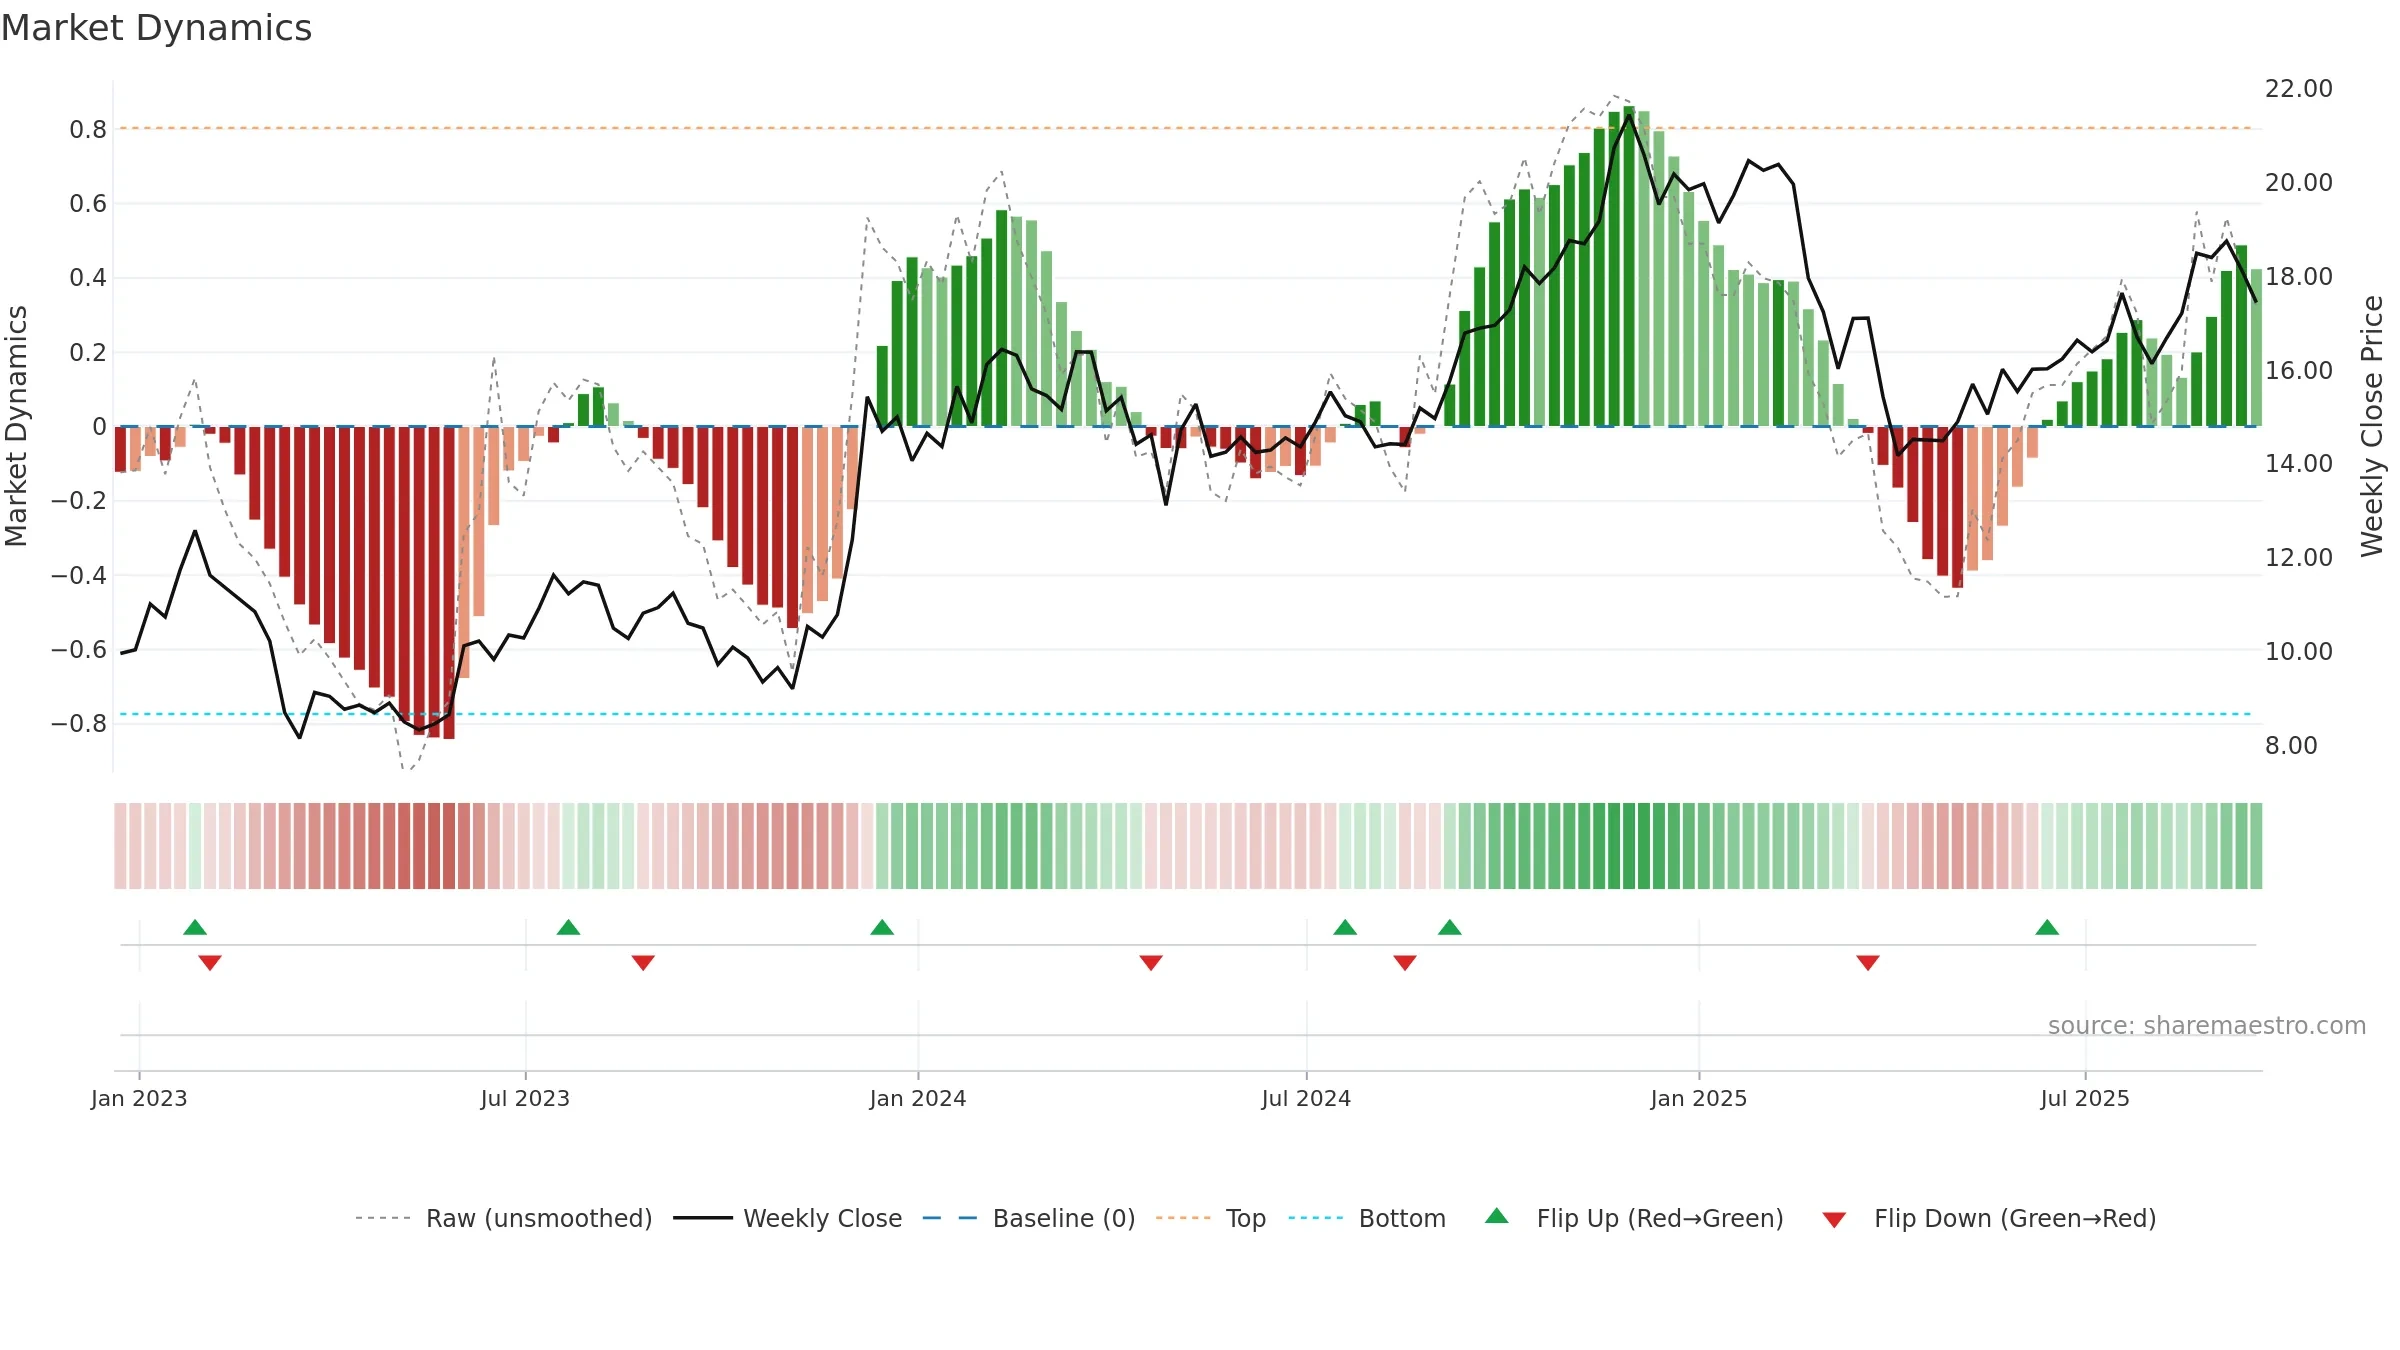
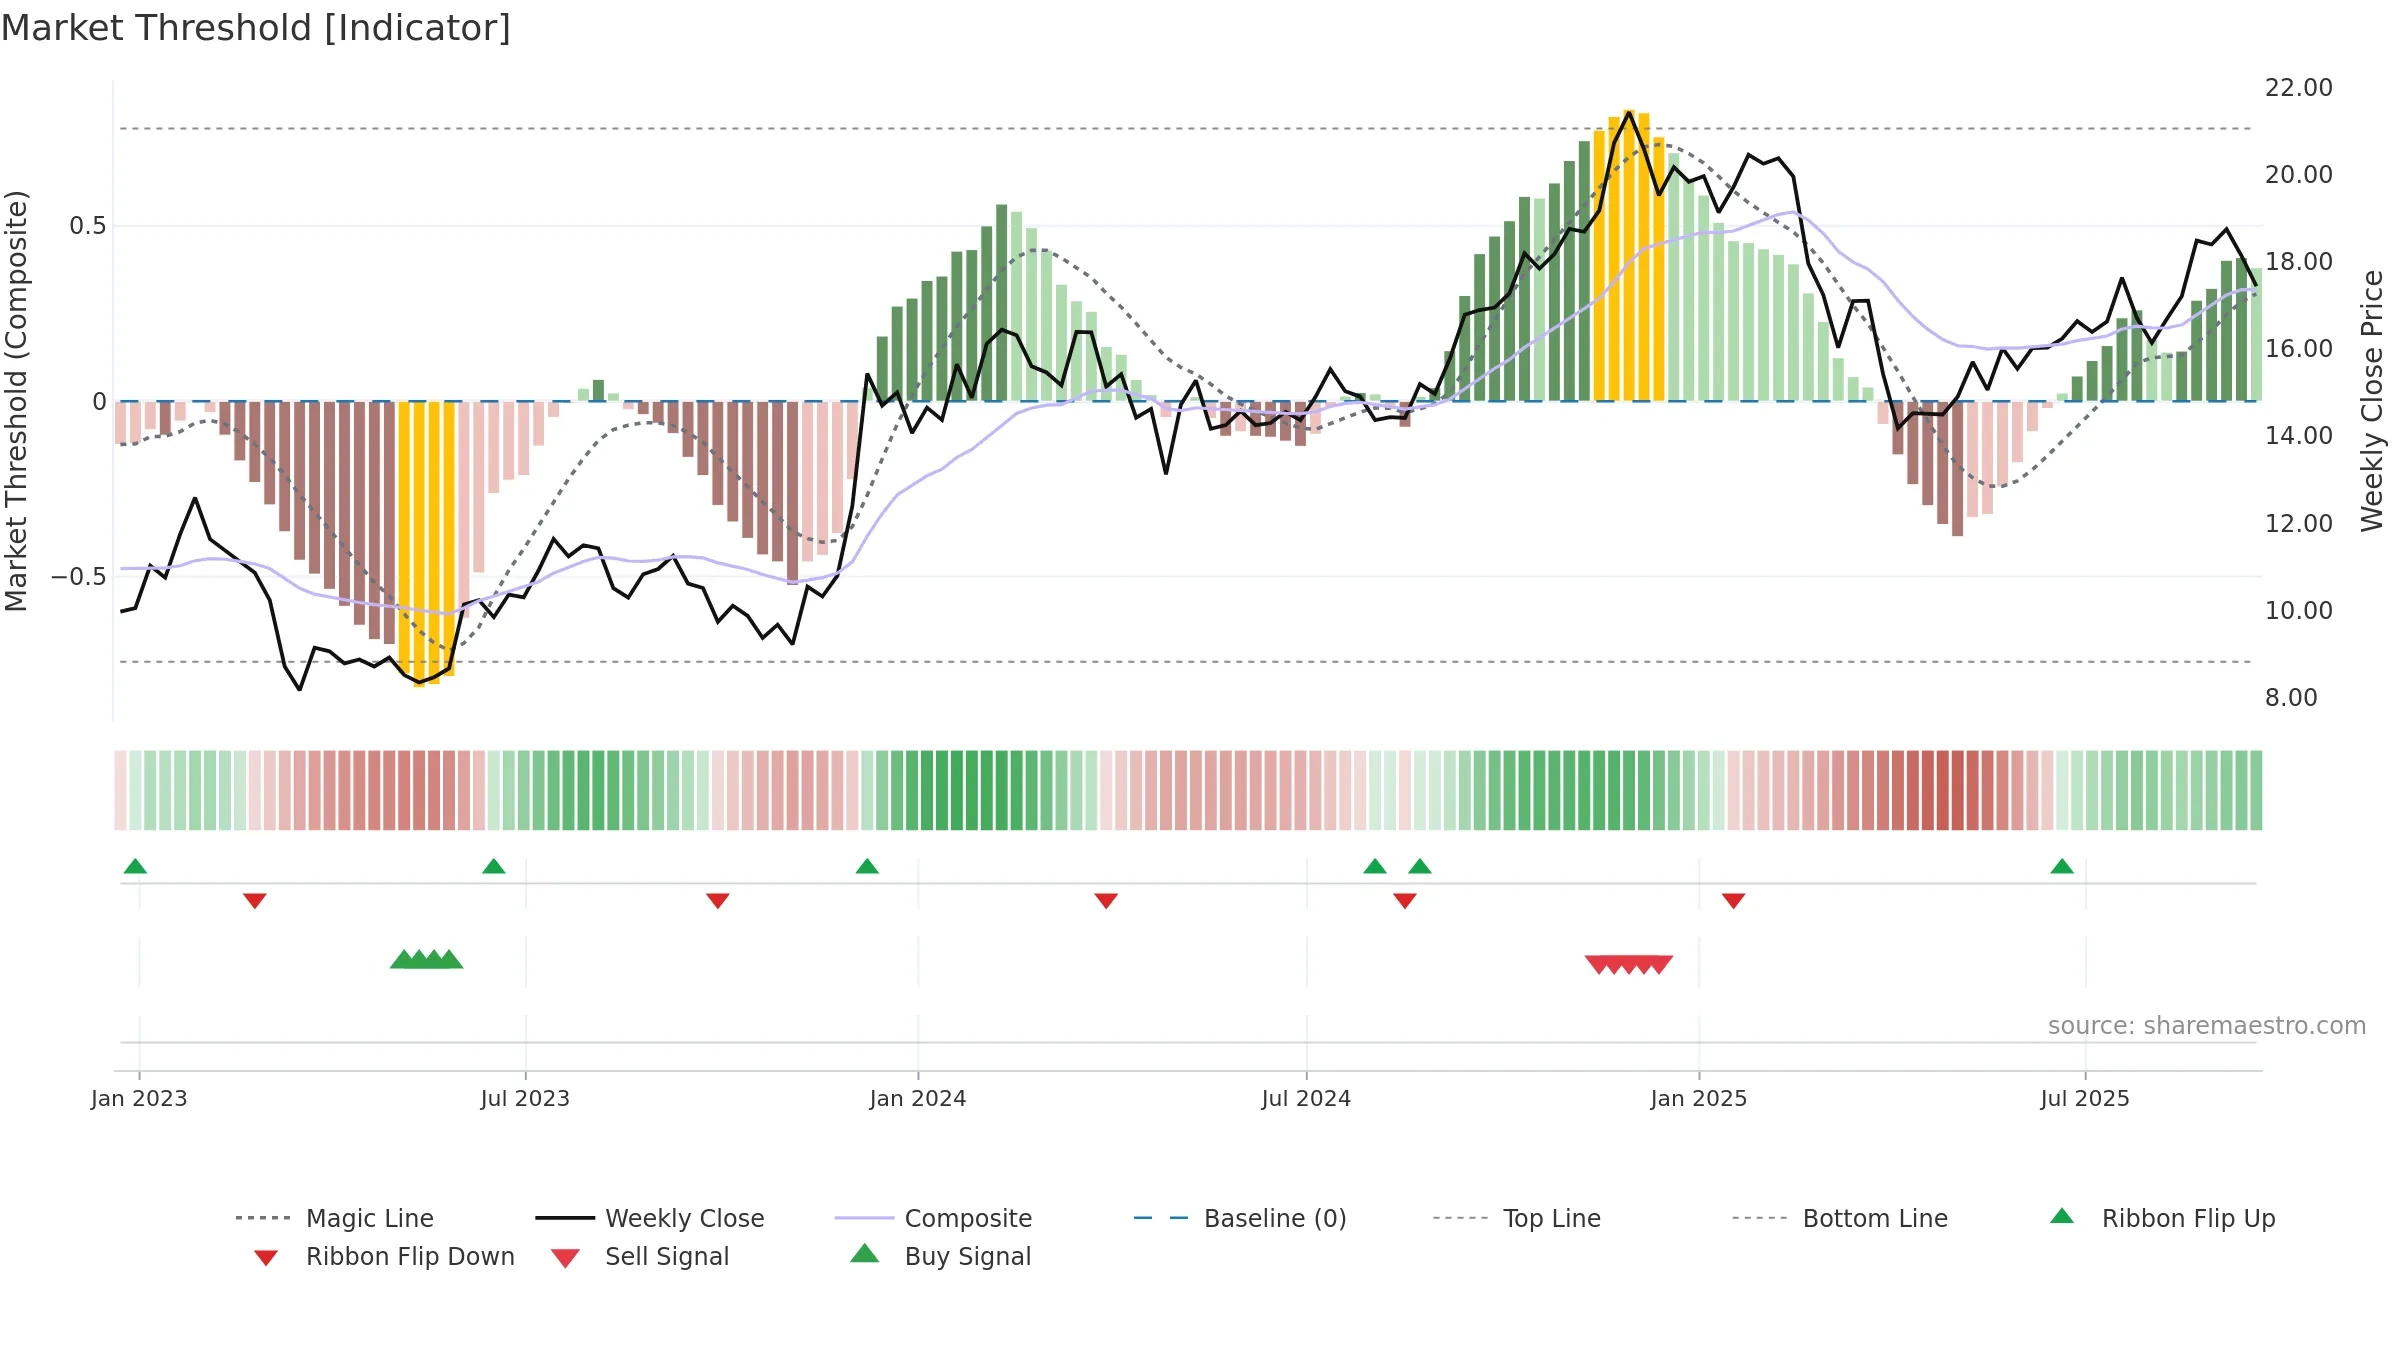
Gauge maps the trend signal to a 0–100 scale.
How to read this — High gauge and rising momentum — buyers in control.
Bias remains higher; pullbacks could be buyable if participation holds.
Conclusion
Positive setup. ★★★★☆ confidence. Price window: 8. Trend: Strong Uptrend; gauge 60. In combination, liquidity confirms the move.
- High gauge with rising momentum (strong uptrend)
- Momentum is bullish and rising
- Constructive moving-average stack
- Liquidity confirms the price trend
- Price is not above key averages
Why: Price window 8.05% over 8w. Close is -6.99% below the prior-window high. Volume trend rising. Liquidity convergence with price. Trend state strong uptrend. Low-regime (≤0.25) upticks 1/2 (50.0%) • Distributing. MA stack constructive. Momentum bullish and rising.
Tip: Most metrics include a hover tooltip where they appear in the report.