Alamos Gold Inc.
AGI NYSE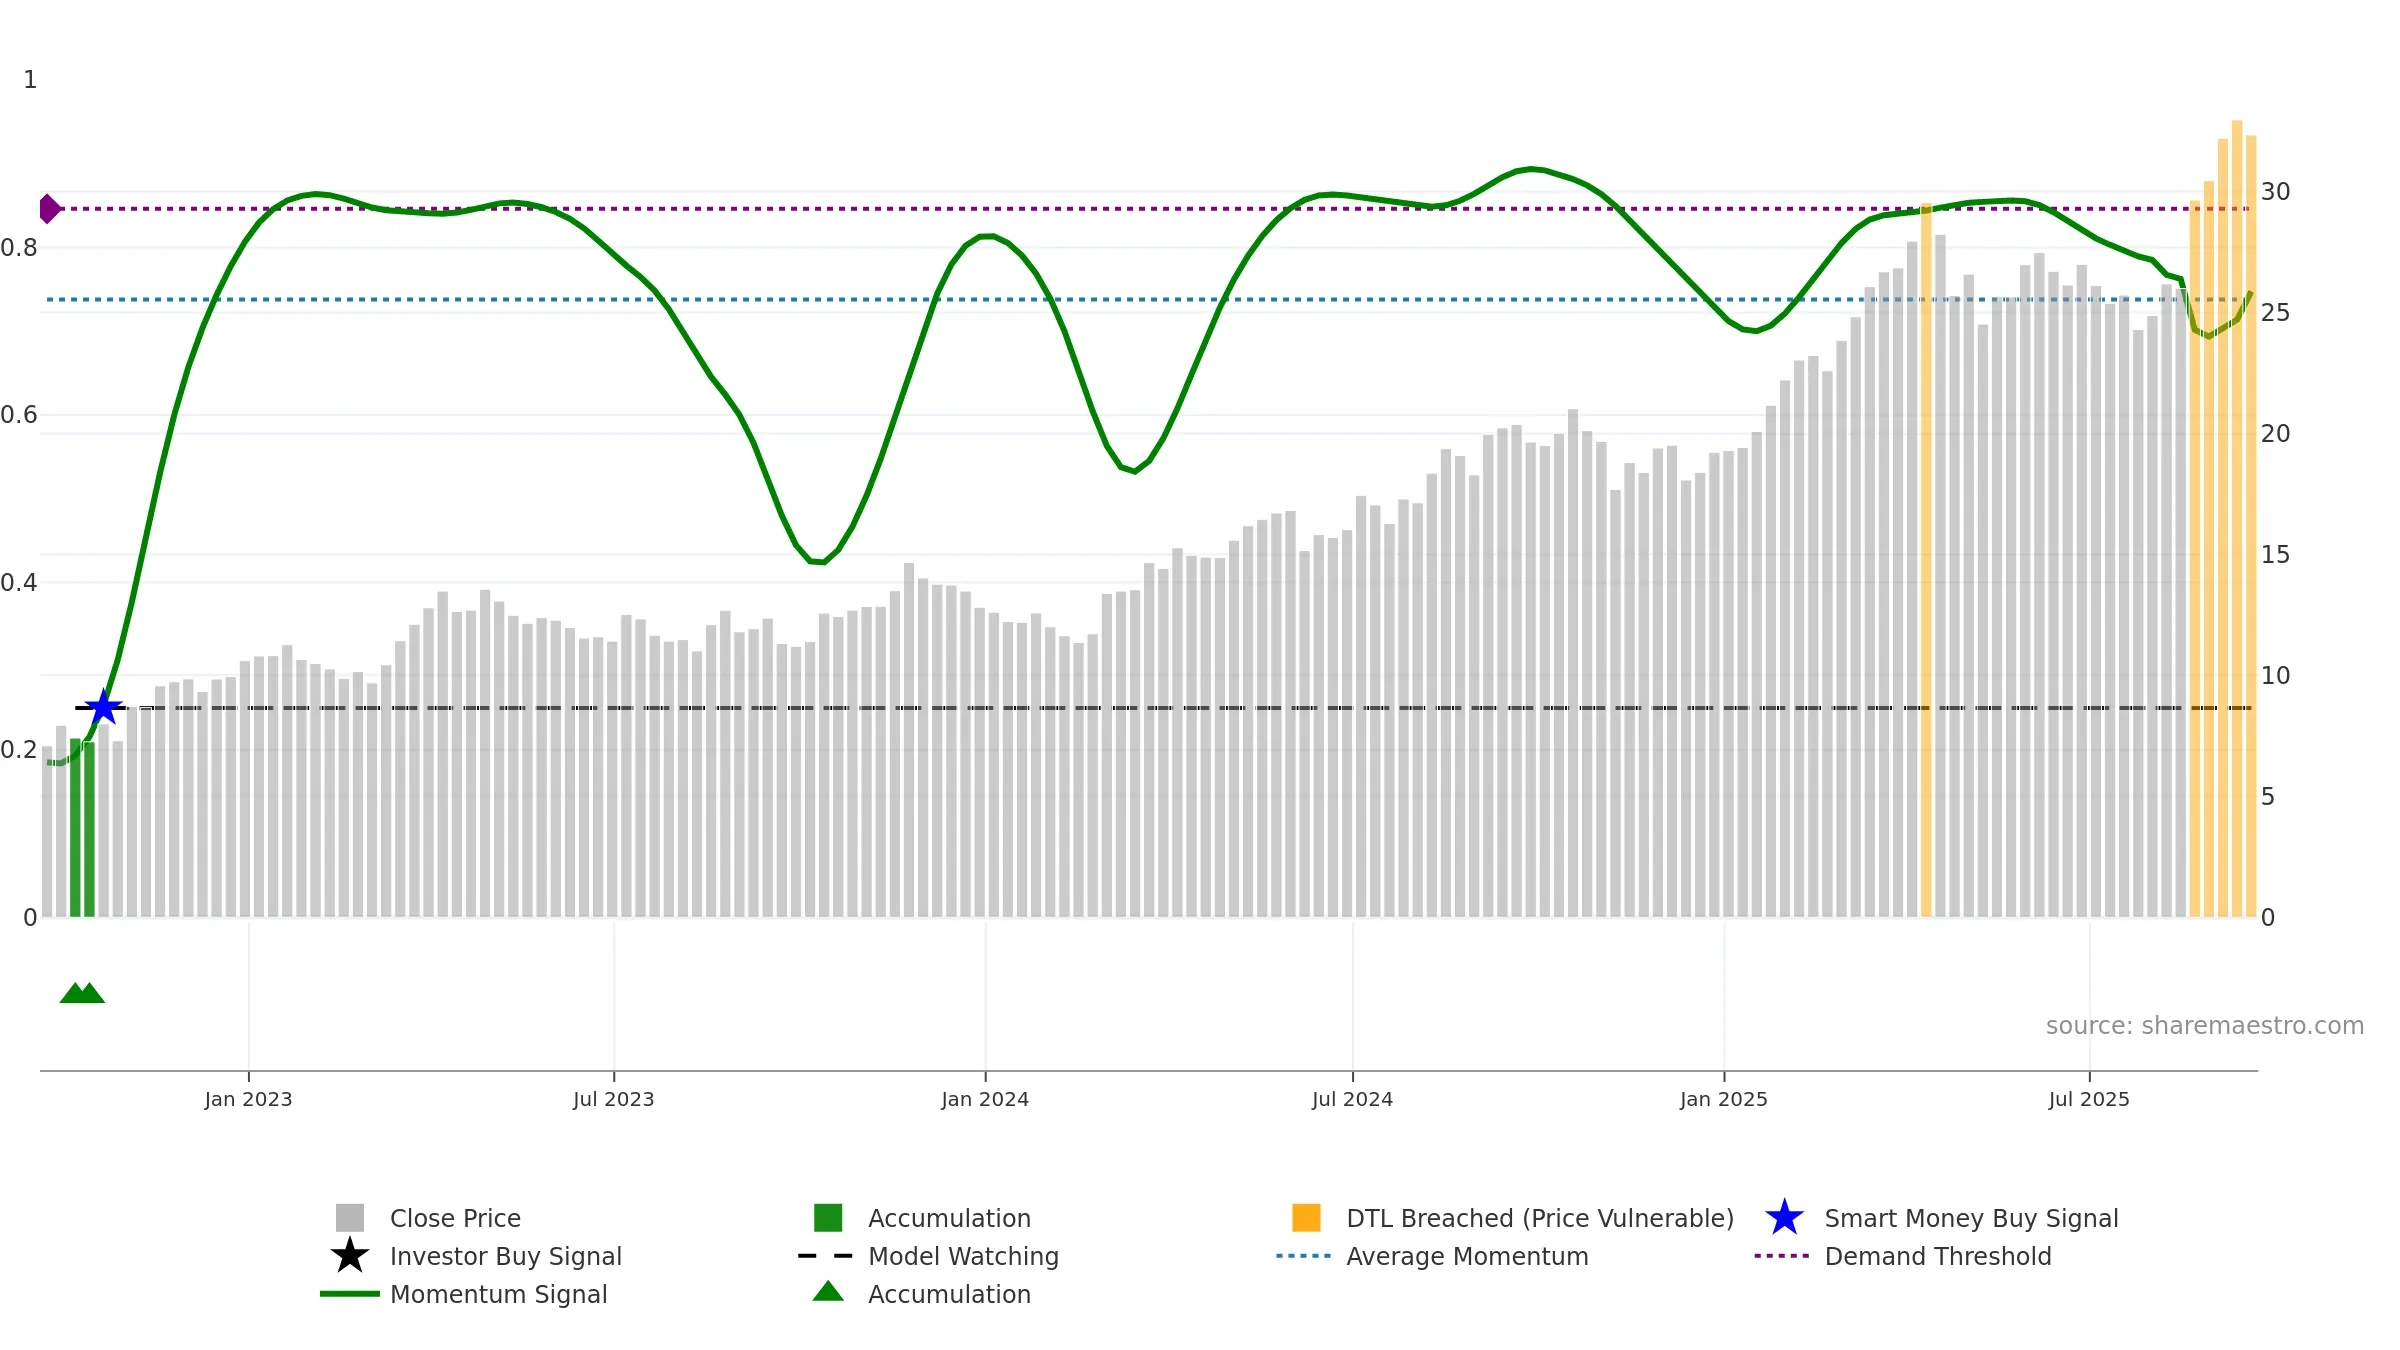
Weekly Report
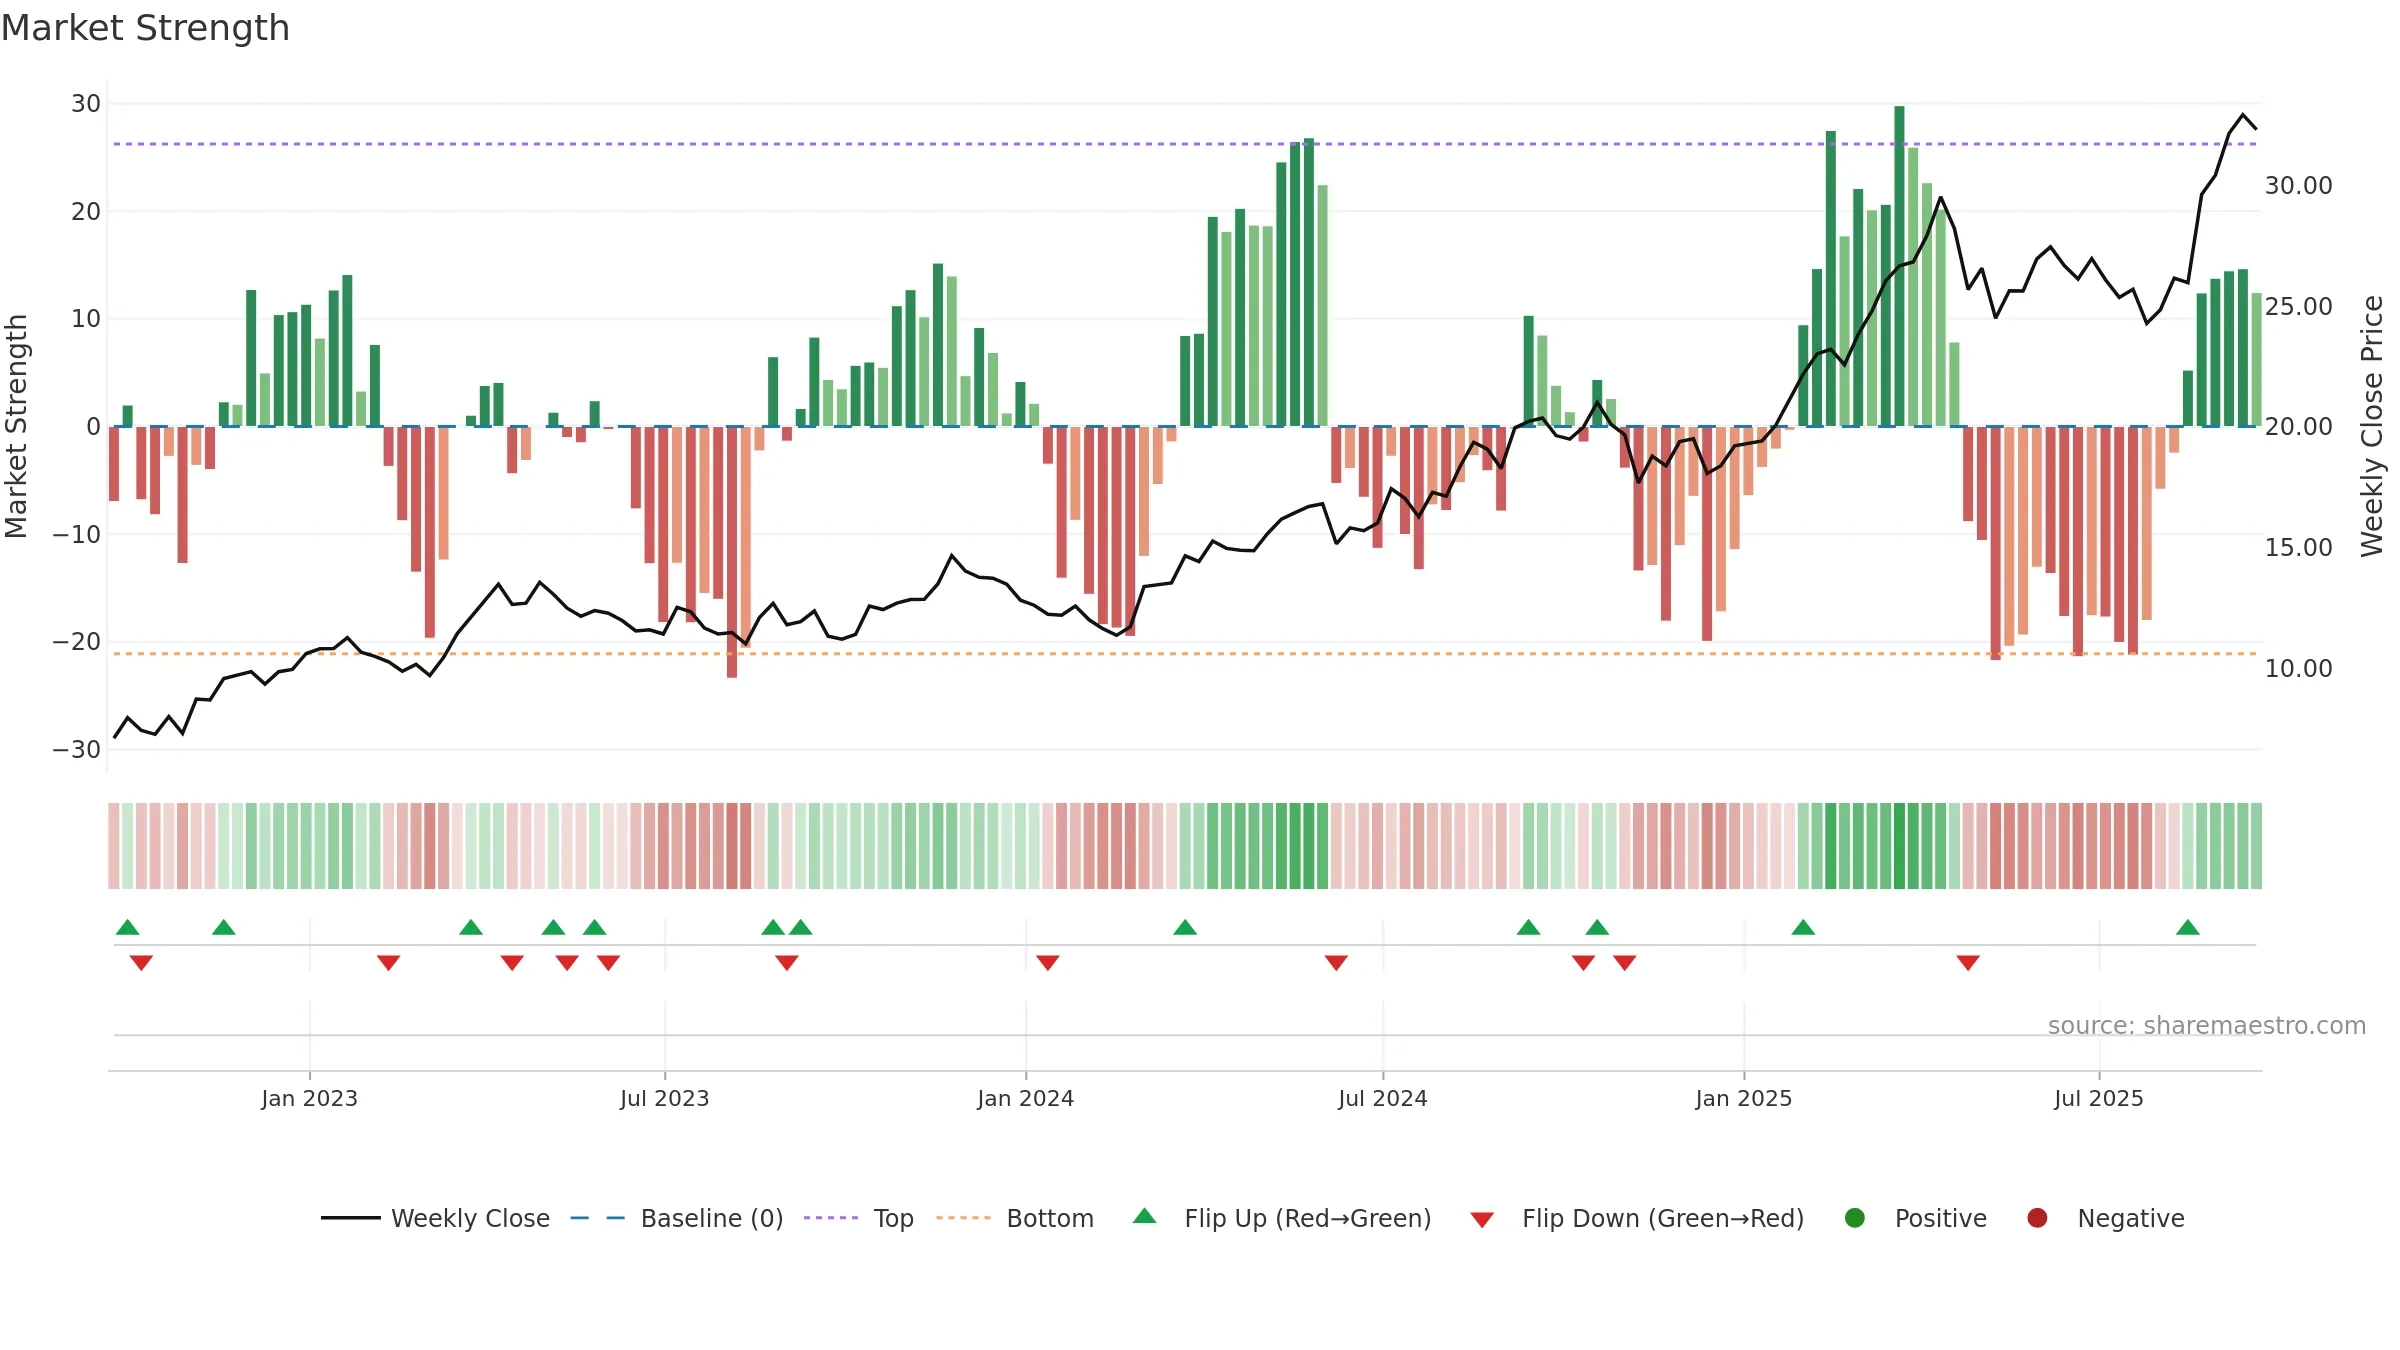
Alamos Gold Inc. closed at 32.3400 (3.55% WoW) . Data window ends Fri, 19 Sep 2025.
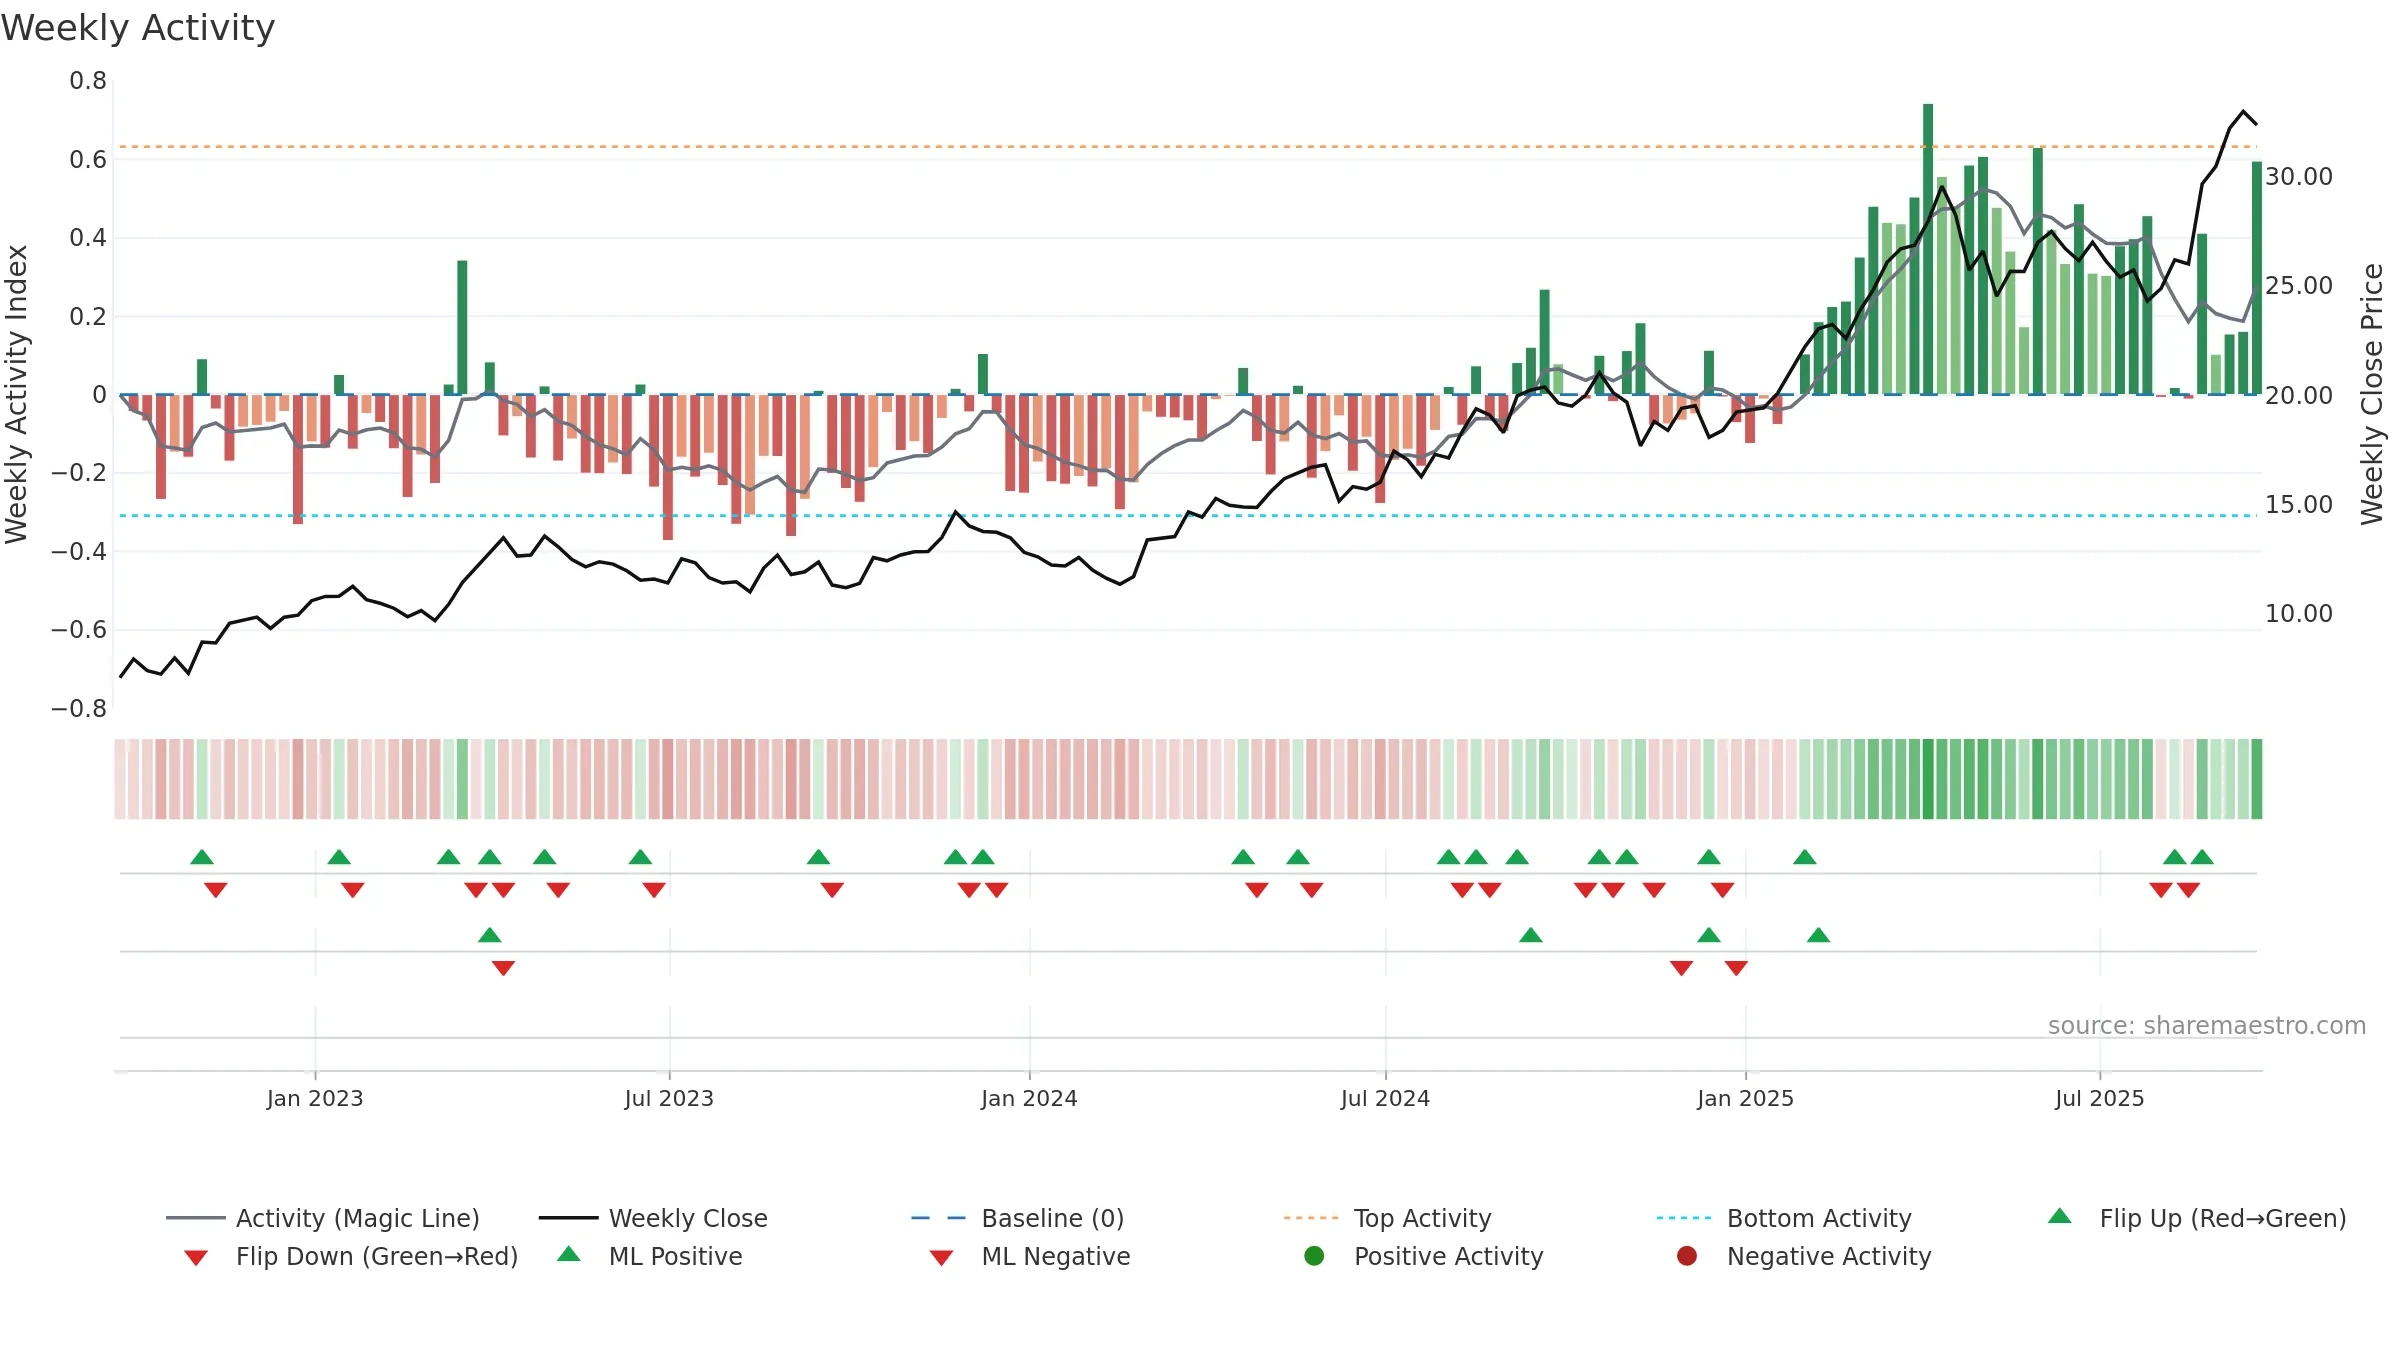
How to read this — Price slope is upward, indicating persistent buying over the window. Volume and price are moving in the same direction — a constructive confirmation. Returns are positively correlated with volume — strength tends to arrive on higher activity. Distance to baseline is narrowing — reverting closer to its fair-value track. Constructive MA stack supports the up-drift; pullbacks may find support at the 8–13 week region. Price holds above key averages, indicating constructive participation.
Up-slope supports buying interest; pullbacks may be contained if activity stays firm.
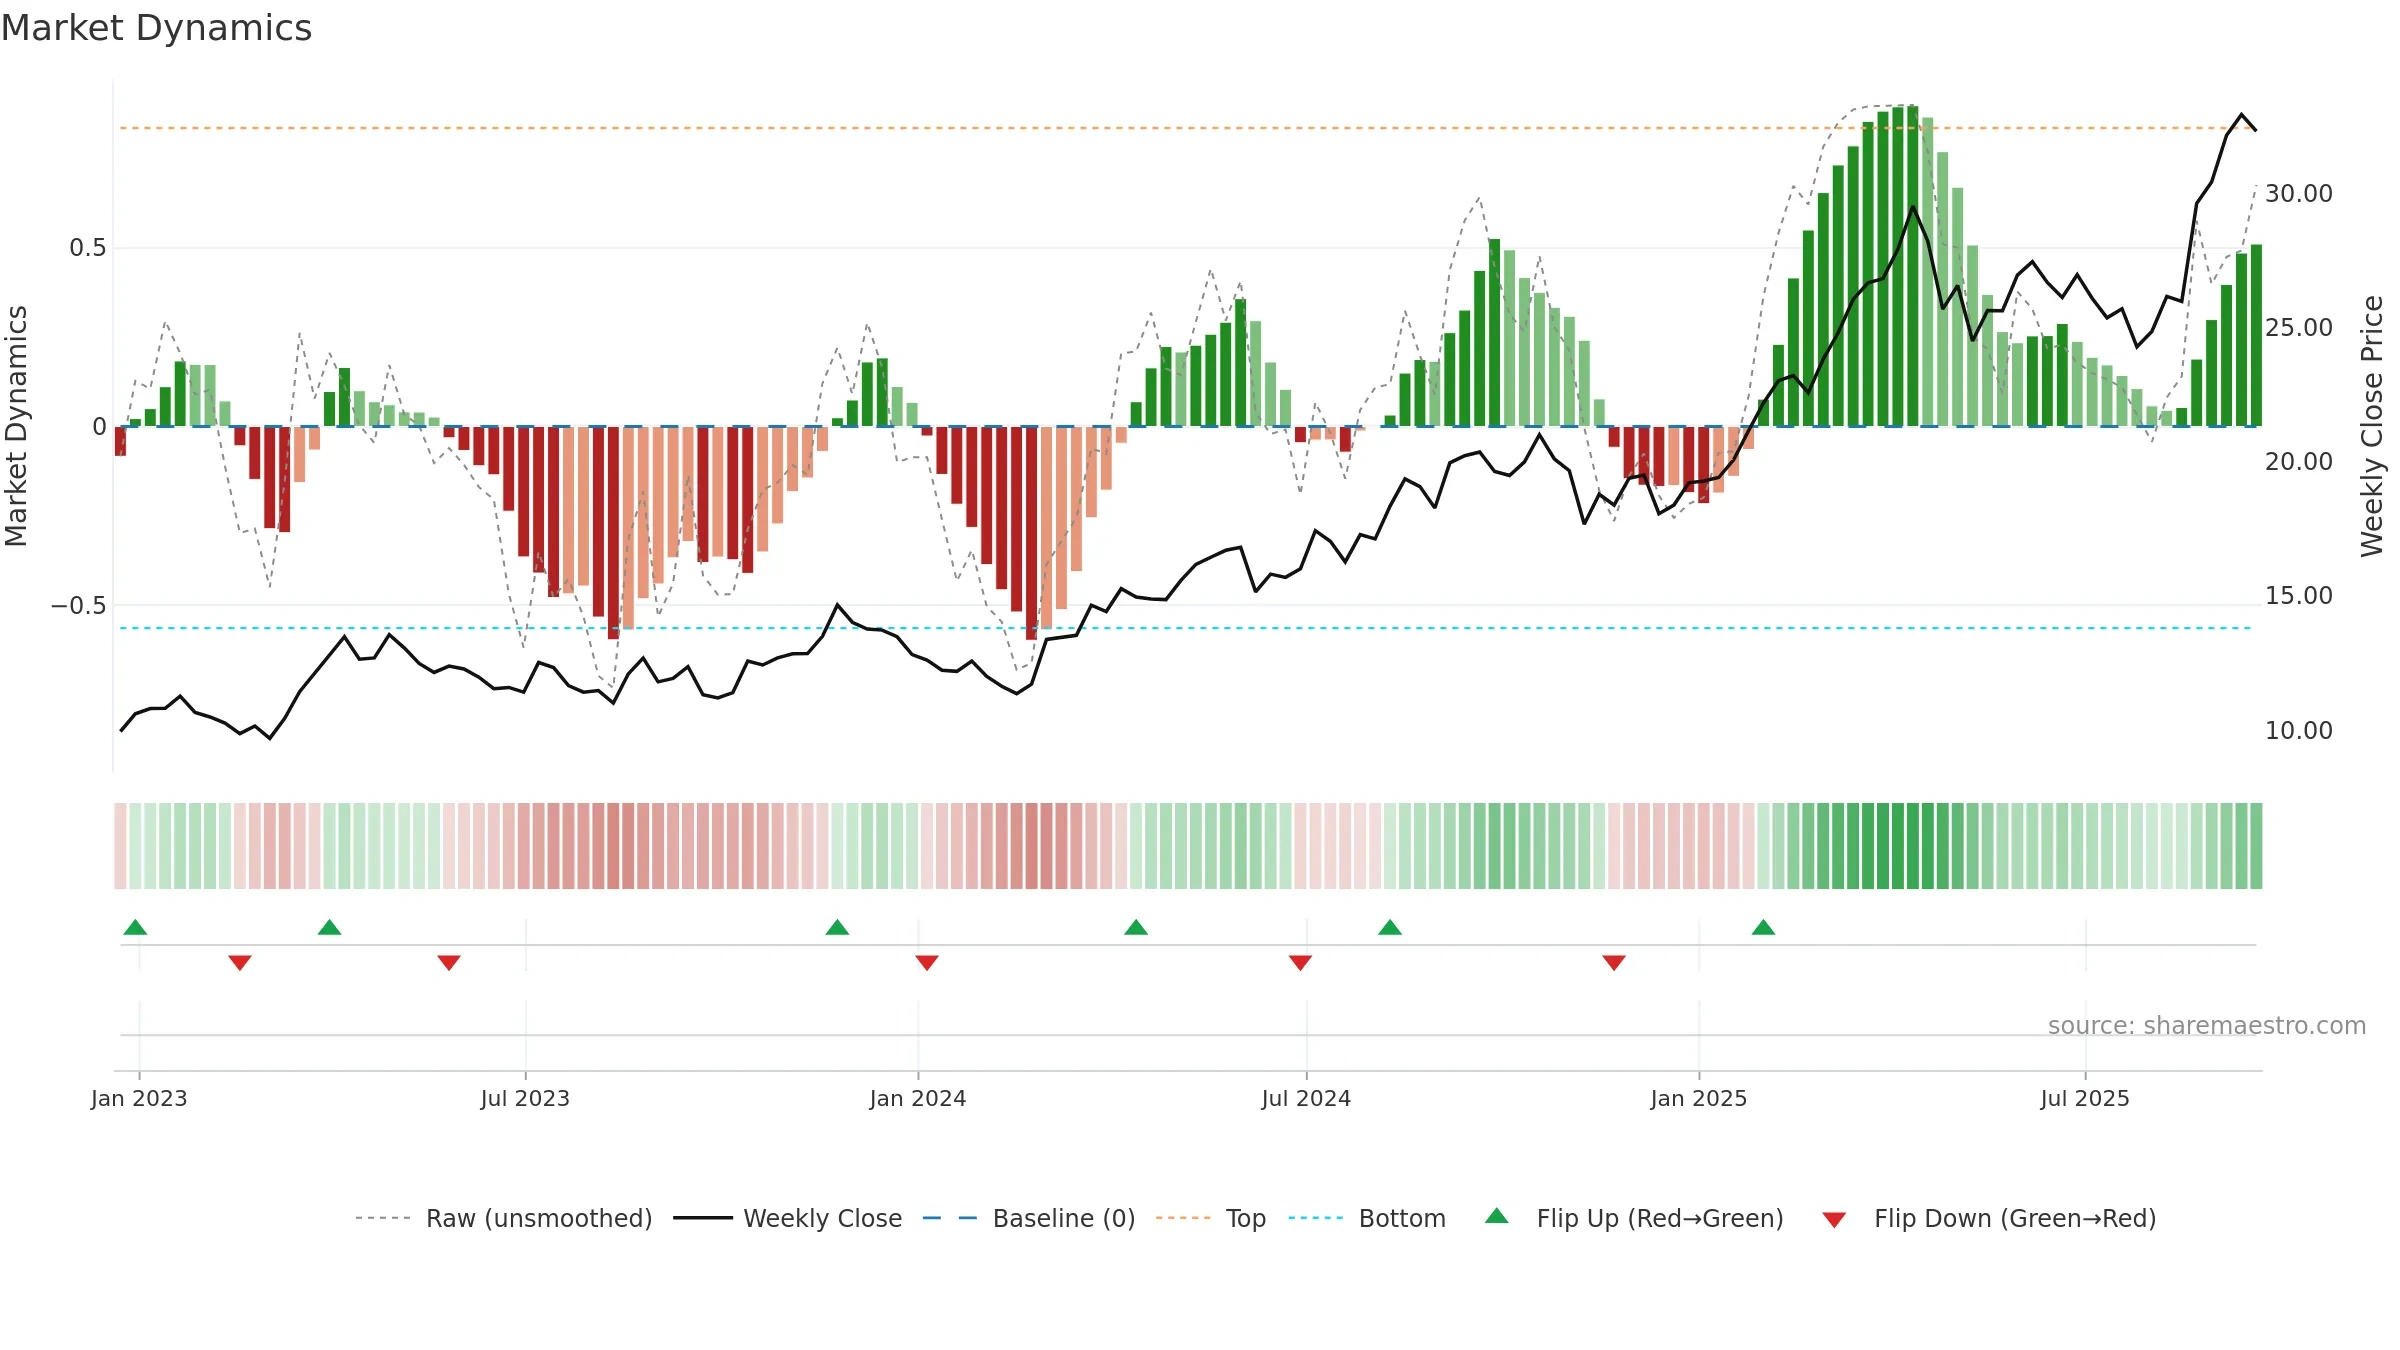
Gauge maps the trend signal to a 0–100 scale.
How to read this — Range-bound conditions; conviction is limited until a break or acceleration emerges.
Wait for a directional break or improving acceleration.
The flag is positive: favourable upside skew with supportive conditions.
Conclusion
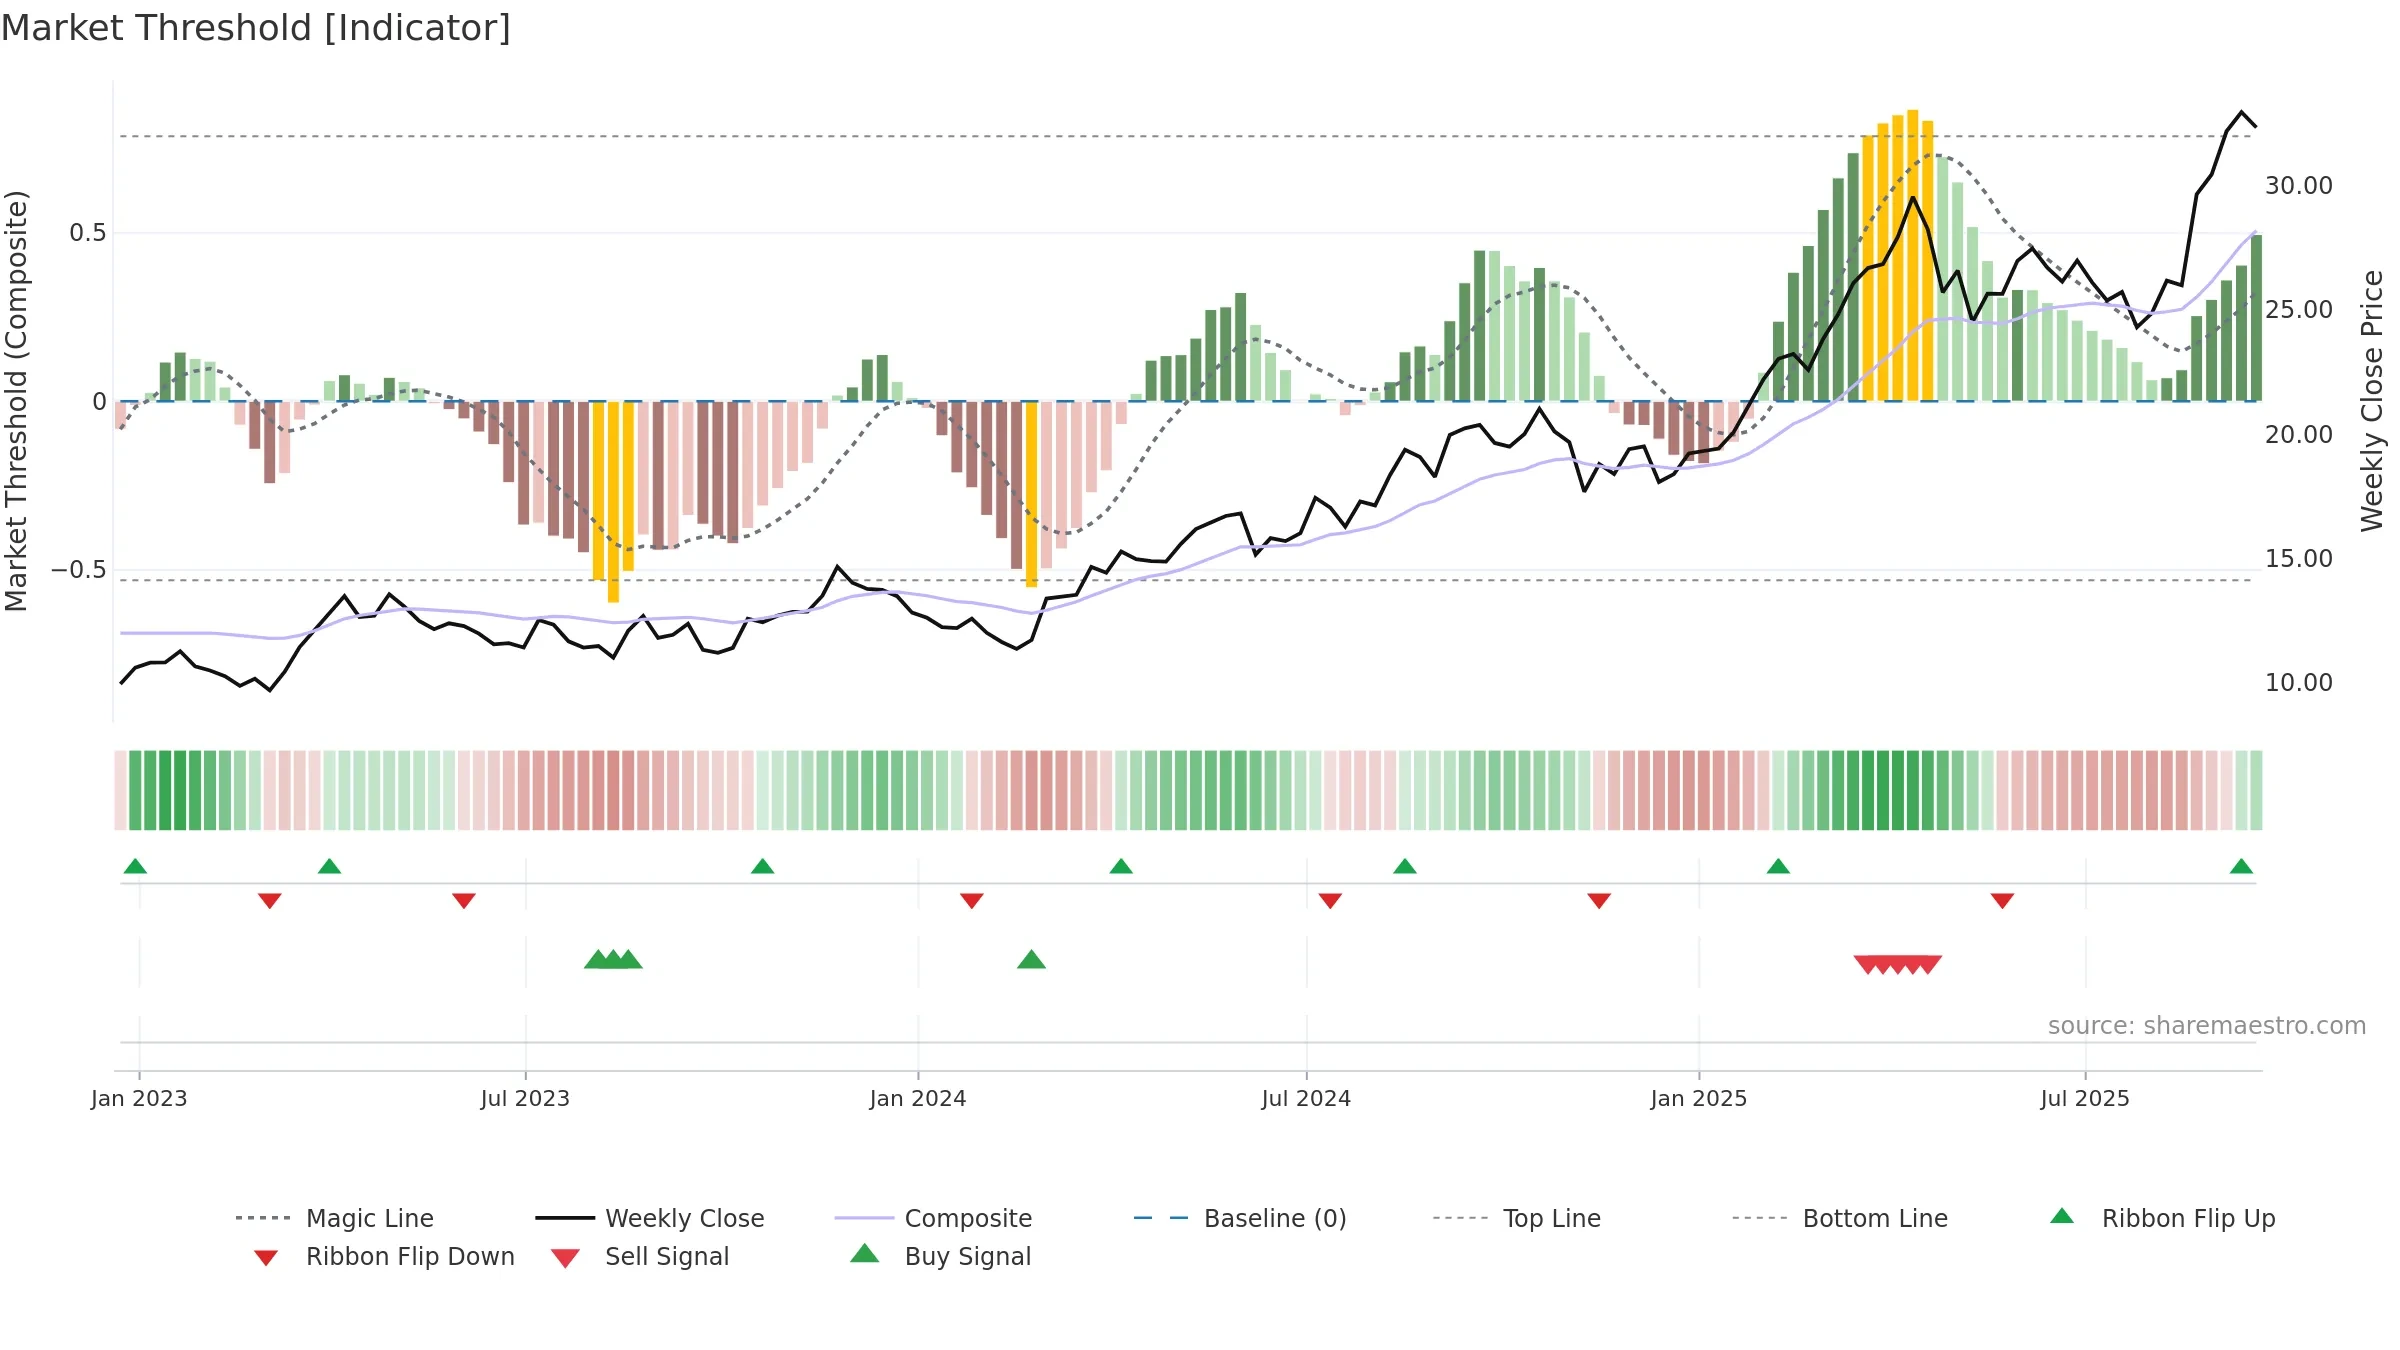
Positive setup. ★★★★☆ confidence. Price window: 30. Trend: Range / Neutral; gauge 74. In combination, liquidity confirms the move.
- Price holds above 8w & 26w averages
- Constructive moving-average stack
- Liquidity confirms the price trend
- Solid multi-week performance
- Momentum is weak/falling
Why: Price window 30.04% over 8w. Close is -1.88% below the prior-window high. Volume trend rising. Liquidity convergence with price. Trend state range / neutral. MA stack constructive. Momentum bullish and falling. Valuation stance positive.
Tip: Most metrics include a hover tooltip where they appear in the report.