Li Auto Inc.
LI NASDAQ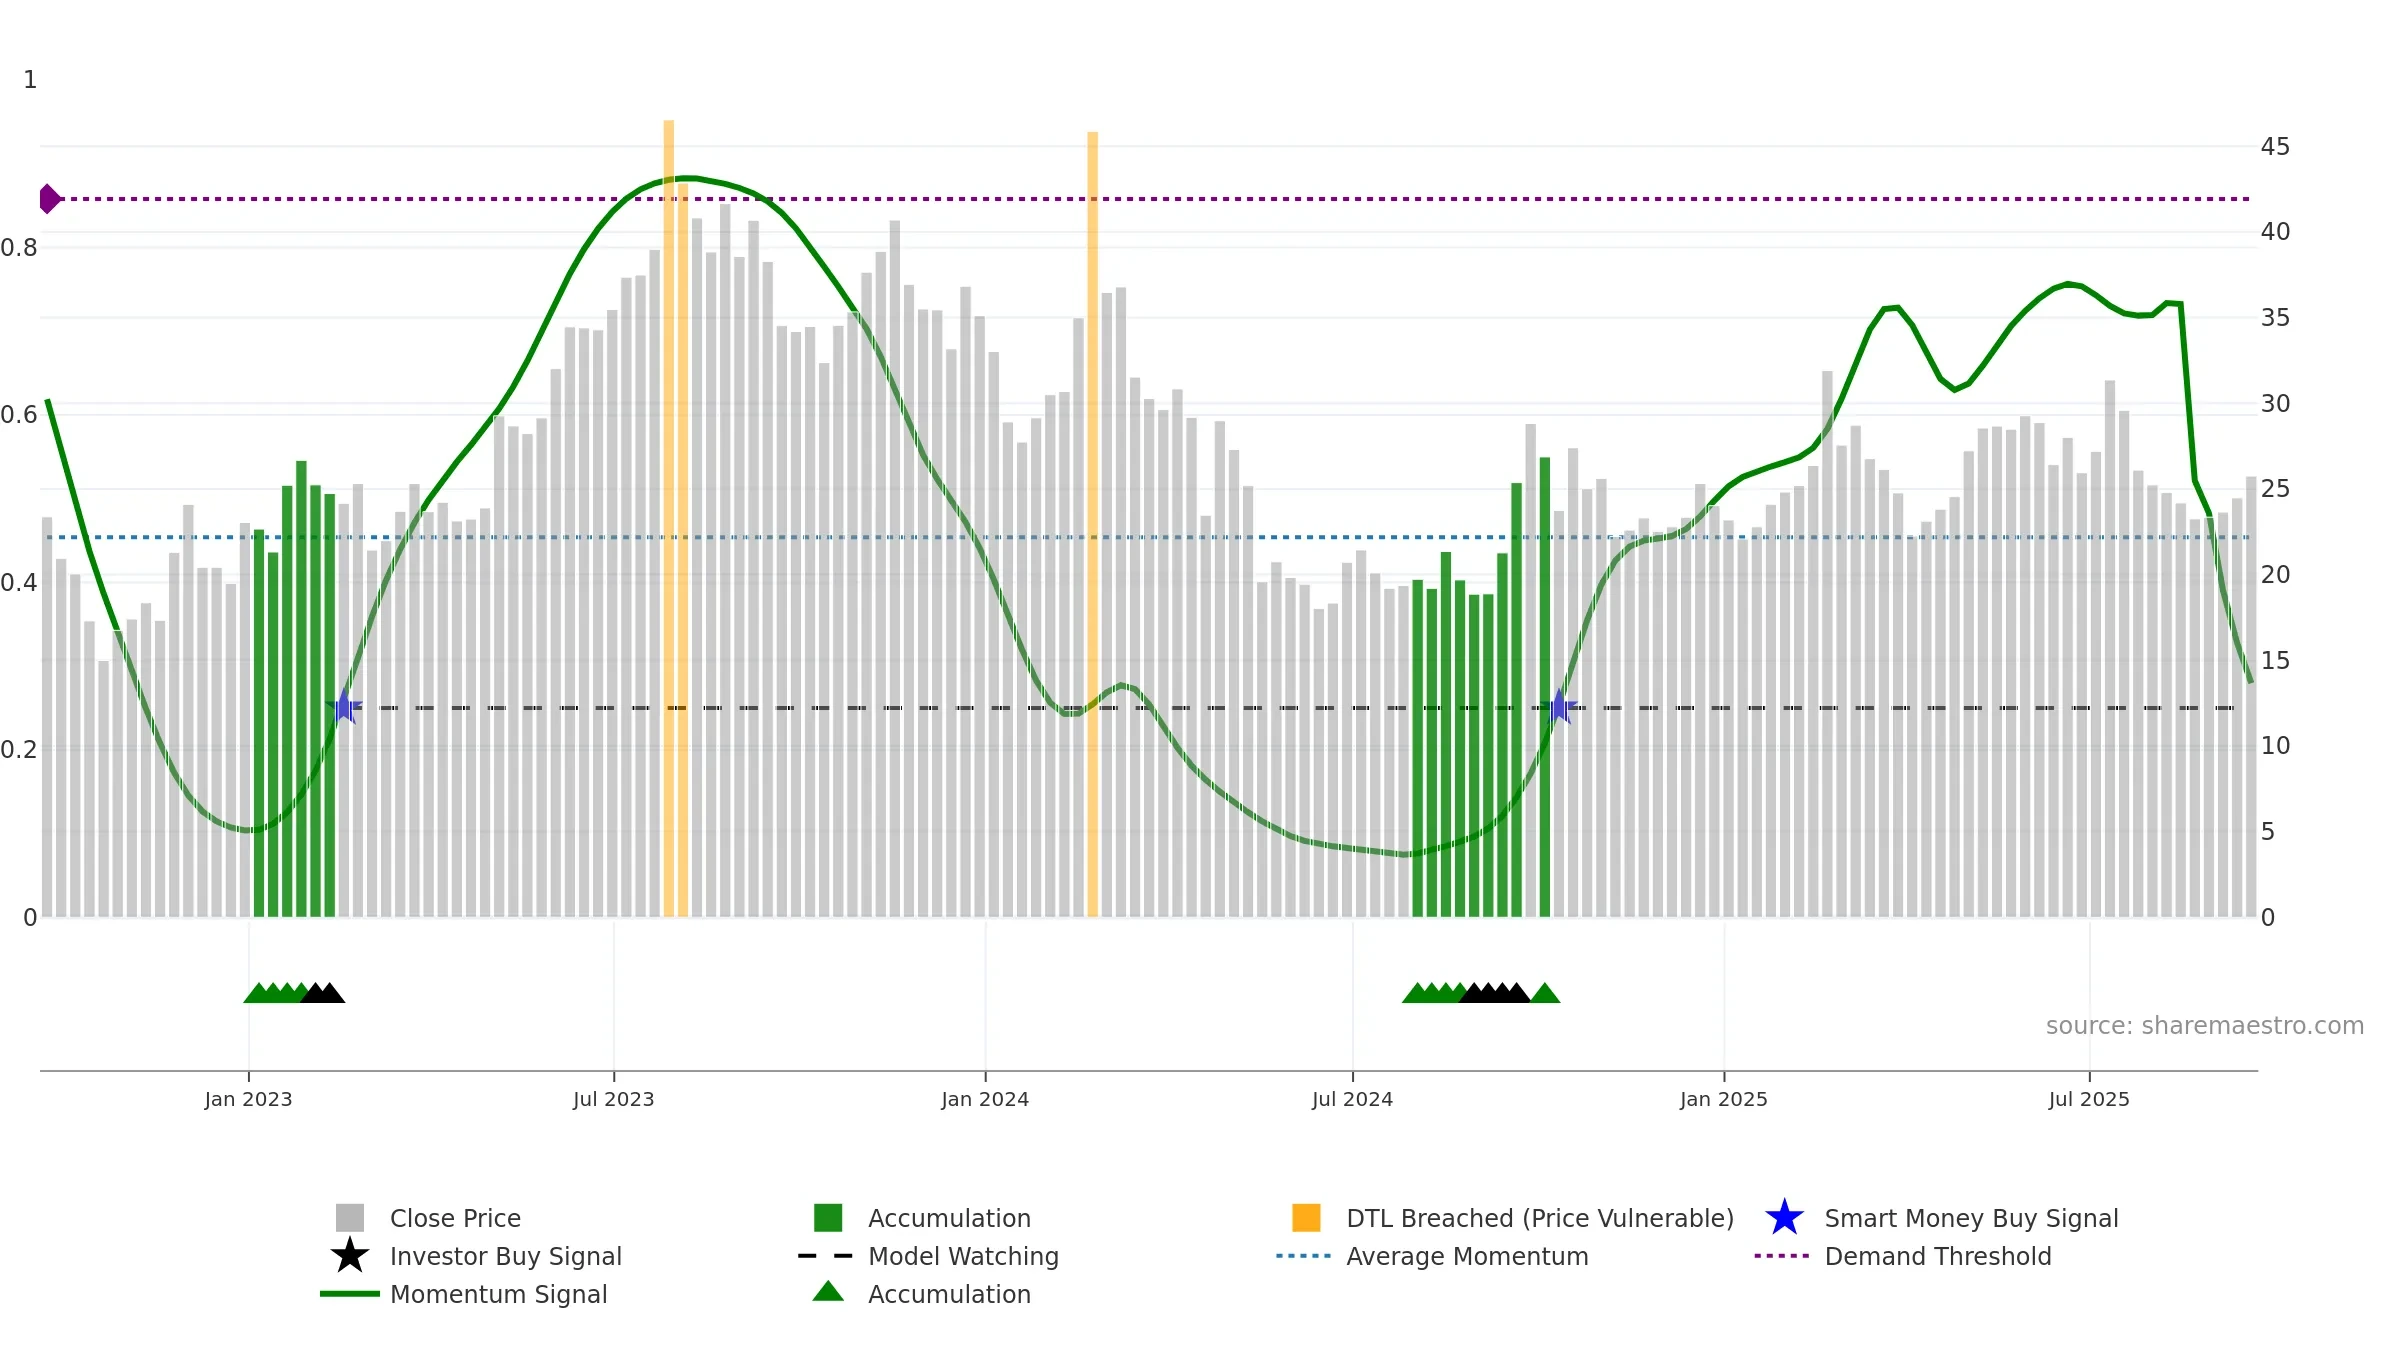
Weekly Summary
Li Auto Inc. closed at 25.7500 (-1.34% WoW) . Data window ends Fri, 19 Sep 2025.
How to read this — Price slope is upward, indicating persistent buying over the window. Low weekly volatility favours steadier follow-through. Volume trend diverges from price — watch for fatigue or rotation. Returns are negatively correlated with volume — strength may come on lighter activity. Weak MA stack argues for caution; rallies can fail near the 8–13 week region.
Up-slope supports buying interest; pullbacks may be contained if activity stays firm. Because liquidity isn’t confirming, prefer evidence of fresh demand before chasing moves.
Gauge maps the trend signal to a 0–100 scale.
How to read this — Bearish zone with falling momentum — sellers in control. Sub-0.40 print confirms downside control.
Bias remains lower; rallies are suspect unless gauge reclaims 0.50/0.60.

Relative strength is Negative
(< 0%, underperforming).
Latest MRS: -13.44% (week ending Fri, 19 Sep 2025).
Slope: Falling over 8w.
Notes:
- Below zero line indicates relative weakness vs benchmark.
- MRS slope falling over ~8 weeks.
Conclusion
Negative setup. ★⯪☆☆☆ confidence. Trend: Downtrend Confirmed · 2.02% over window · vol 1.06% · liquidity divergence · posture mixed · RS weak
- Low return volatility supports durability
- Bearish control with falling momentum
- Momentum is weak/falling
- Price is not above key averages
- Weak moving-average stack
Why: Price window 2.02% over w. Close is 2.02% above the prior-window high. Return volatility 1.06%. Volume trend falling. Liquidity divergence with price. Trend state downtrend confirmed. MA stack weak. Momentum bearish and falling.
Tip: Most metrics include a hover tooltip where they appear in the report.