Spectrum Brands Holdings, Inc.
SPB NYSE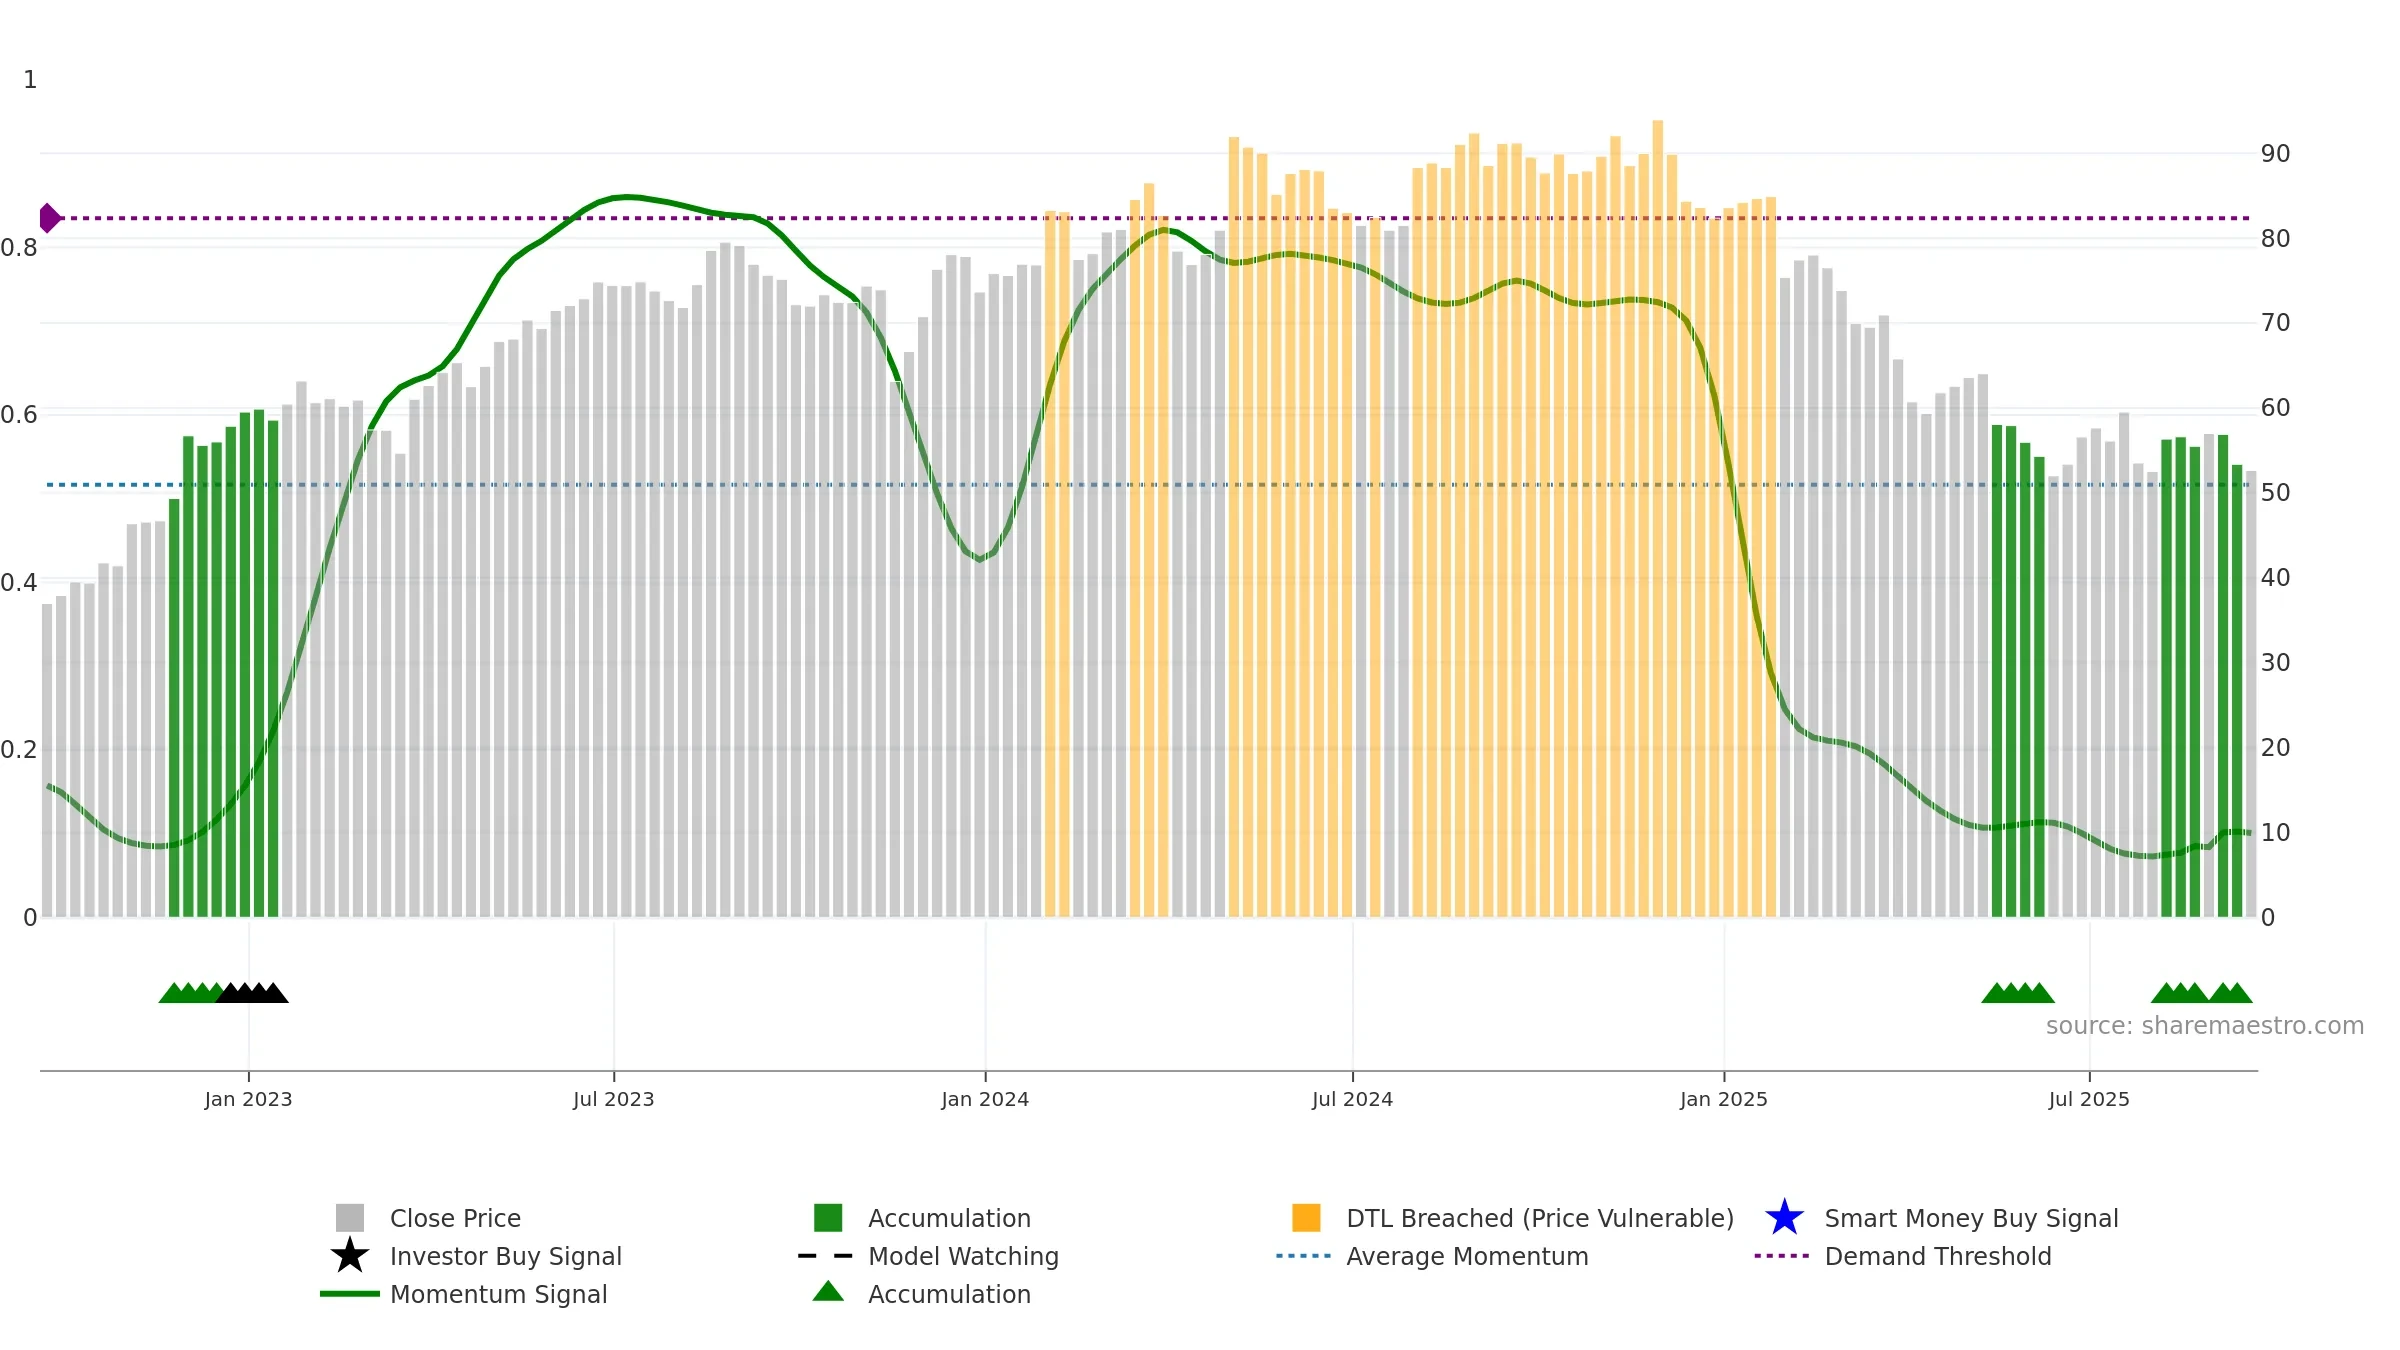
Weekly Report
Spectrum Brands Holdings, Inc. closed at 52.6400 (-3.54% WoW) . Data window ends Fri, 19 Sep 2025.
How to read this — Price slope is downward, indicating persistent supply pressure. Low weekly volatility favours steadier follow-through. Volume and price are moving in the same direction — a constructive confirmation. Returns are positively correlated with volume — strength tends to arrive on higher activity. Weak MA stack argues for caution; rallies can fail near the 8–13 week region. Fresh short-term downside crossover weakens near-term tone. Price sits below key averages, keeping pressure on the tape.
Down-slope argues for patience; rallies can fade sooner unless participation improves.
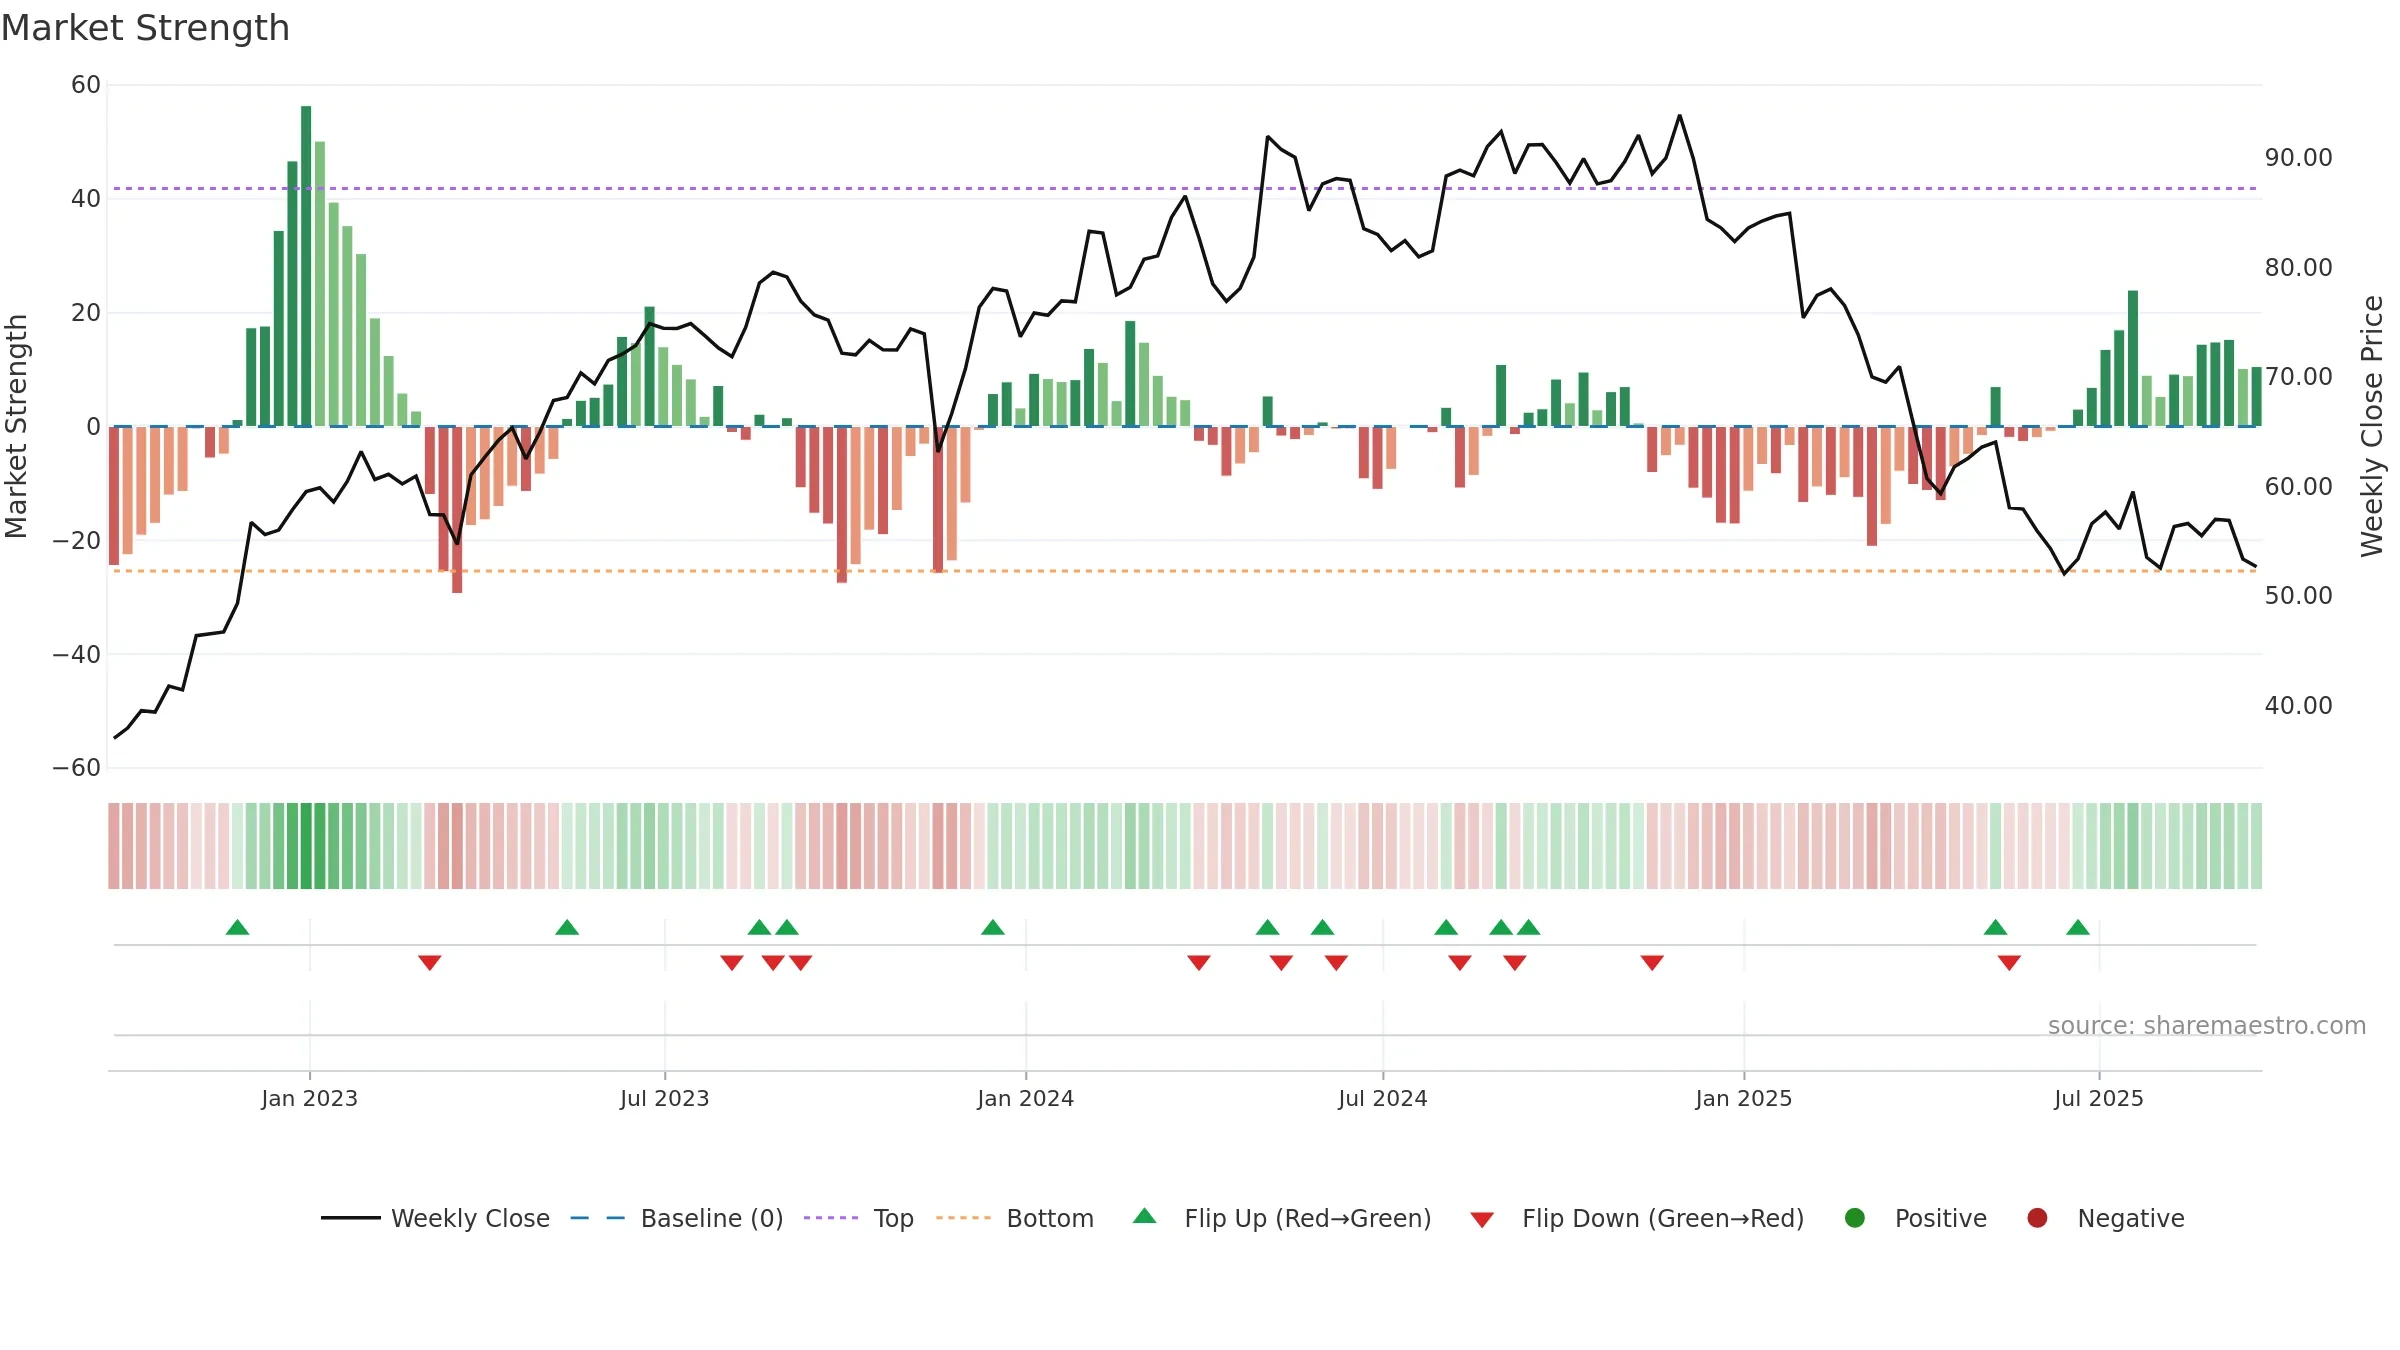
Gauge maps the trend signal to a 0–100 scale.
How to read this — Range-bound conditions; conviction is limited until a break or acceleration emerges.
Wait for a directional break or improving acceleration.
The flag is positive: favourable upside skew with supportive conditions.
Conclusion
Positive setup. ★★★★☆ confidence. Price window: 0. Trend: Range / Neutral; gauge 10. In combination, liquidity confirms the move.
- Liquidity confirms the price trend
- Low return volatility supports durability
- Buyers step in at depressed levels (accumulation)
- Price is not above key averages
- Weak moving-average stack
Why: Price window 0.21% over 8w. Close is -7.63% below the prior-window high. Return volatility 1.92%. Volume trend falling. Liquidity convergence with price. Trend state range / neutral. Low-regime (≤0.25) upticks 5/7 (71.0%) • Accumulating. MA stack weak. 4–8w crossover bearish. Momentum neutral and rising. Valuation stance positive.
Tip: Most metrics include a hover tooltip where they appear in the report.