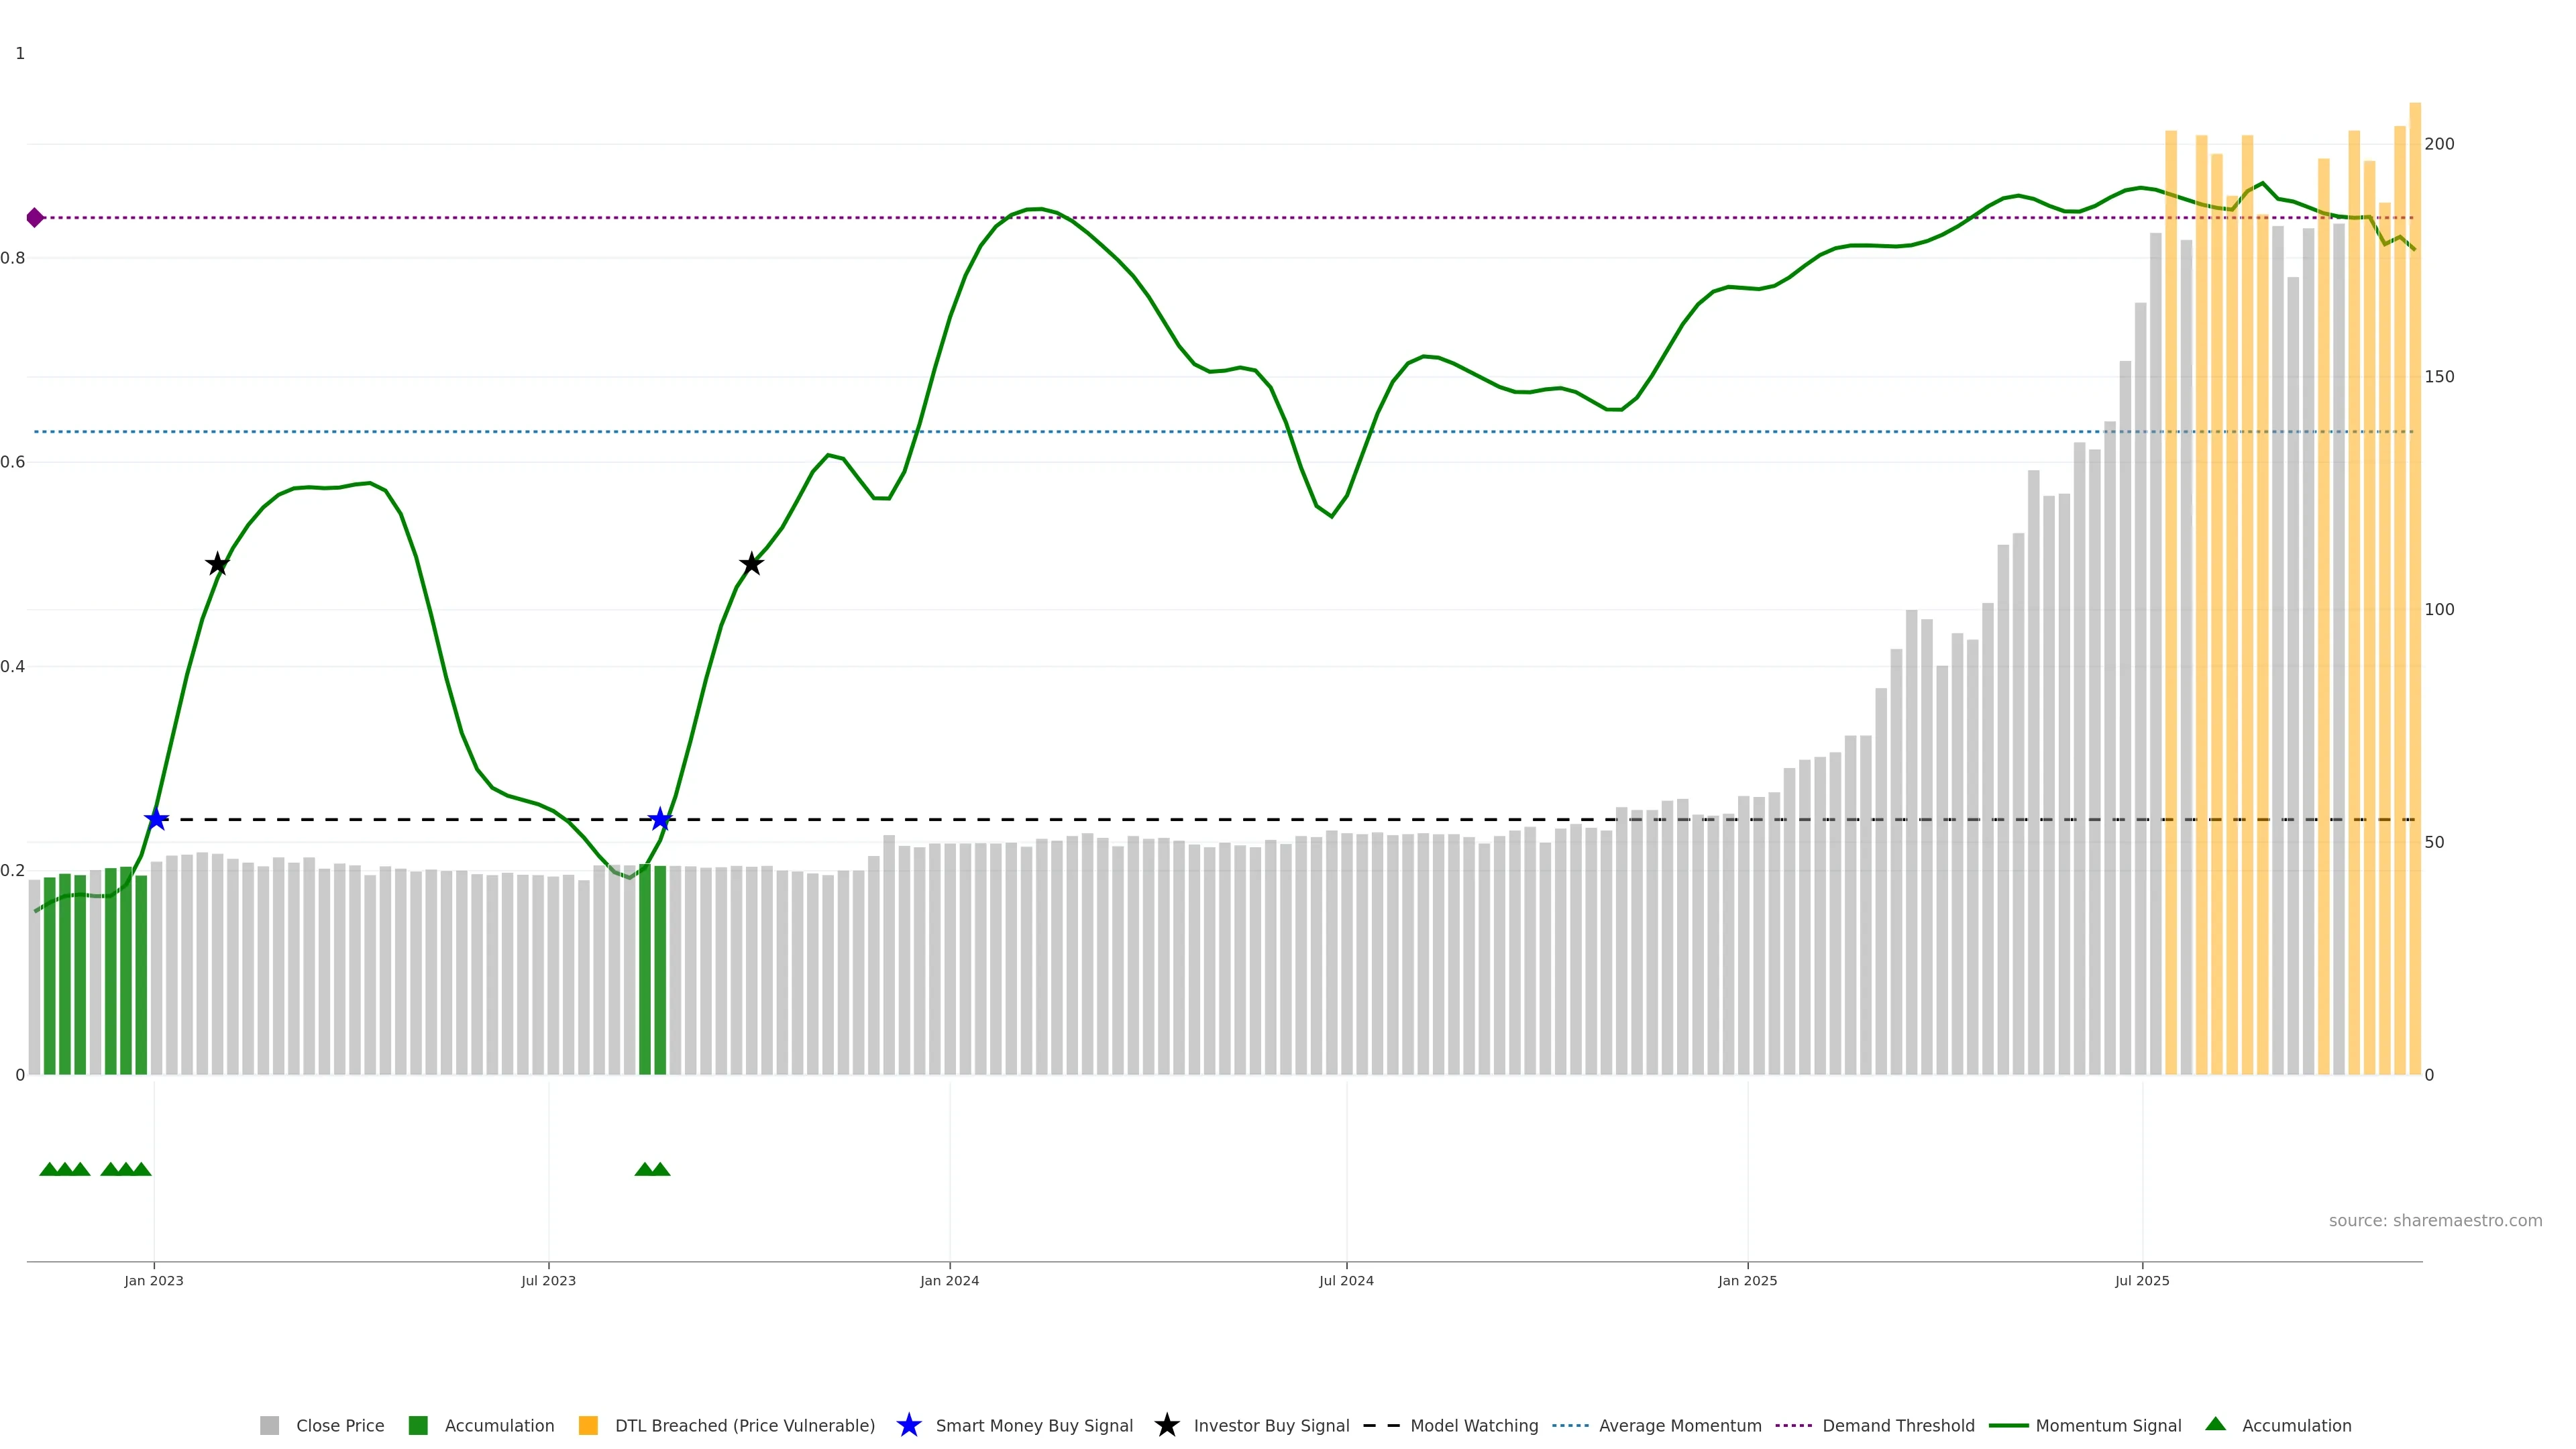
Smart Money
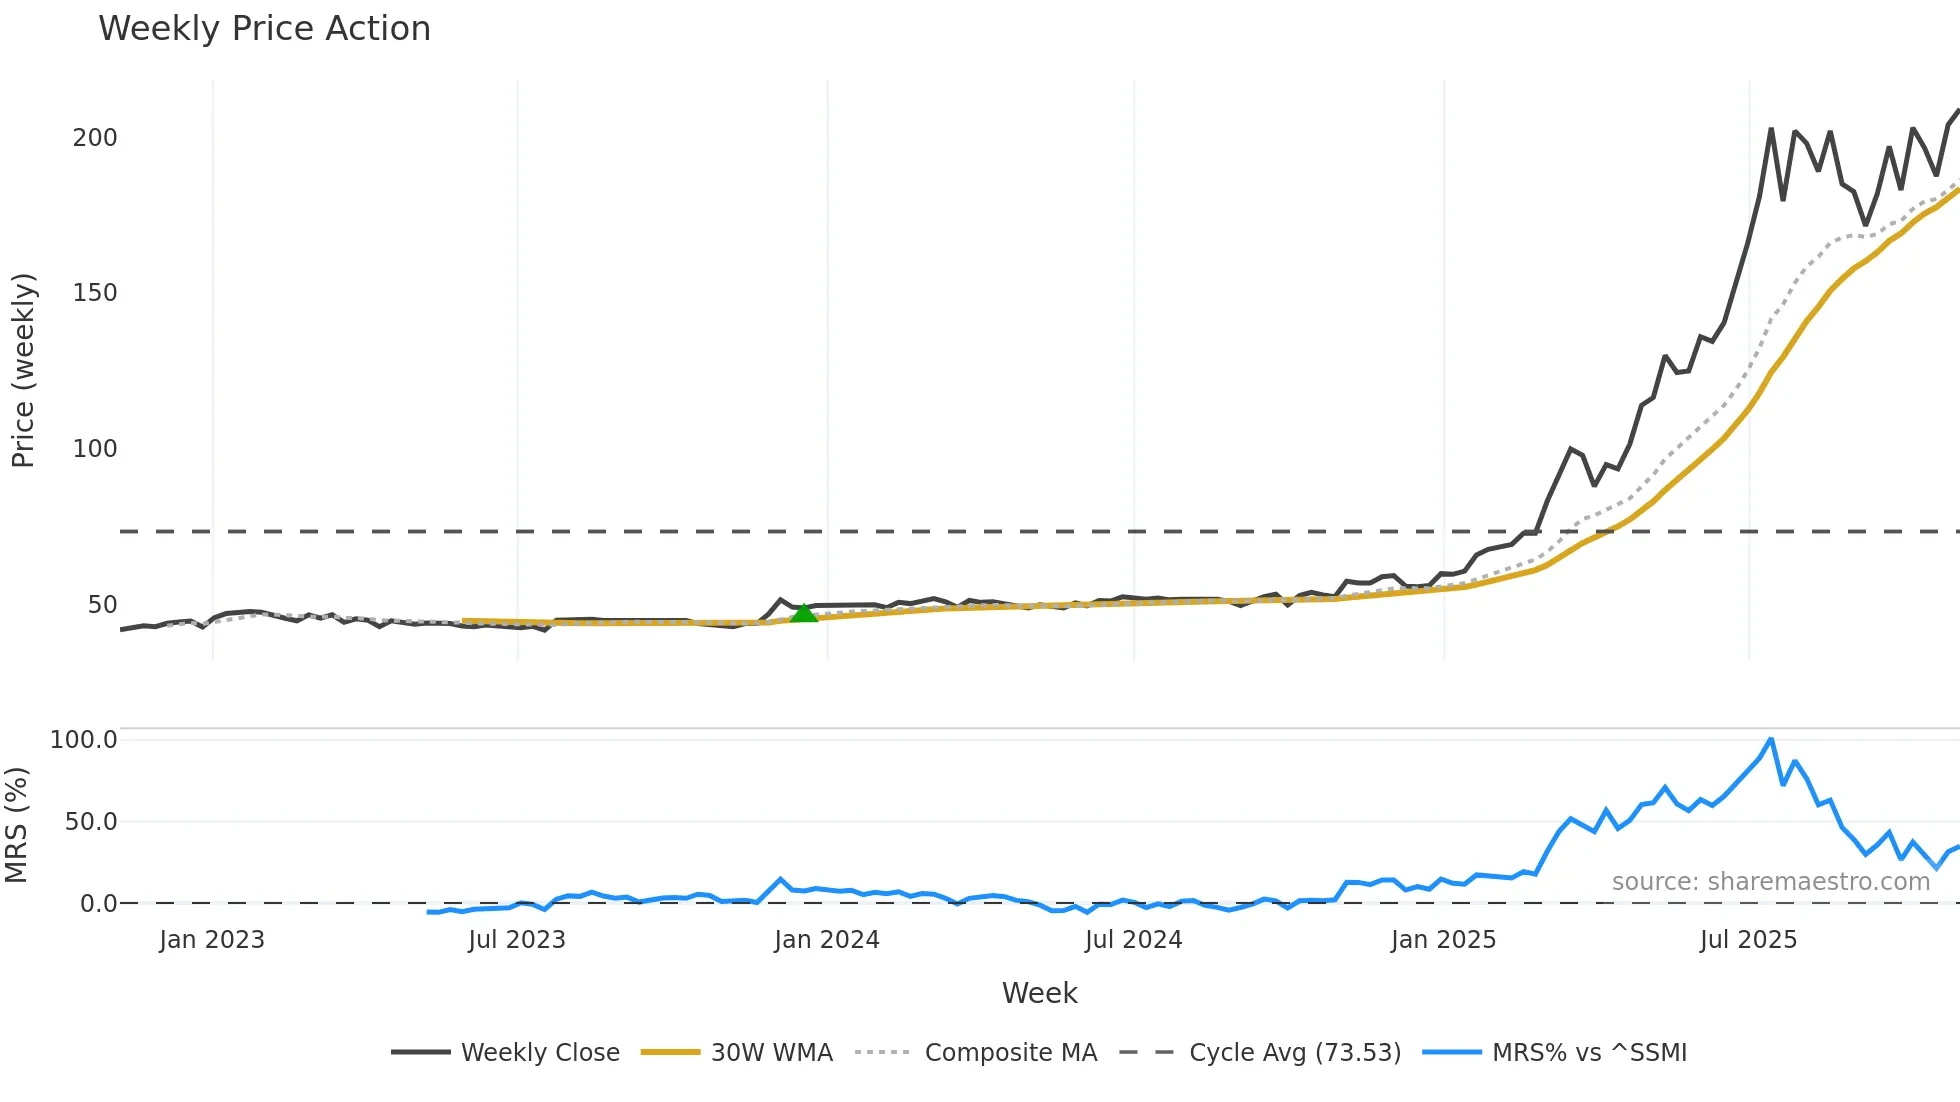
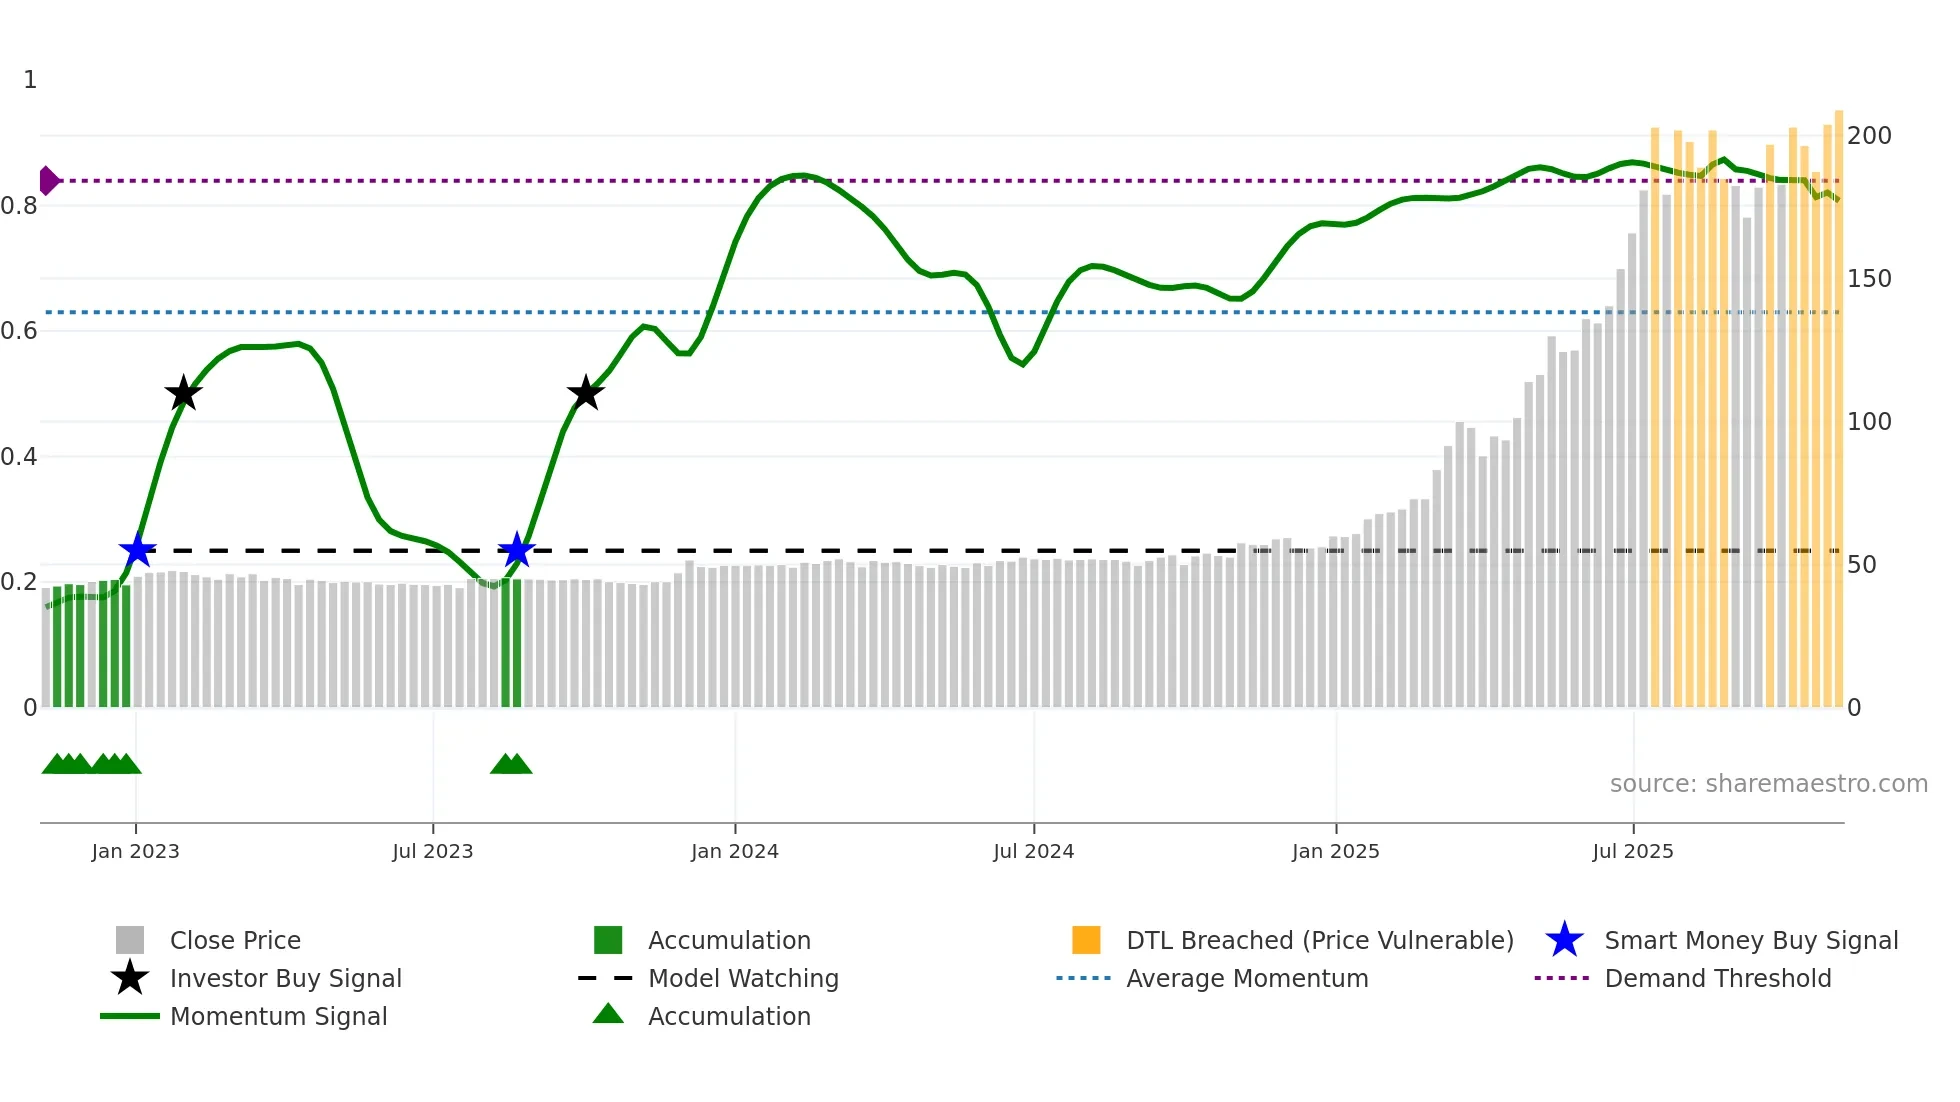
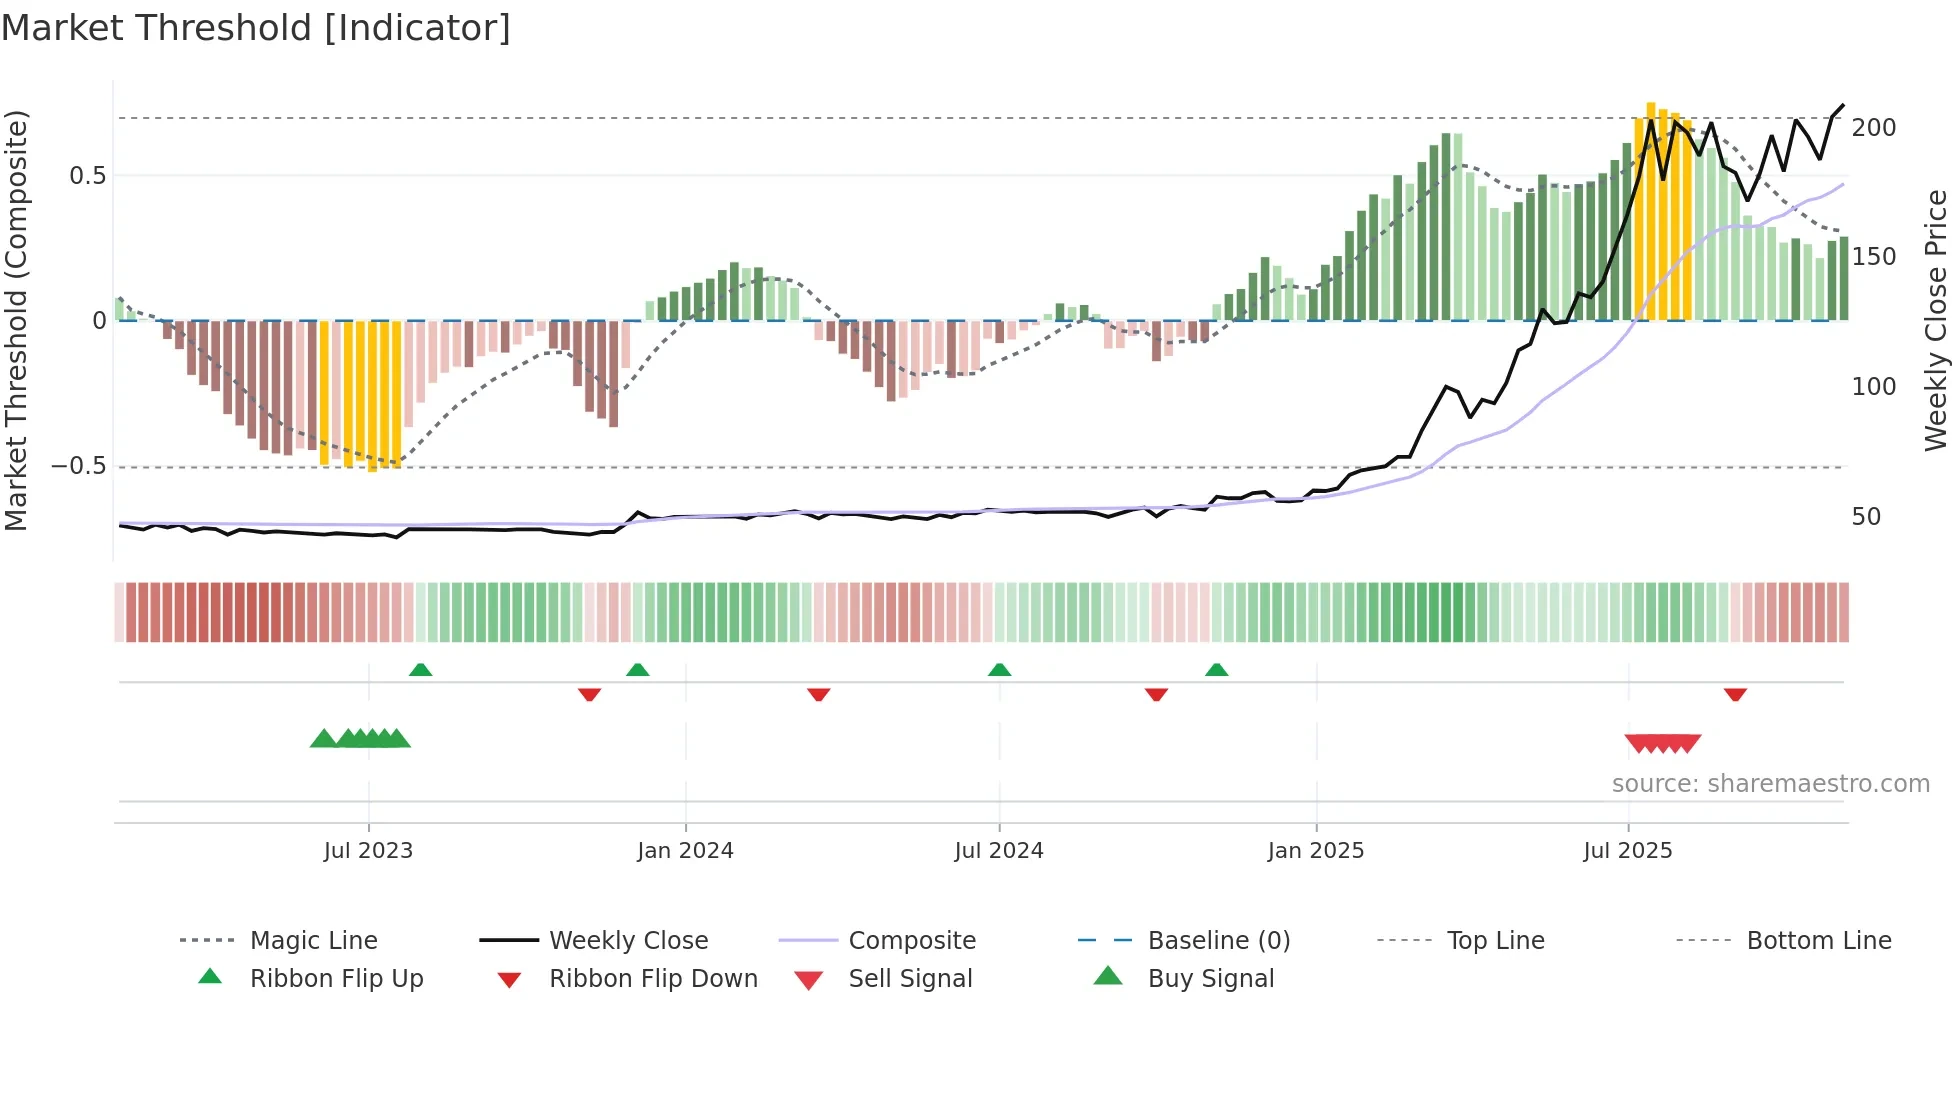
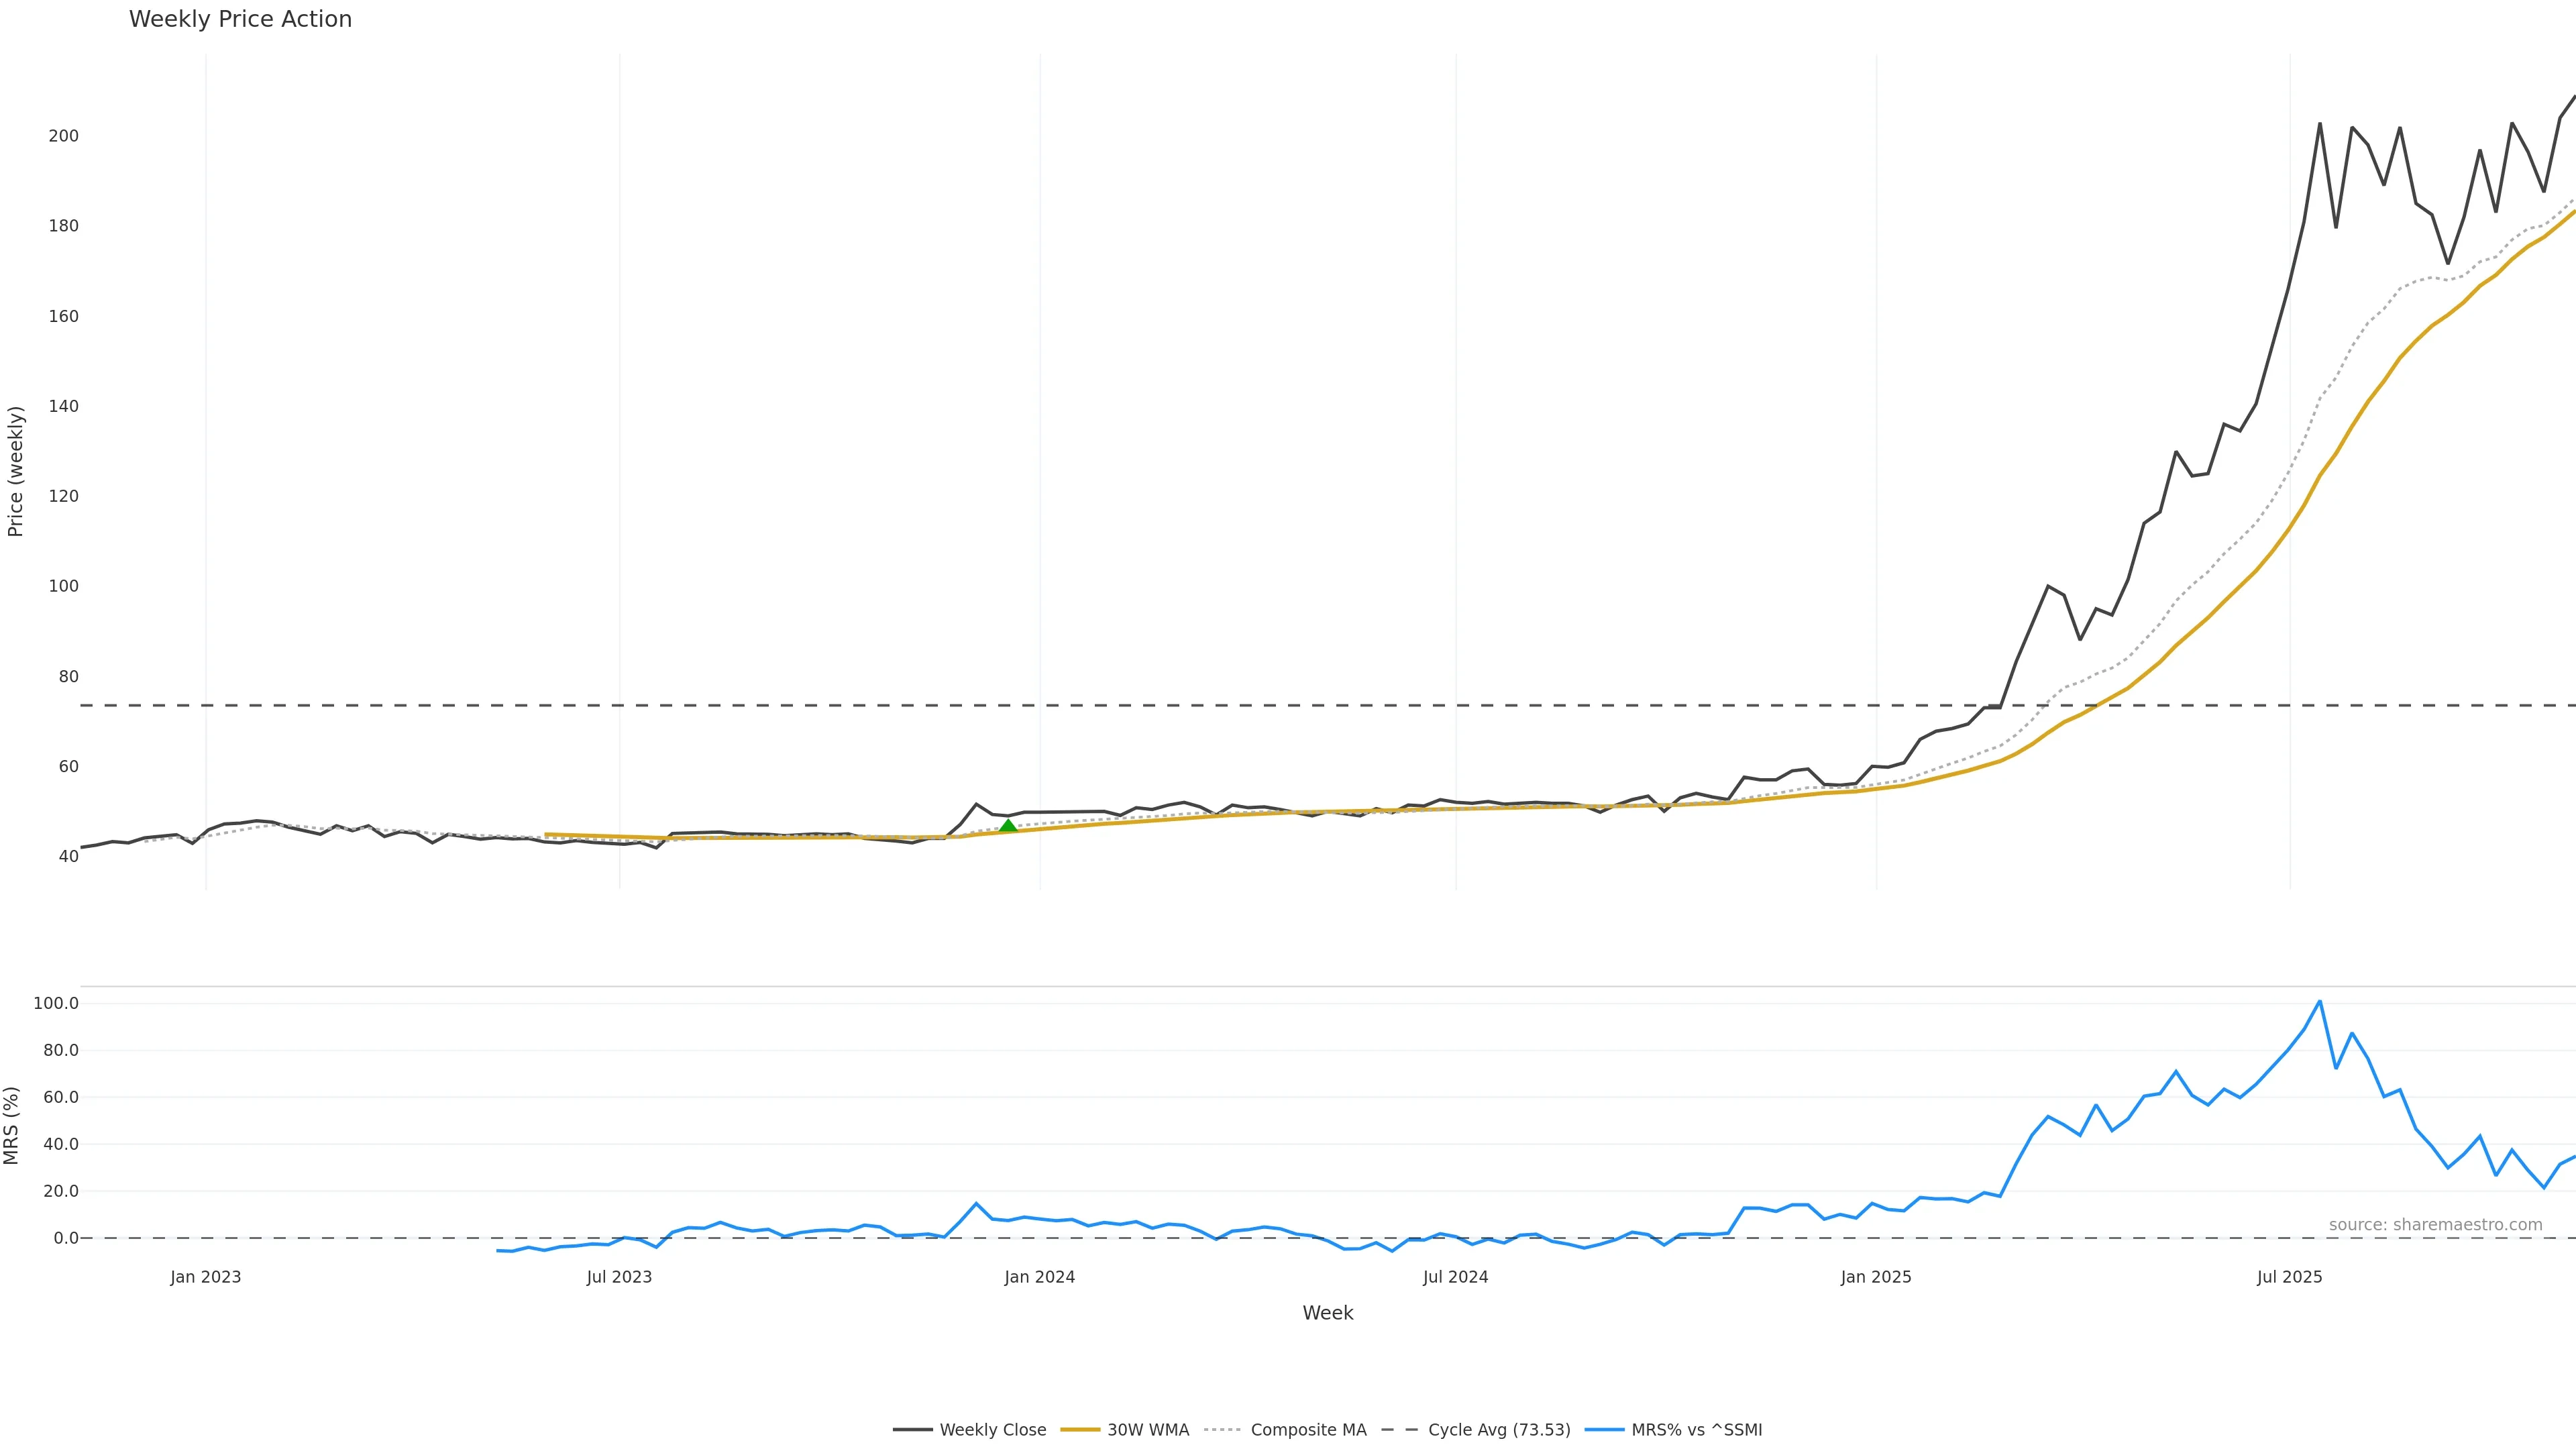
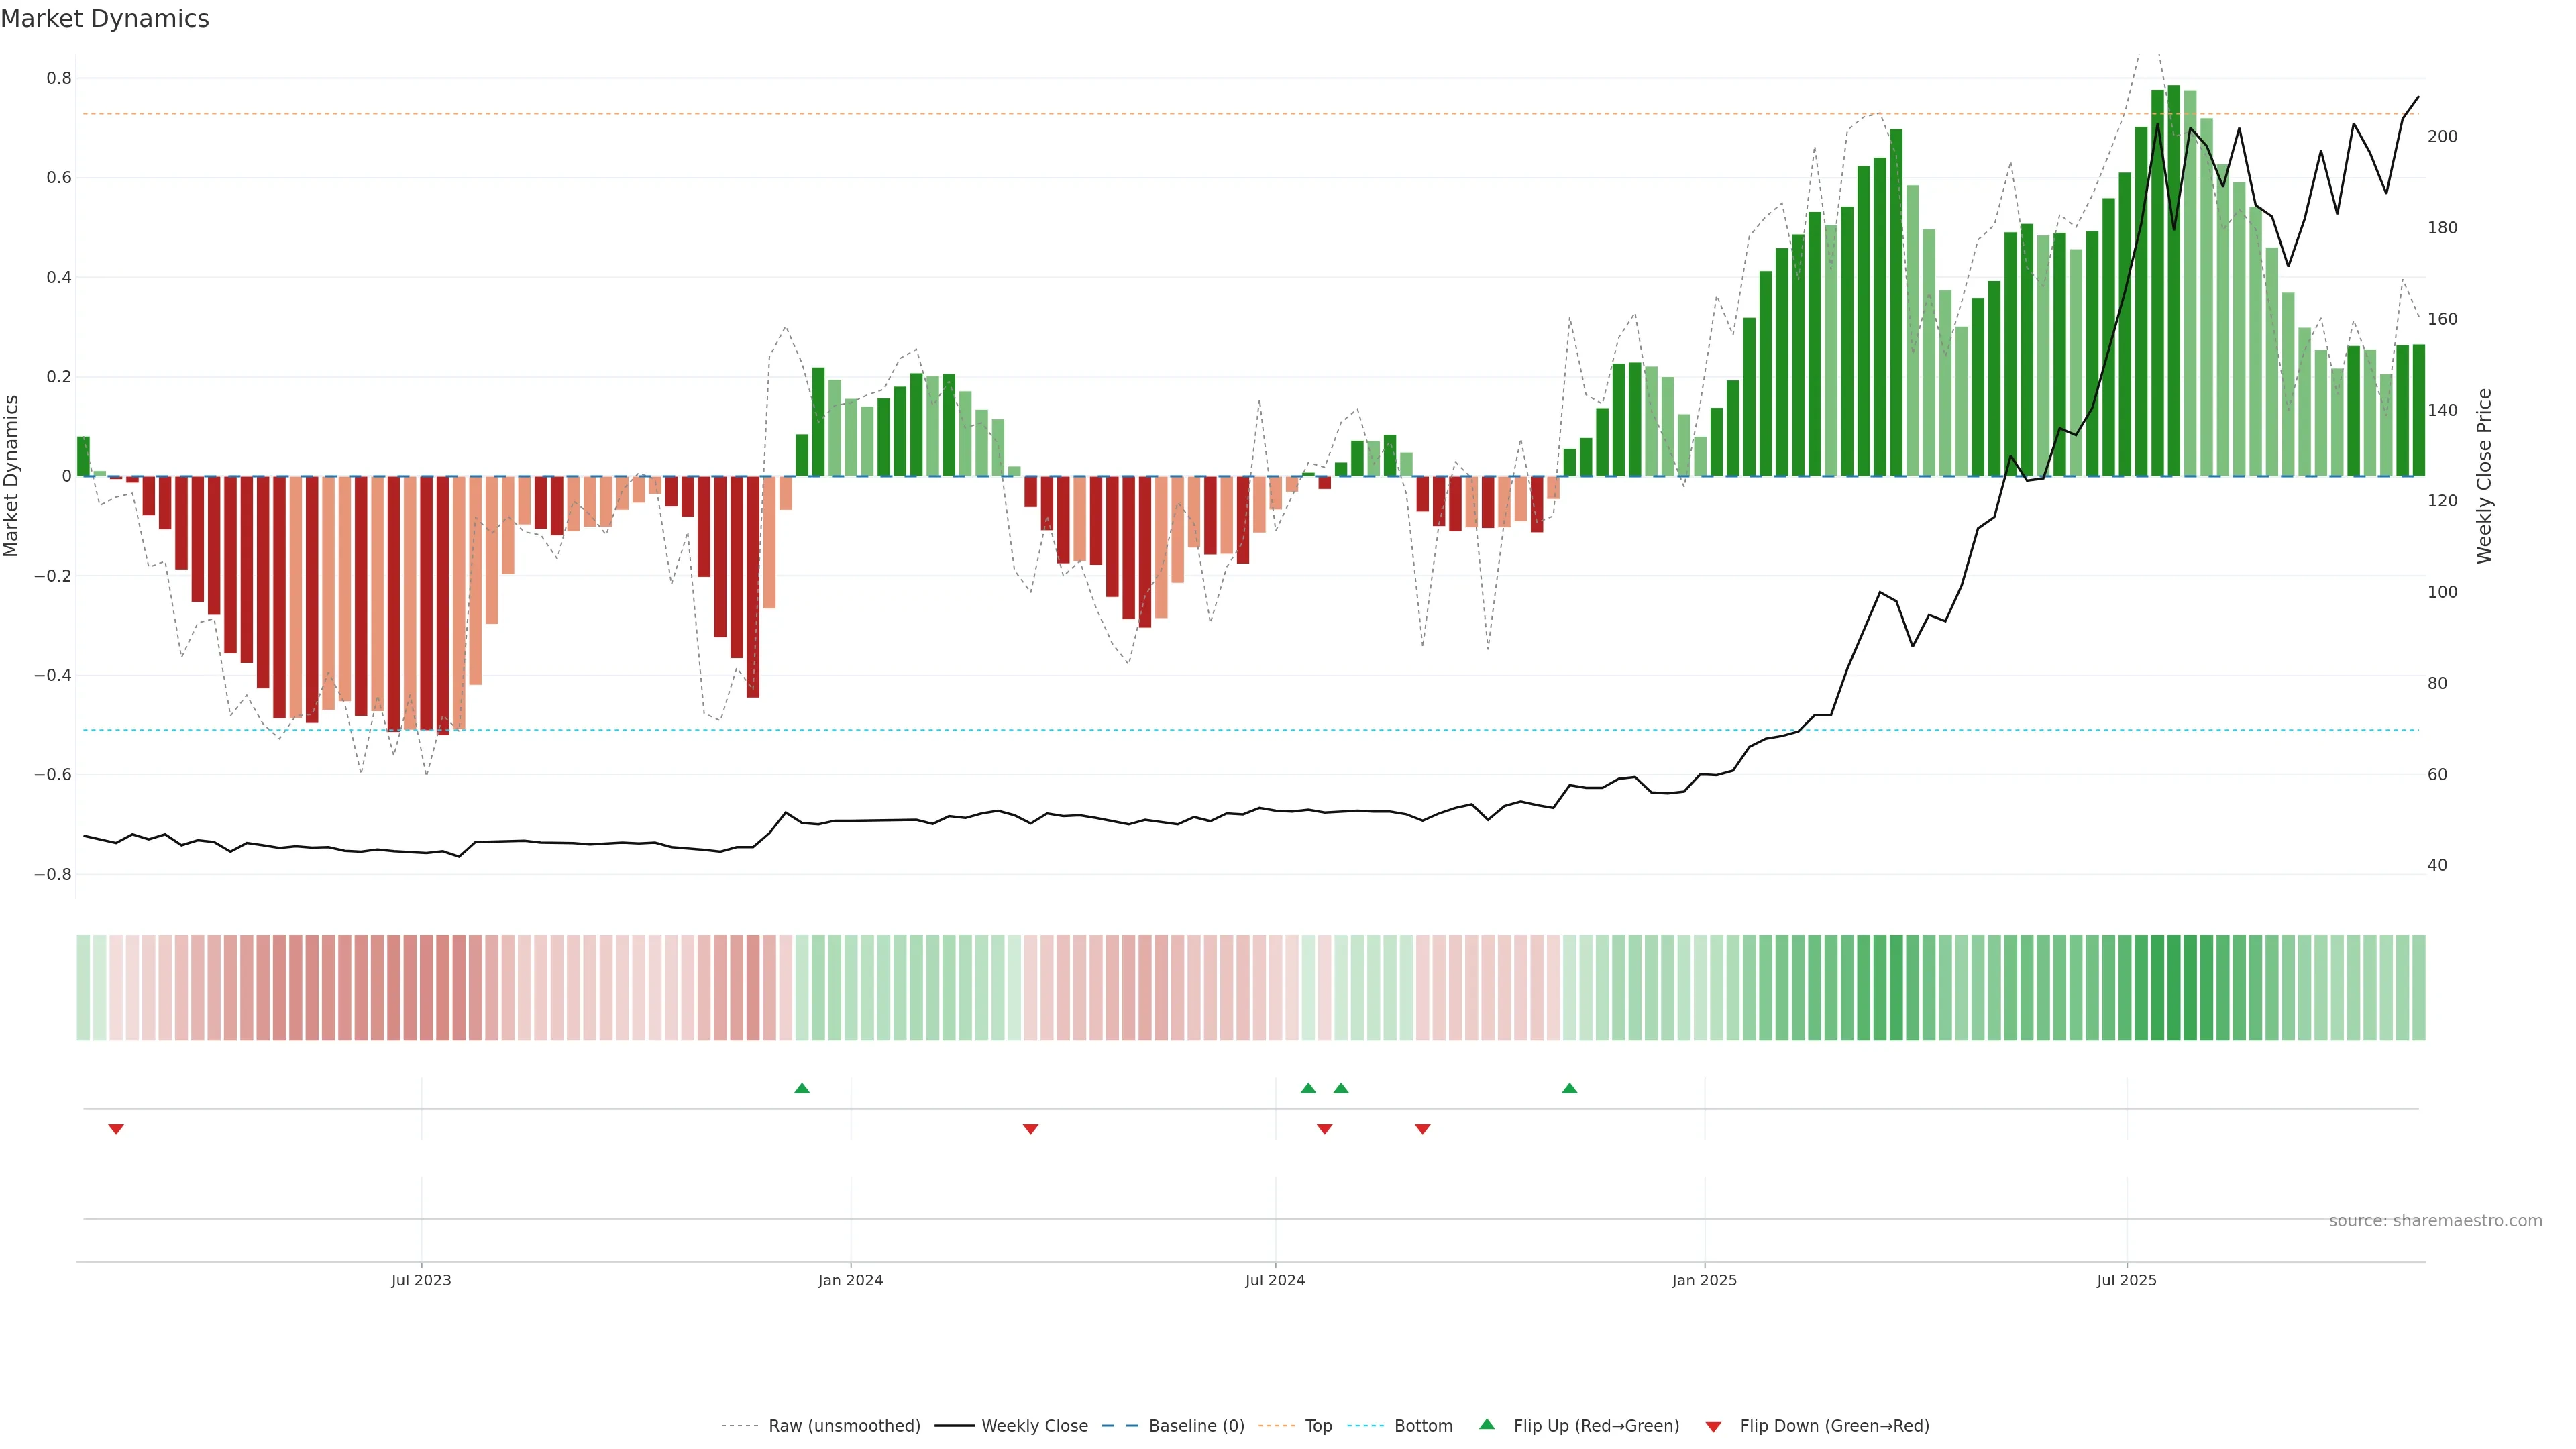
Smoothed trend is elevated and flattening. — Raised risk of a Demand Threshold breach if price runs hot.
Score -0.4
+0 / -1
Smoothed trend is elevated and flattening.
Smoothed trend is elevated and flattening. Raised risk of a Demand Threshold breach if price runs hot. In essence this reflects institutional activity / accumulation-distribution patterns with a bearish tilt.
pol -0.4
conf 0.55
moderate · medium
What it means
Smoothed trend is elevated and flattening. Raised risk of a Demand Threshold breach if price runs hot. In essence this reflects institutional activity / accumulation-distribution patterns with a bearish tilt.
Implications
Raises risk of failed breakouts; strength must prove itself on closes. (pol -0.40, conf 0.55 → moderate/medium)
No additional observations.