Fujian Acetron New Materials Co., Ltd.
300706 SHE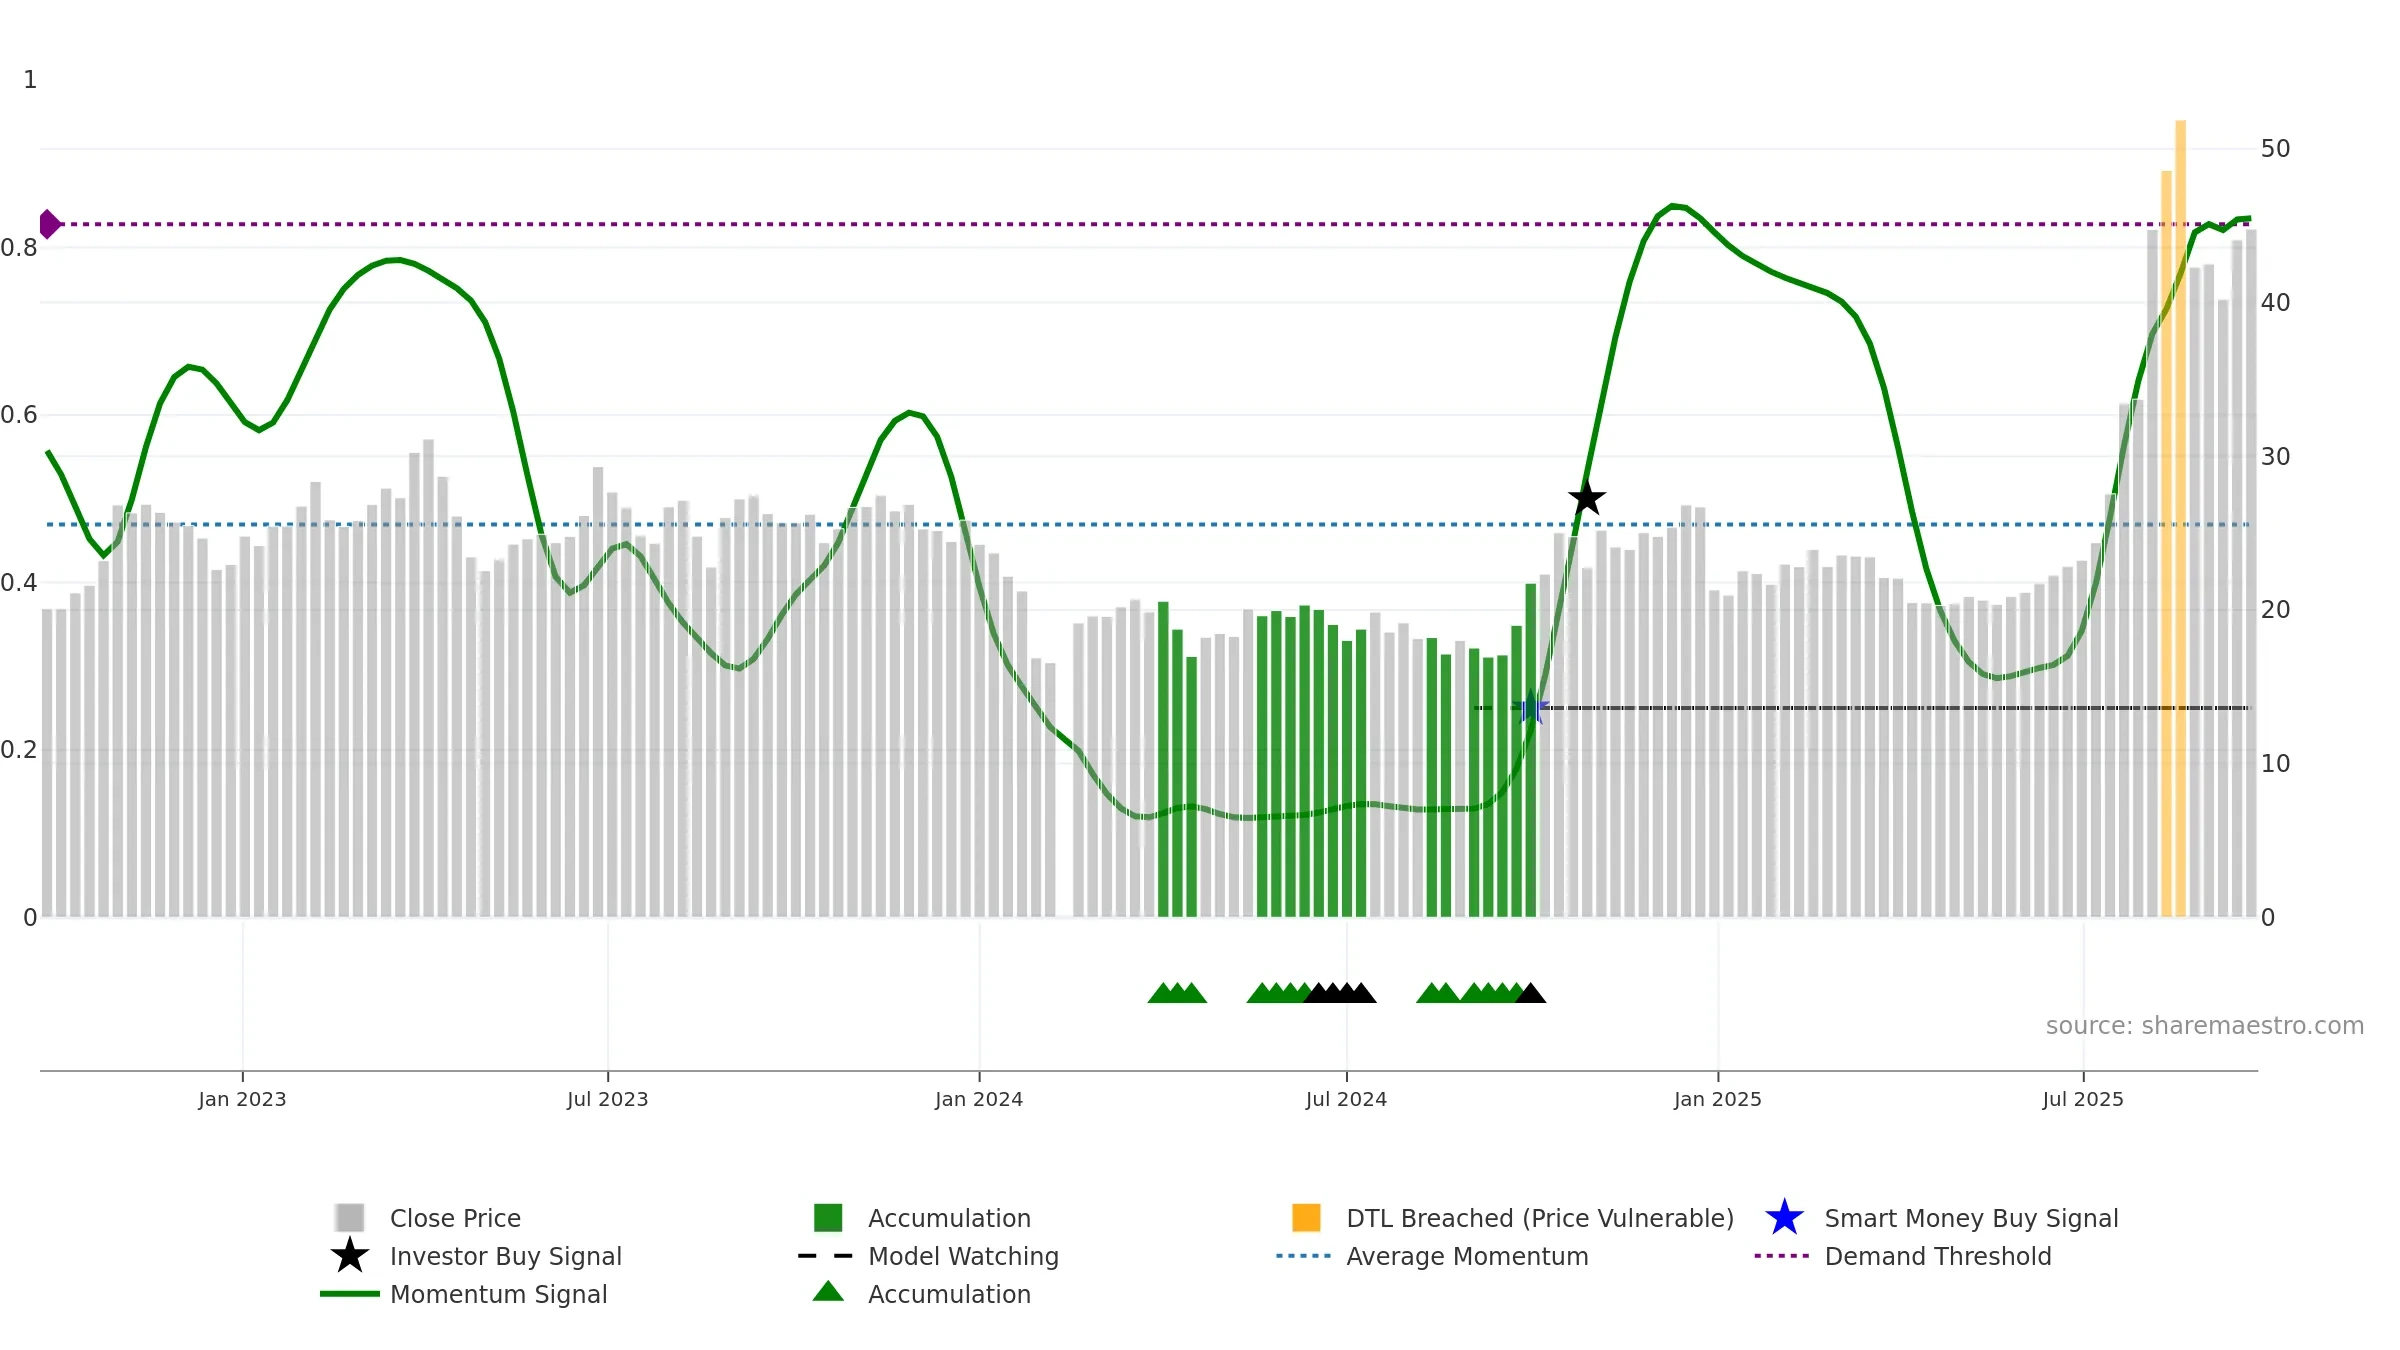
Weekly Summary
Fujian Acetron New Materials Co., Ltd. closed at 44.7800 (2.05% WoW) . Data window ends Mon, 22 Sep 2025.
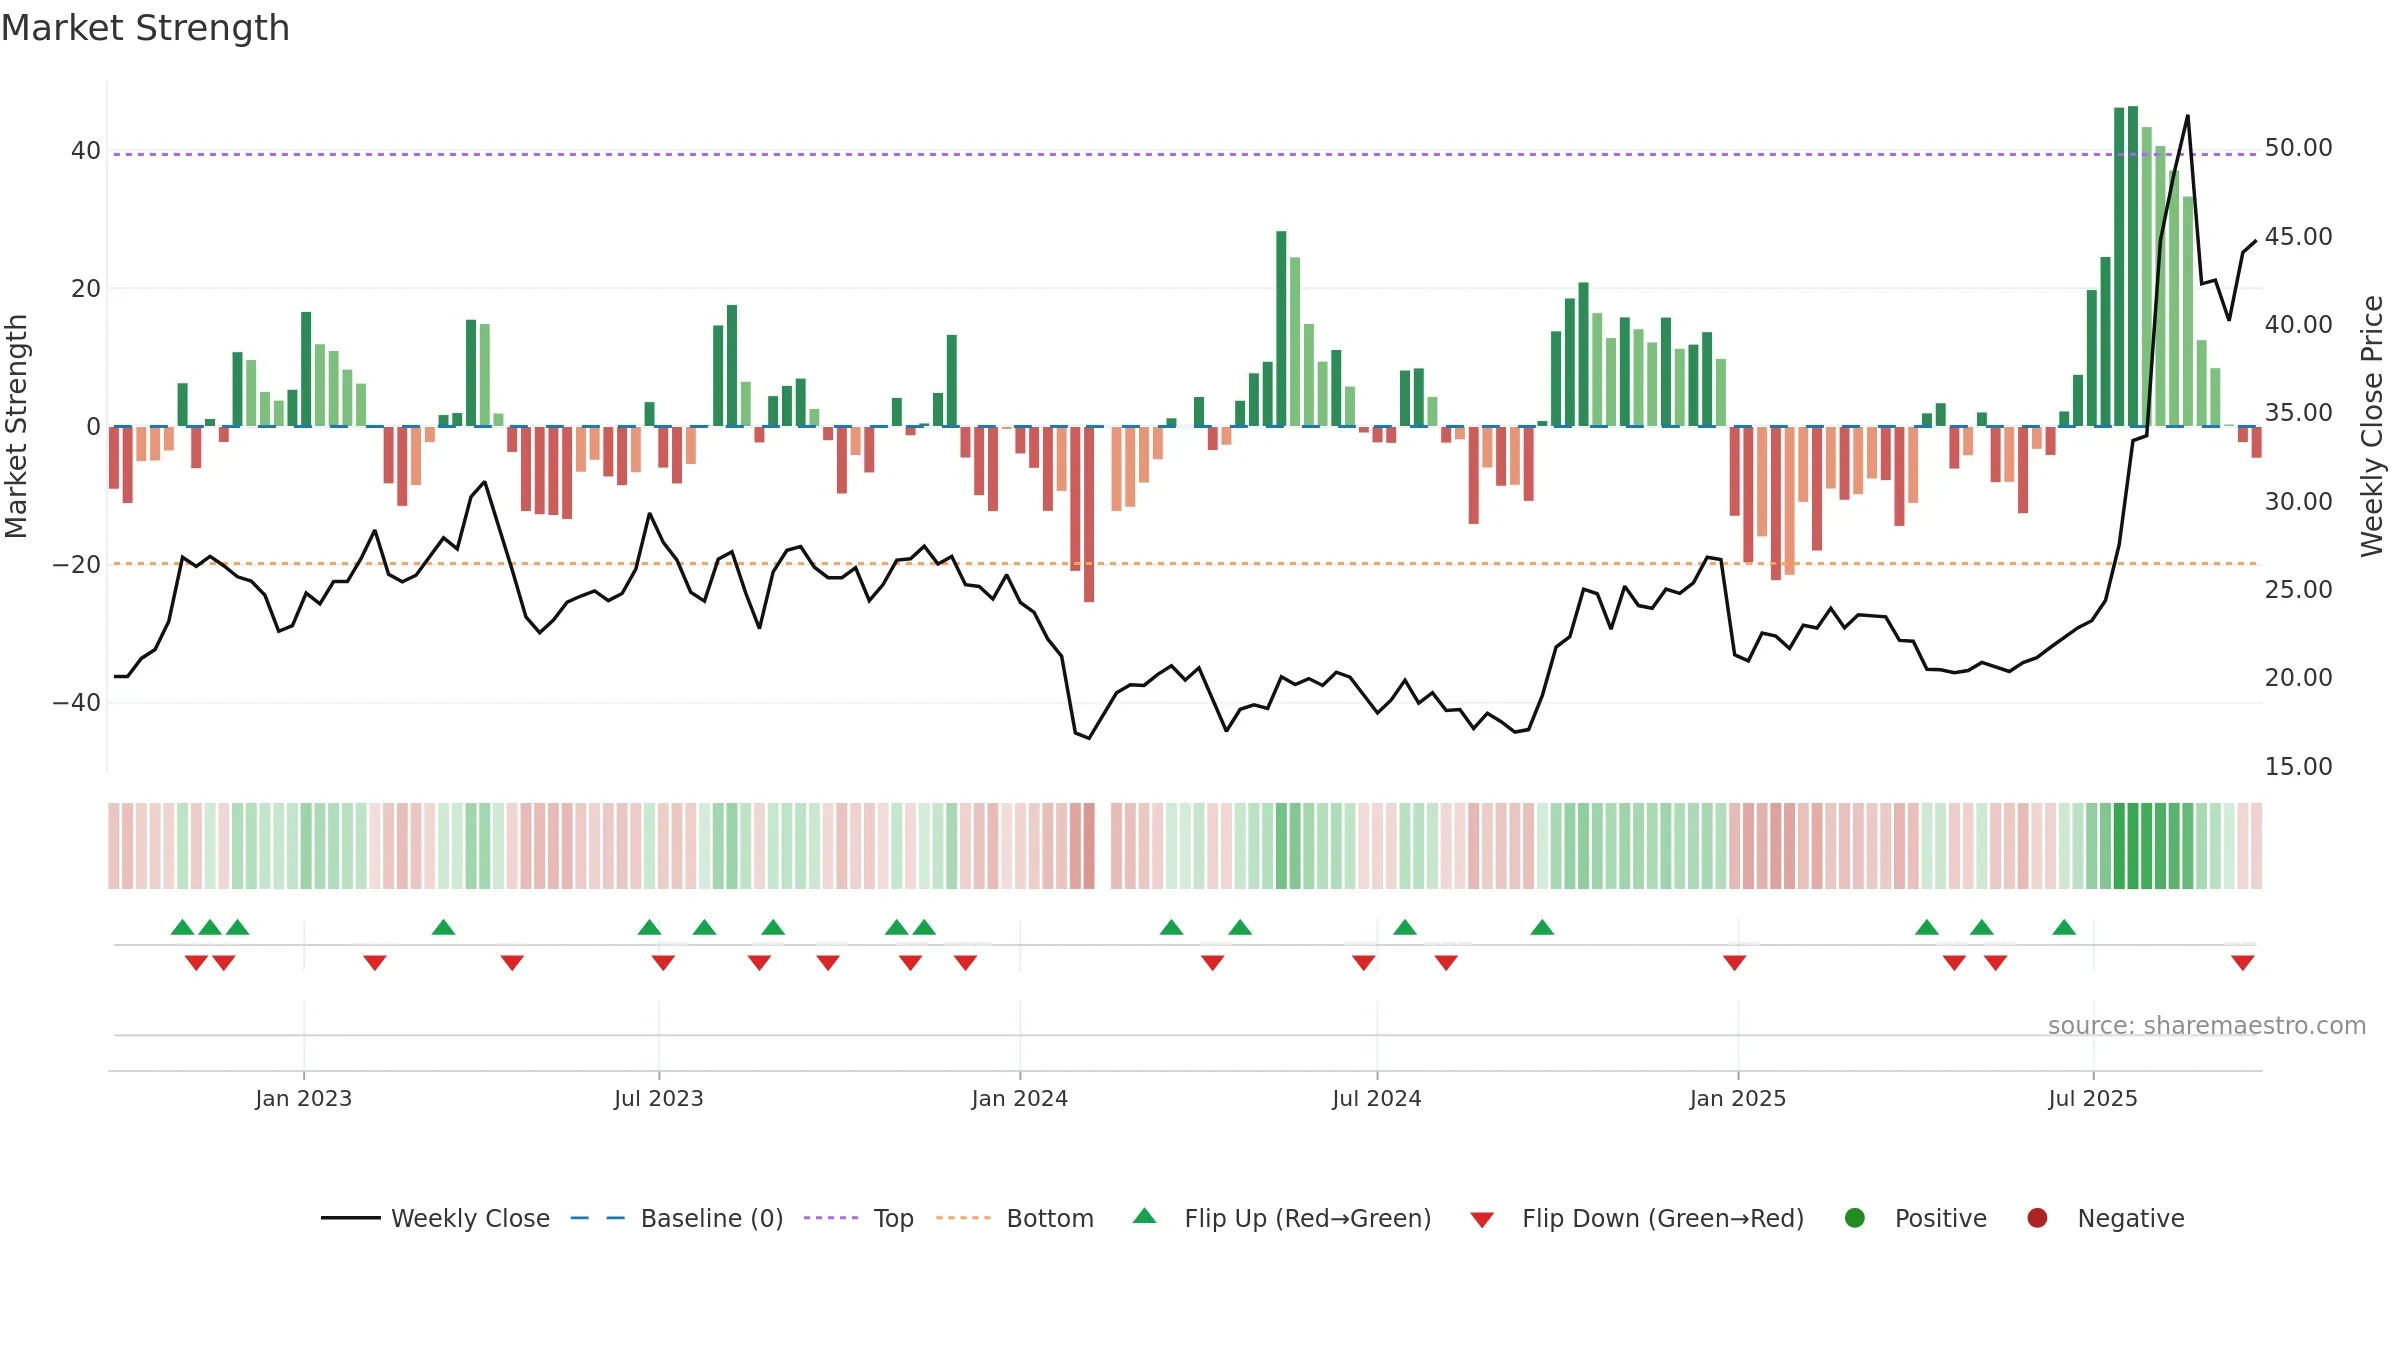
How to read this — Price slope is downward, indicating persistent supply pressure. Elevated weekly volatility increases whipsaw risk. Volume and price are moving in the same direction — a constructive confirmation. Returns are positively correlated with volume — strength tends to arrive on higher activity. Distance to baseline is narrowing — reverting closer to its fair-value track.
Down-slope argues for patience; rallies can fade sooner unless participation improves.
Gauge maps the trend signal to a 0–100 scale.
How to read this — Range-bound conditions; conviction is limited until a break or acceleration emerges.
Wait for a directional break or improving acceleration.

Relative strength is Positive
(> 0%, outperforming).
Latest MRS: 37.00% (week ending Fri, 19 Sep 2025).
Slope: Rising over 8w.
Notes:
- Holding above the zero line indicates relative bid.
- MRS slope rising over ~8 weeks.
Price is above fair value; upside may be capped without catalysts.
Conclusion
Neutral setup. ★★★☆☆ confidence. Trend: Range / Neutral · 0.04% over window · vol 12.11% · liquidity convergence · posture mixed · RS outperforming
- Momentum is bullish and rising
- Liquidity confirms the price trend
- Mansfield RS: outperforming & rising
- Price is not above key averages
- High return volatility raises whipsaw risk
Why: Price window 0.04% over w. Close is -13.69% below the prior-window high. Return volatility 12.11%. Volume trend falling. Liquidity convergence with price. Trend state range / neutral. Momentum bullish and rising. Valuation limited upside without catalysts.
Tip: Most metrics include a hover tooltip where they appear in the report.