Eros International Media Limited
EROSMEDIA NSE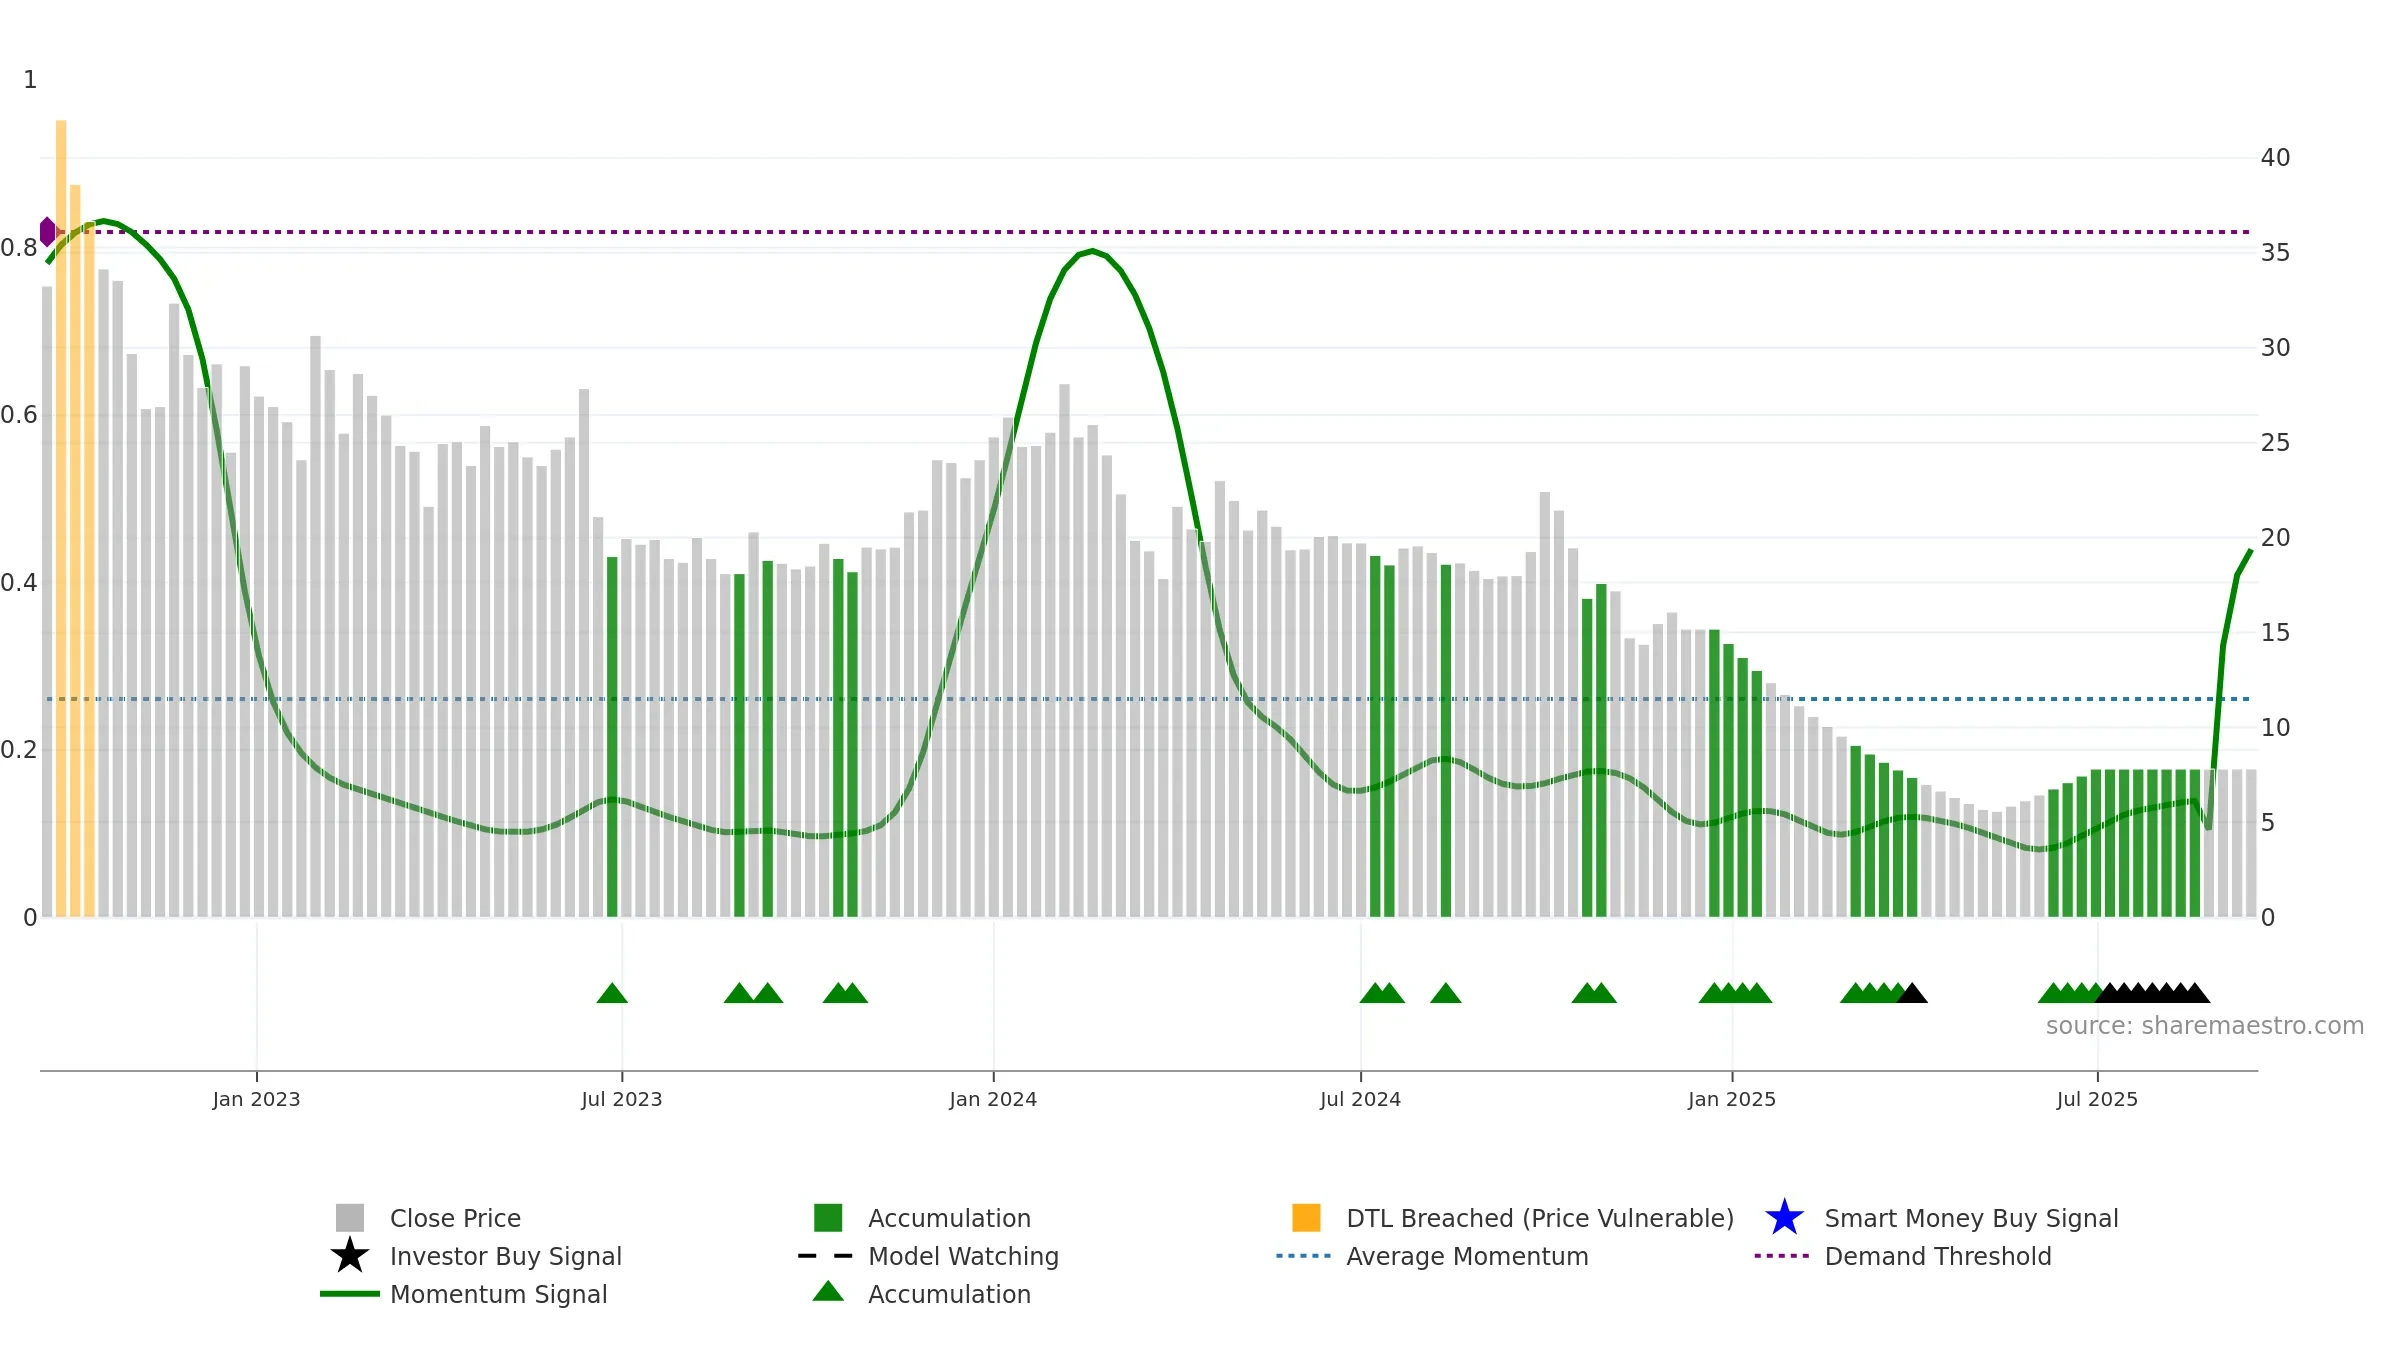
Weekly Report
Eros International Media Limited closed at 7.8100 (0.00% WoW) . Data window ends Mon, 22 Sep 2025.
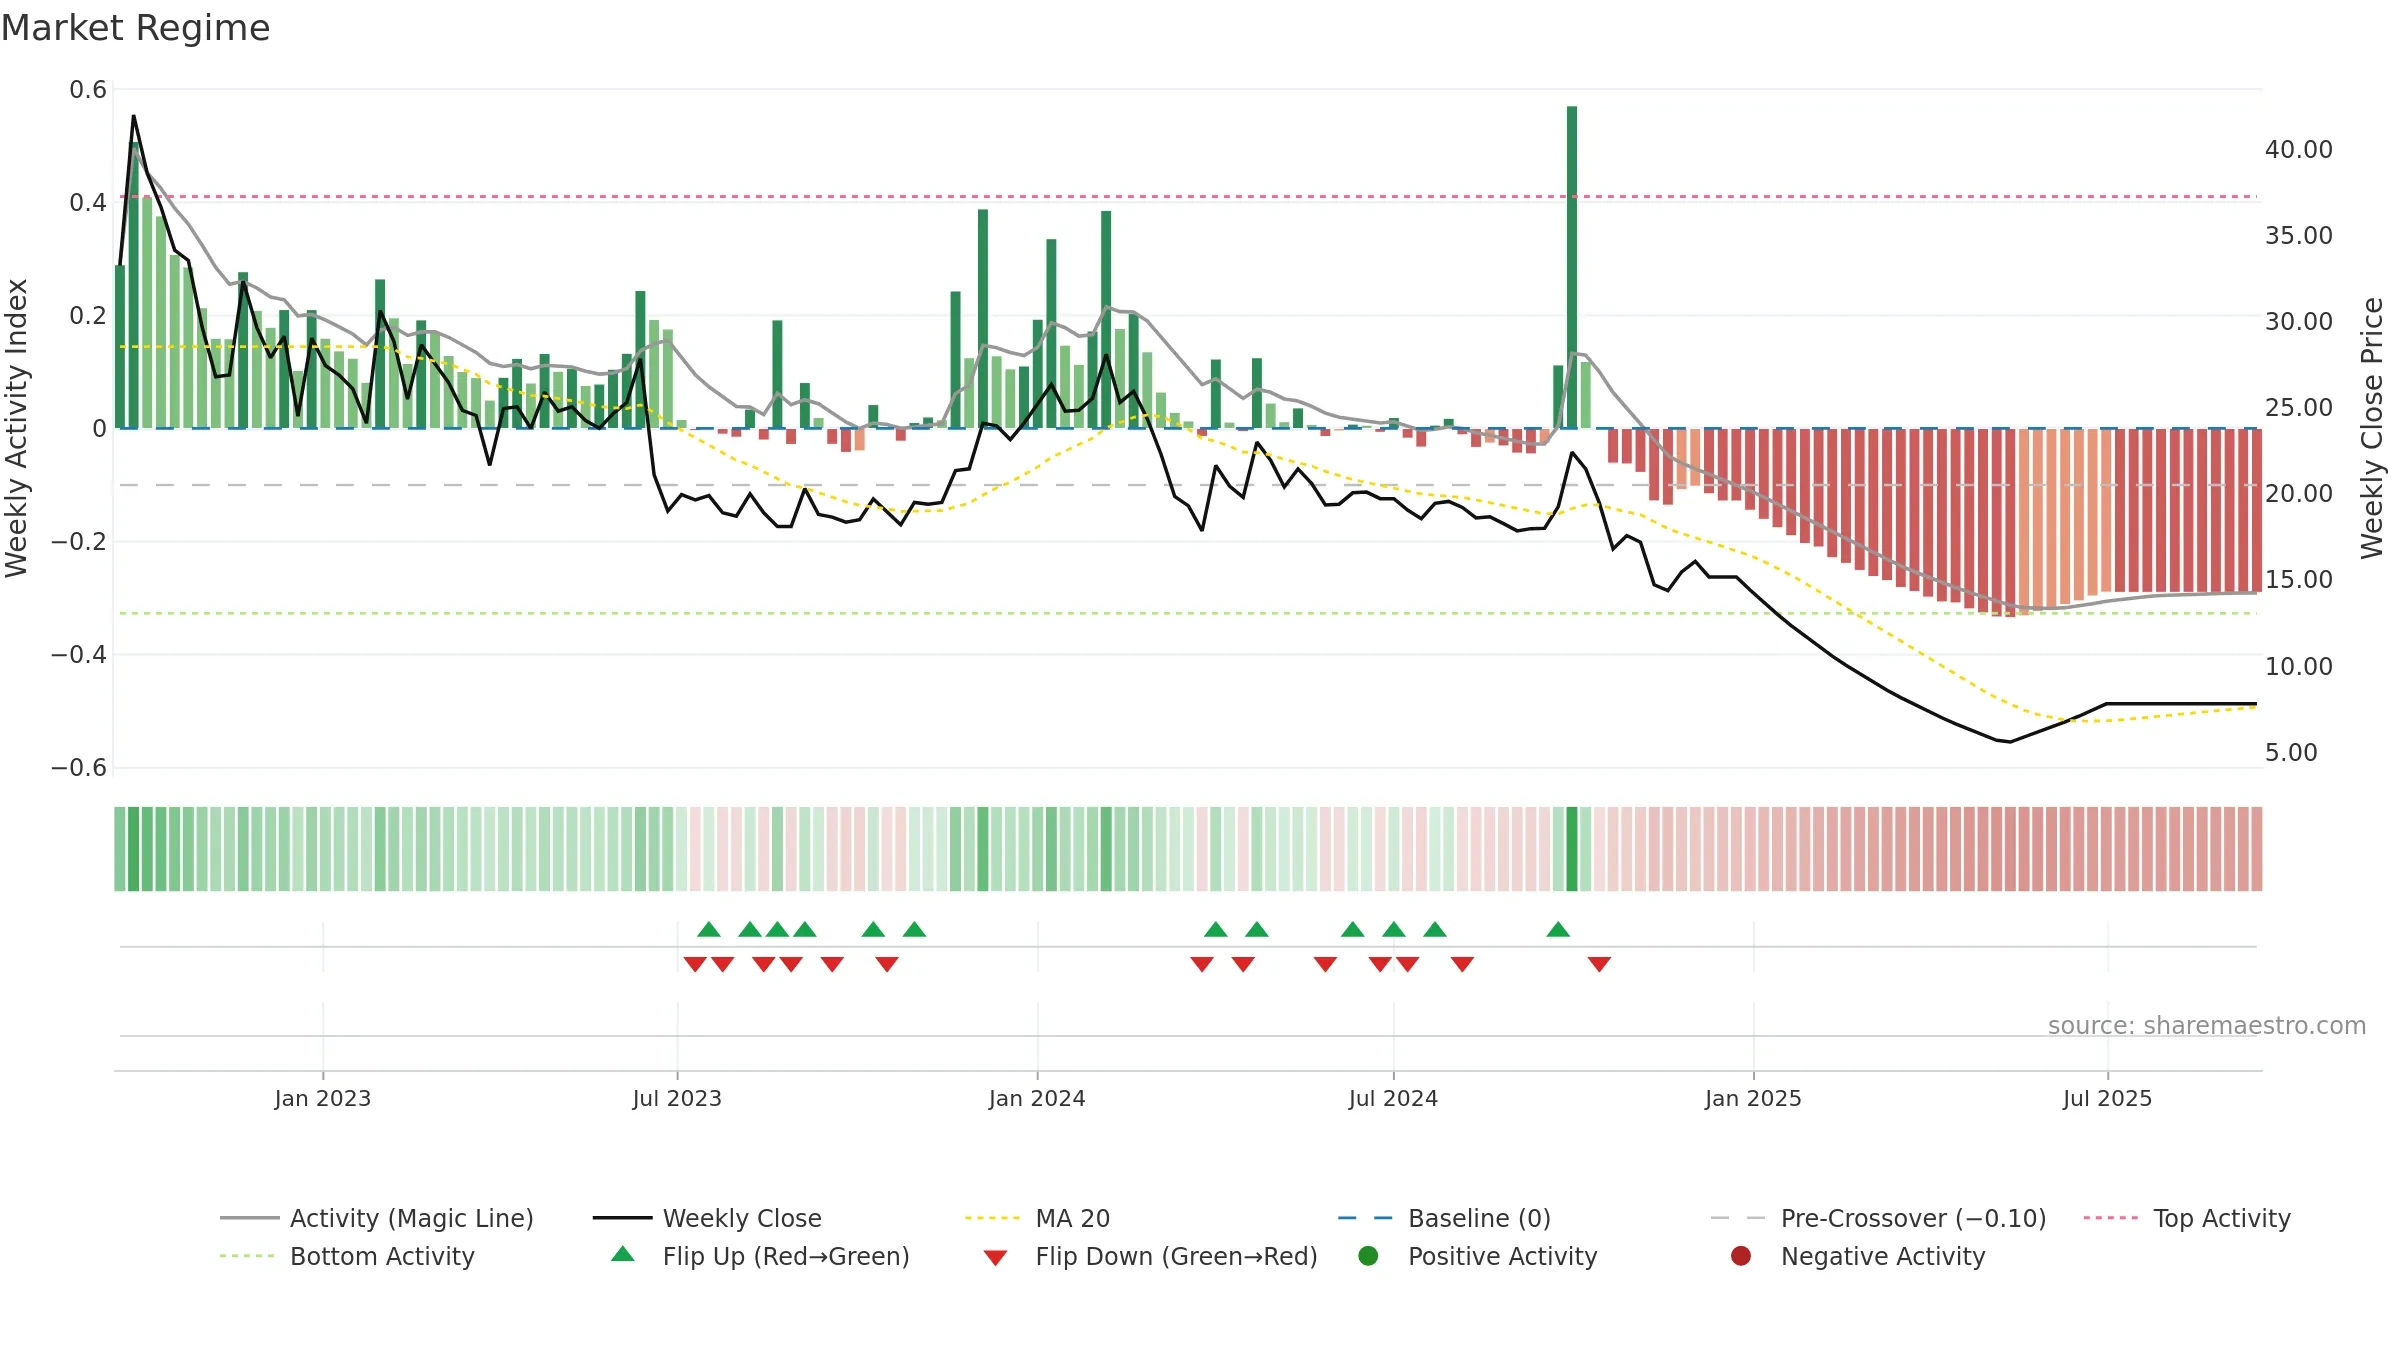
How to read this — Price slope is flat, suggesting balance between buyers and sellers. Low weekly volatility favours steadier follow-through. Volume or price is flat; confirmation from liquidity is limited.
Flat slope suggests a wait-and-see approach until the balance shifts.
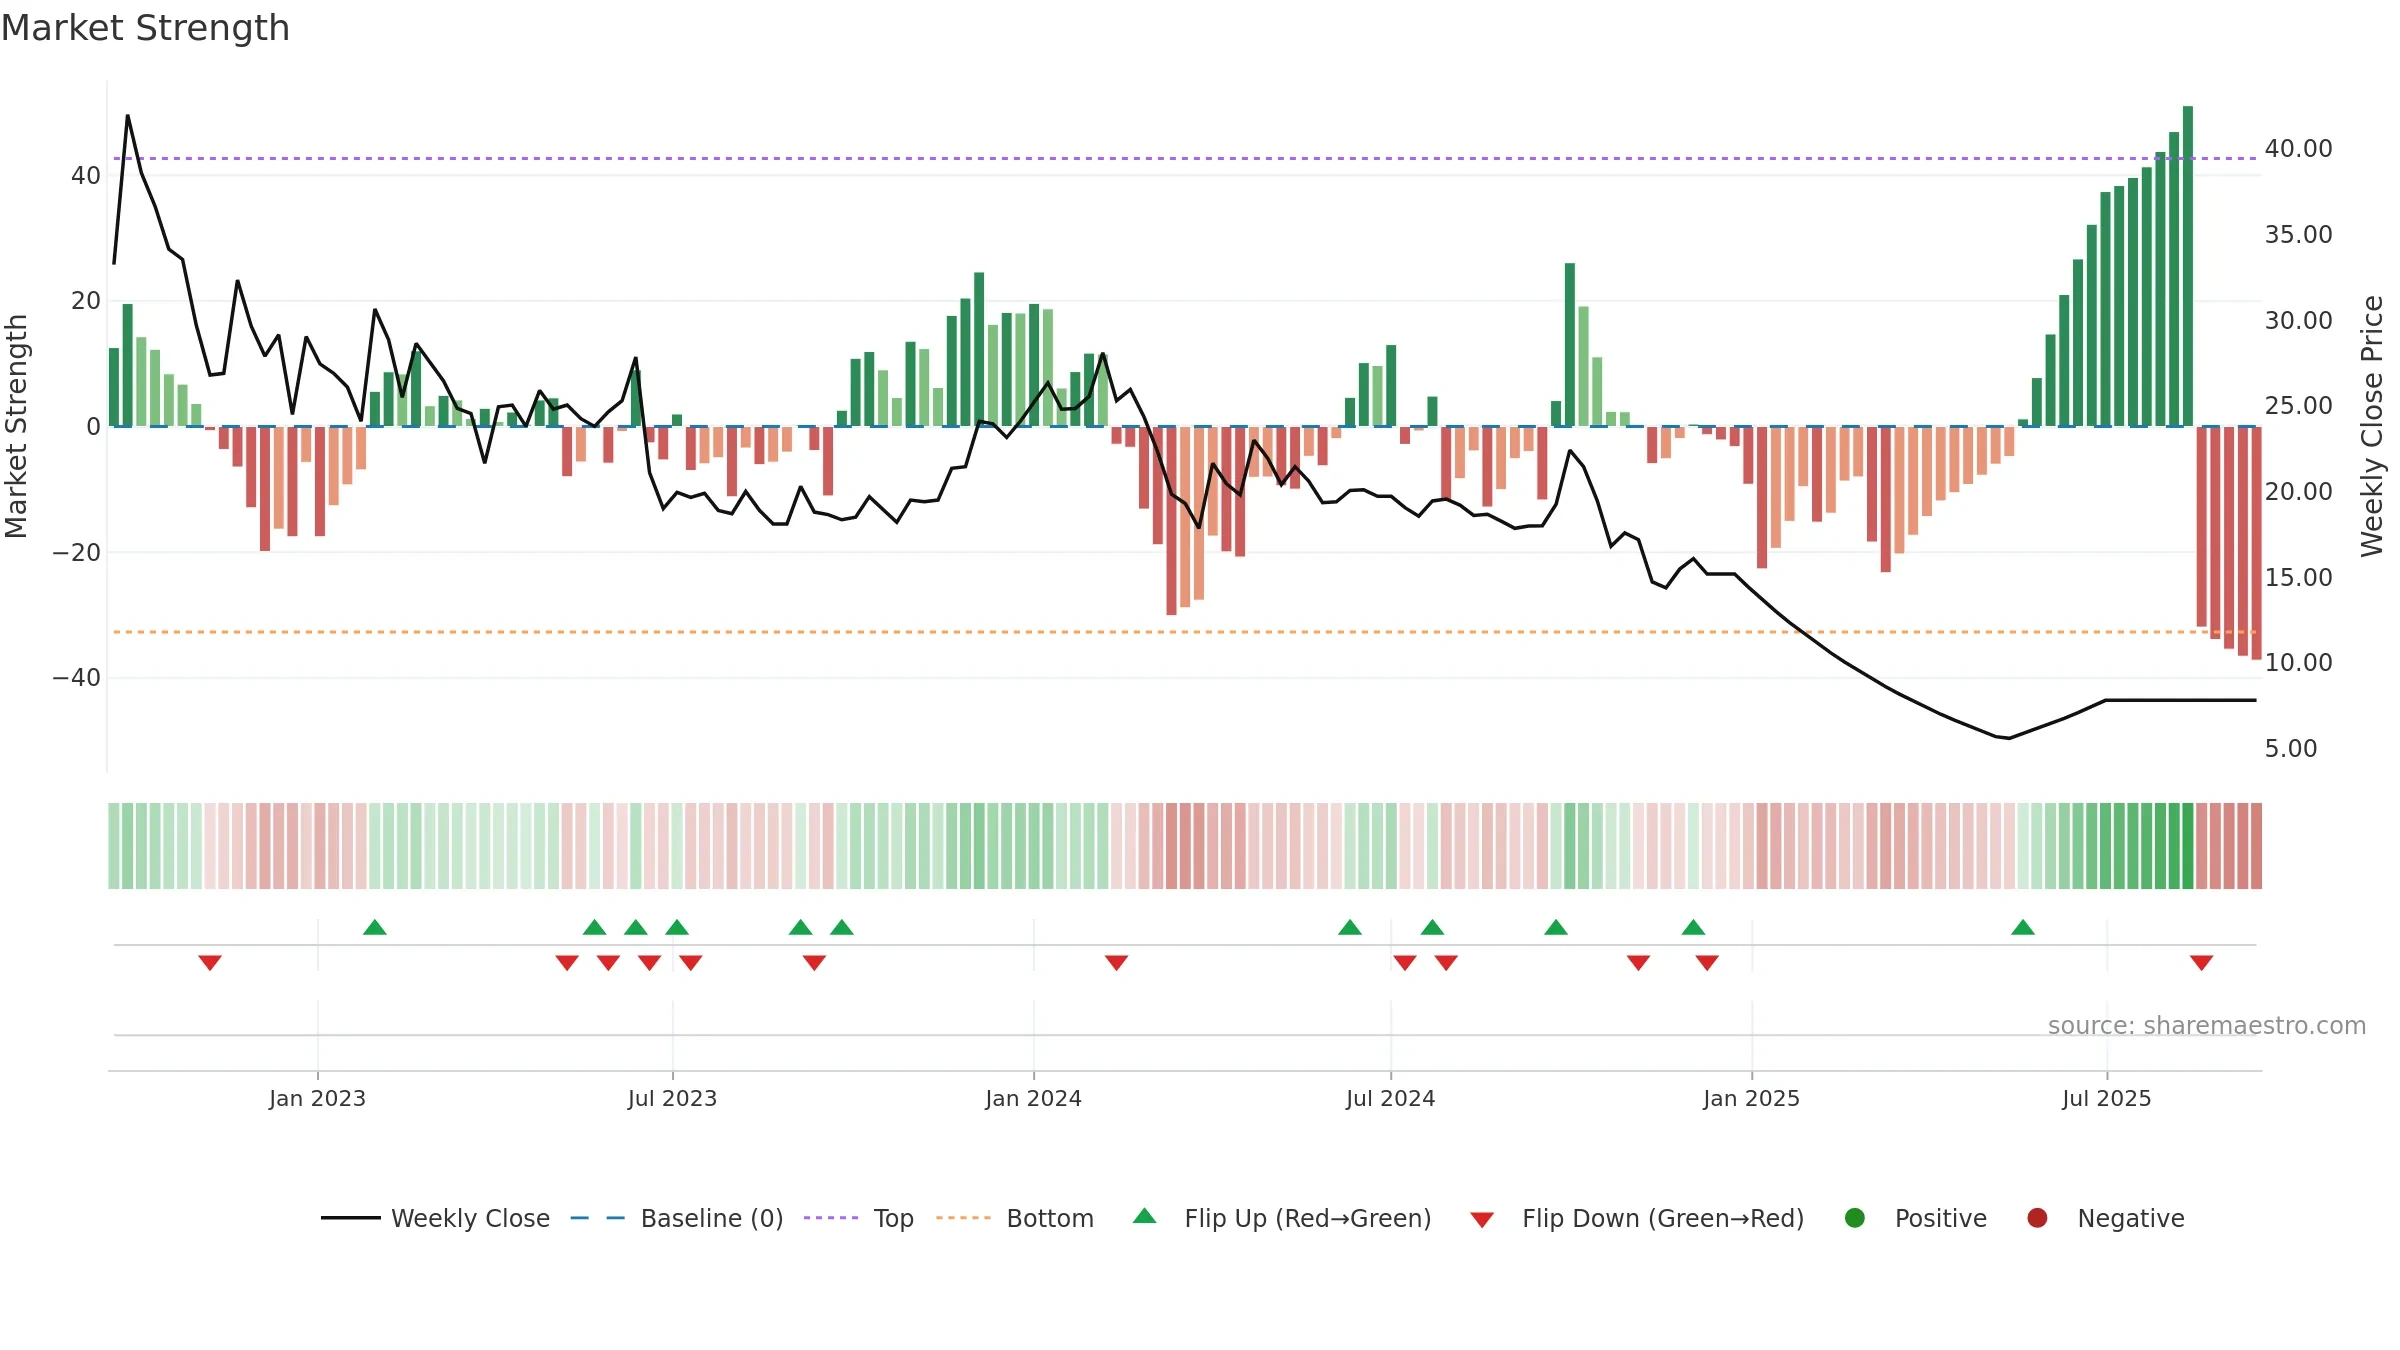
Gauge maps the trend signal to a 0–100 scale.
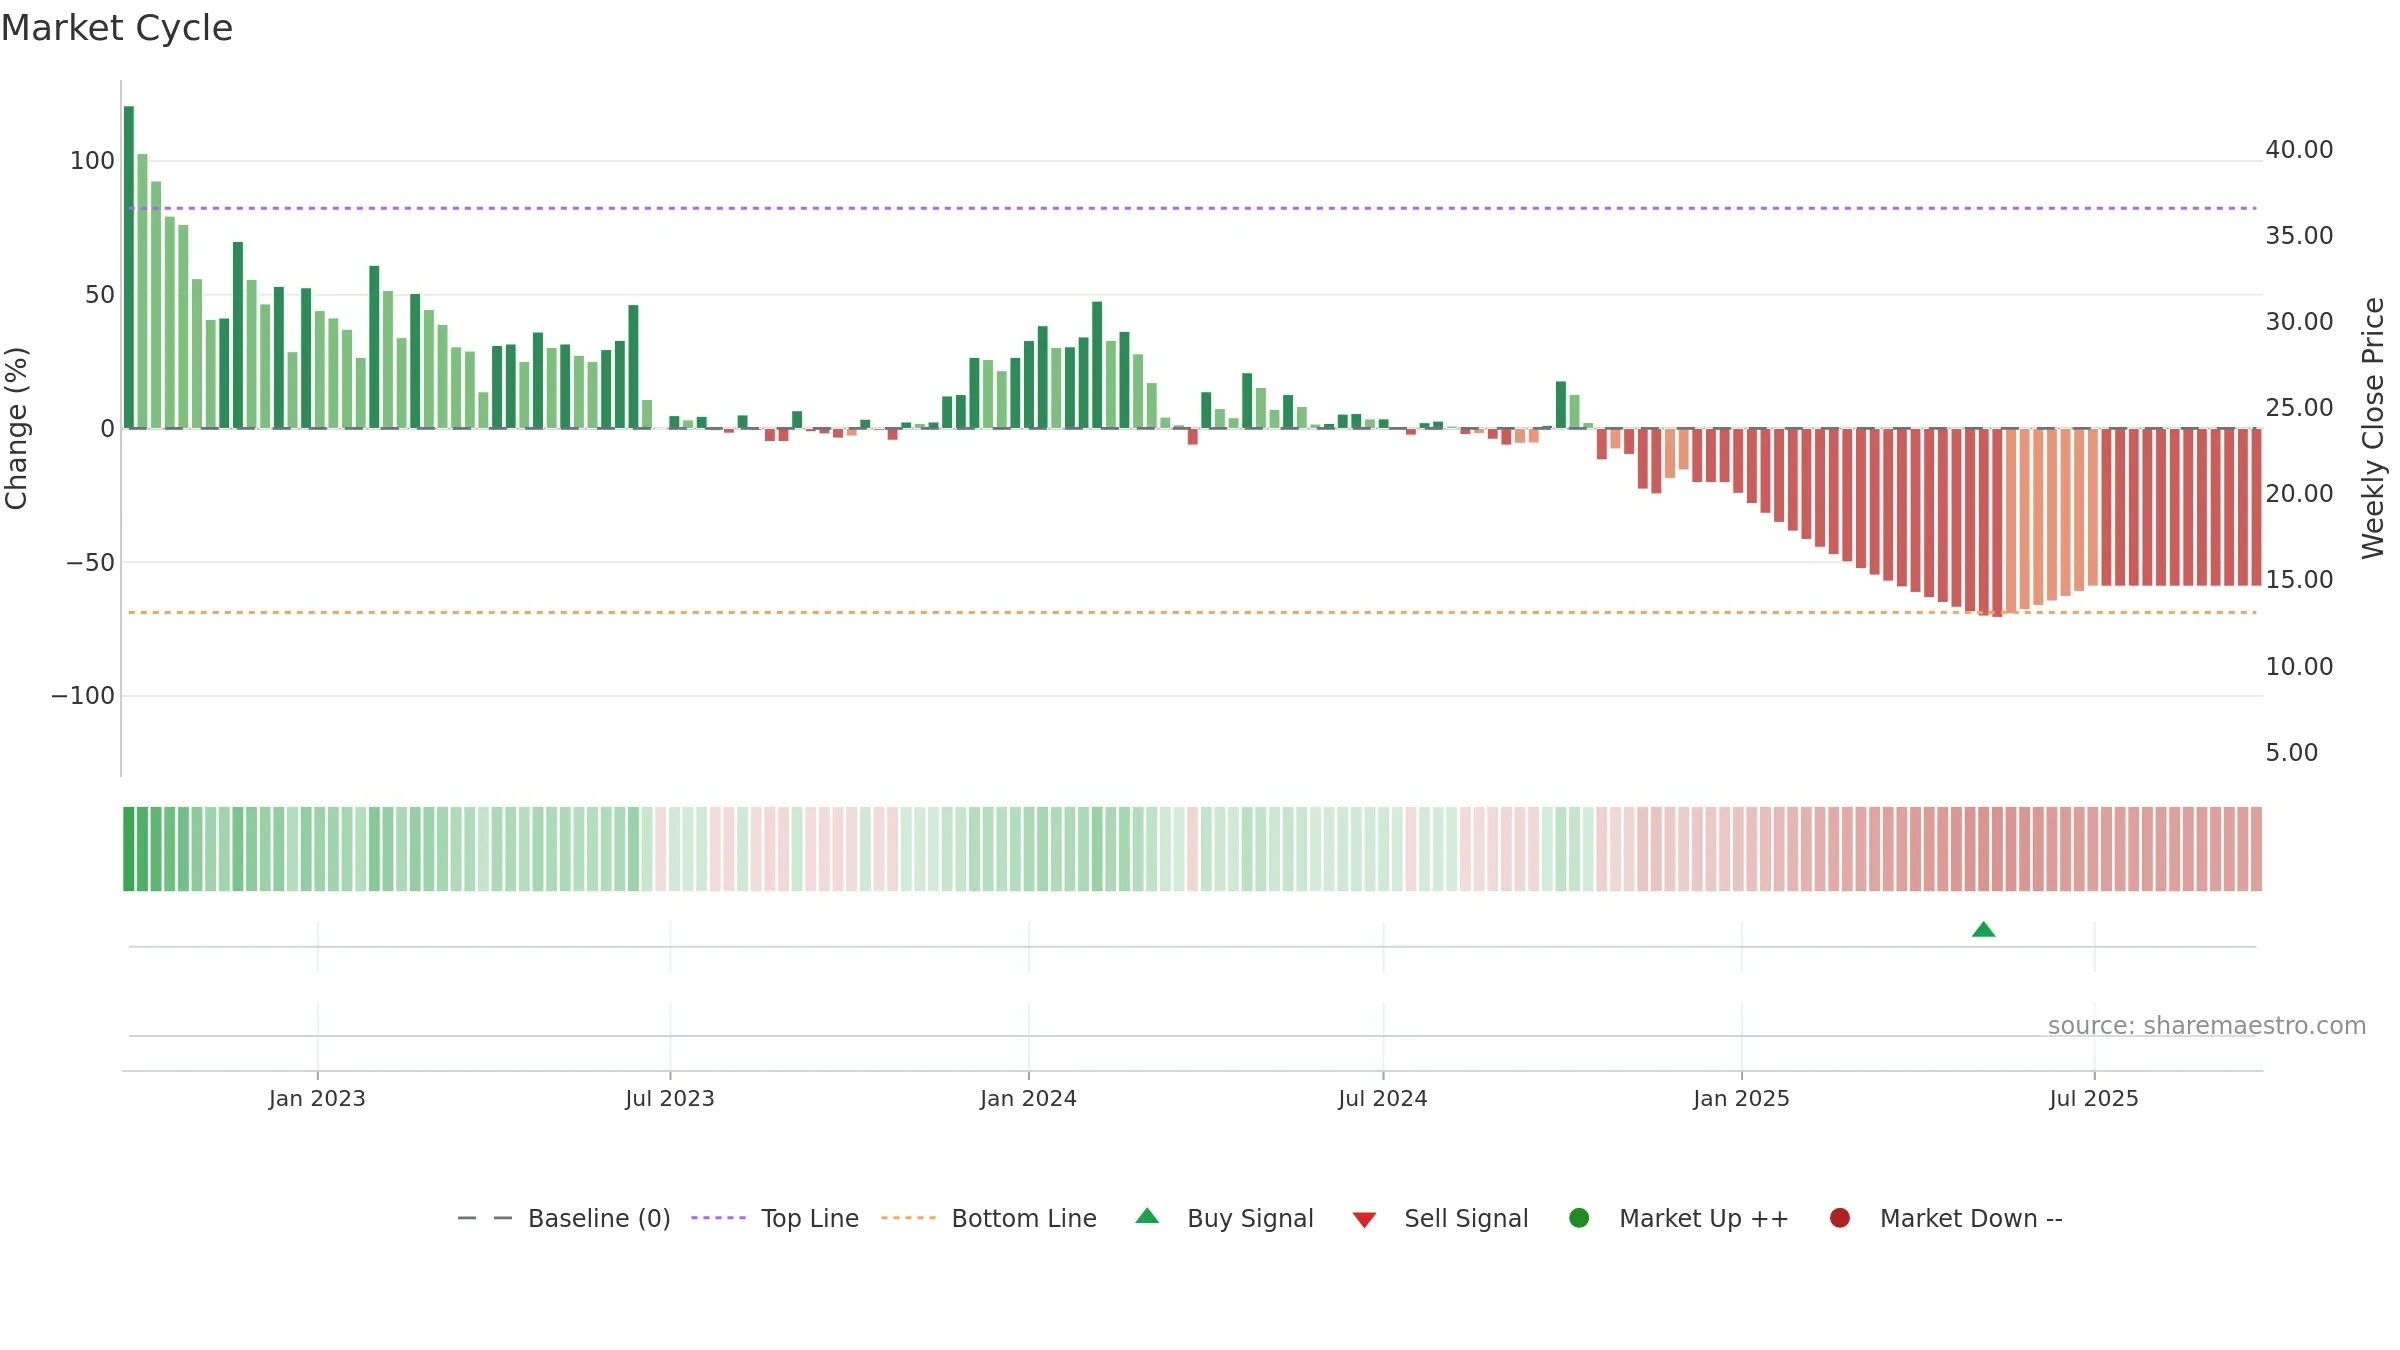
How to read this — Range-bound conditions; conviction is limited until a break or acceleration emerges.
Wait for a directional break or improving acceleration.
Conclusion
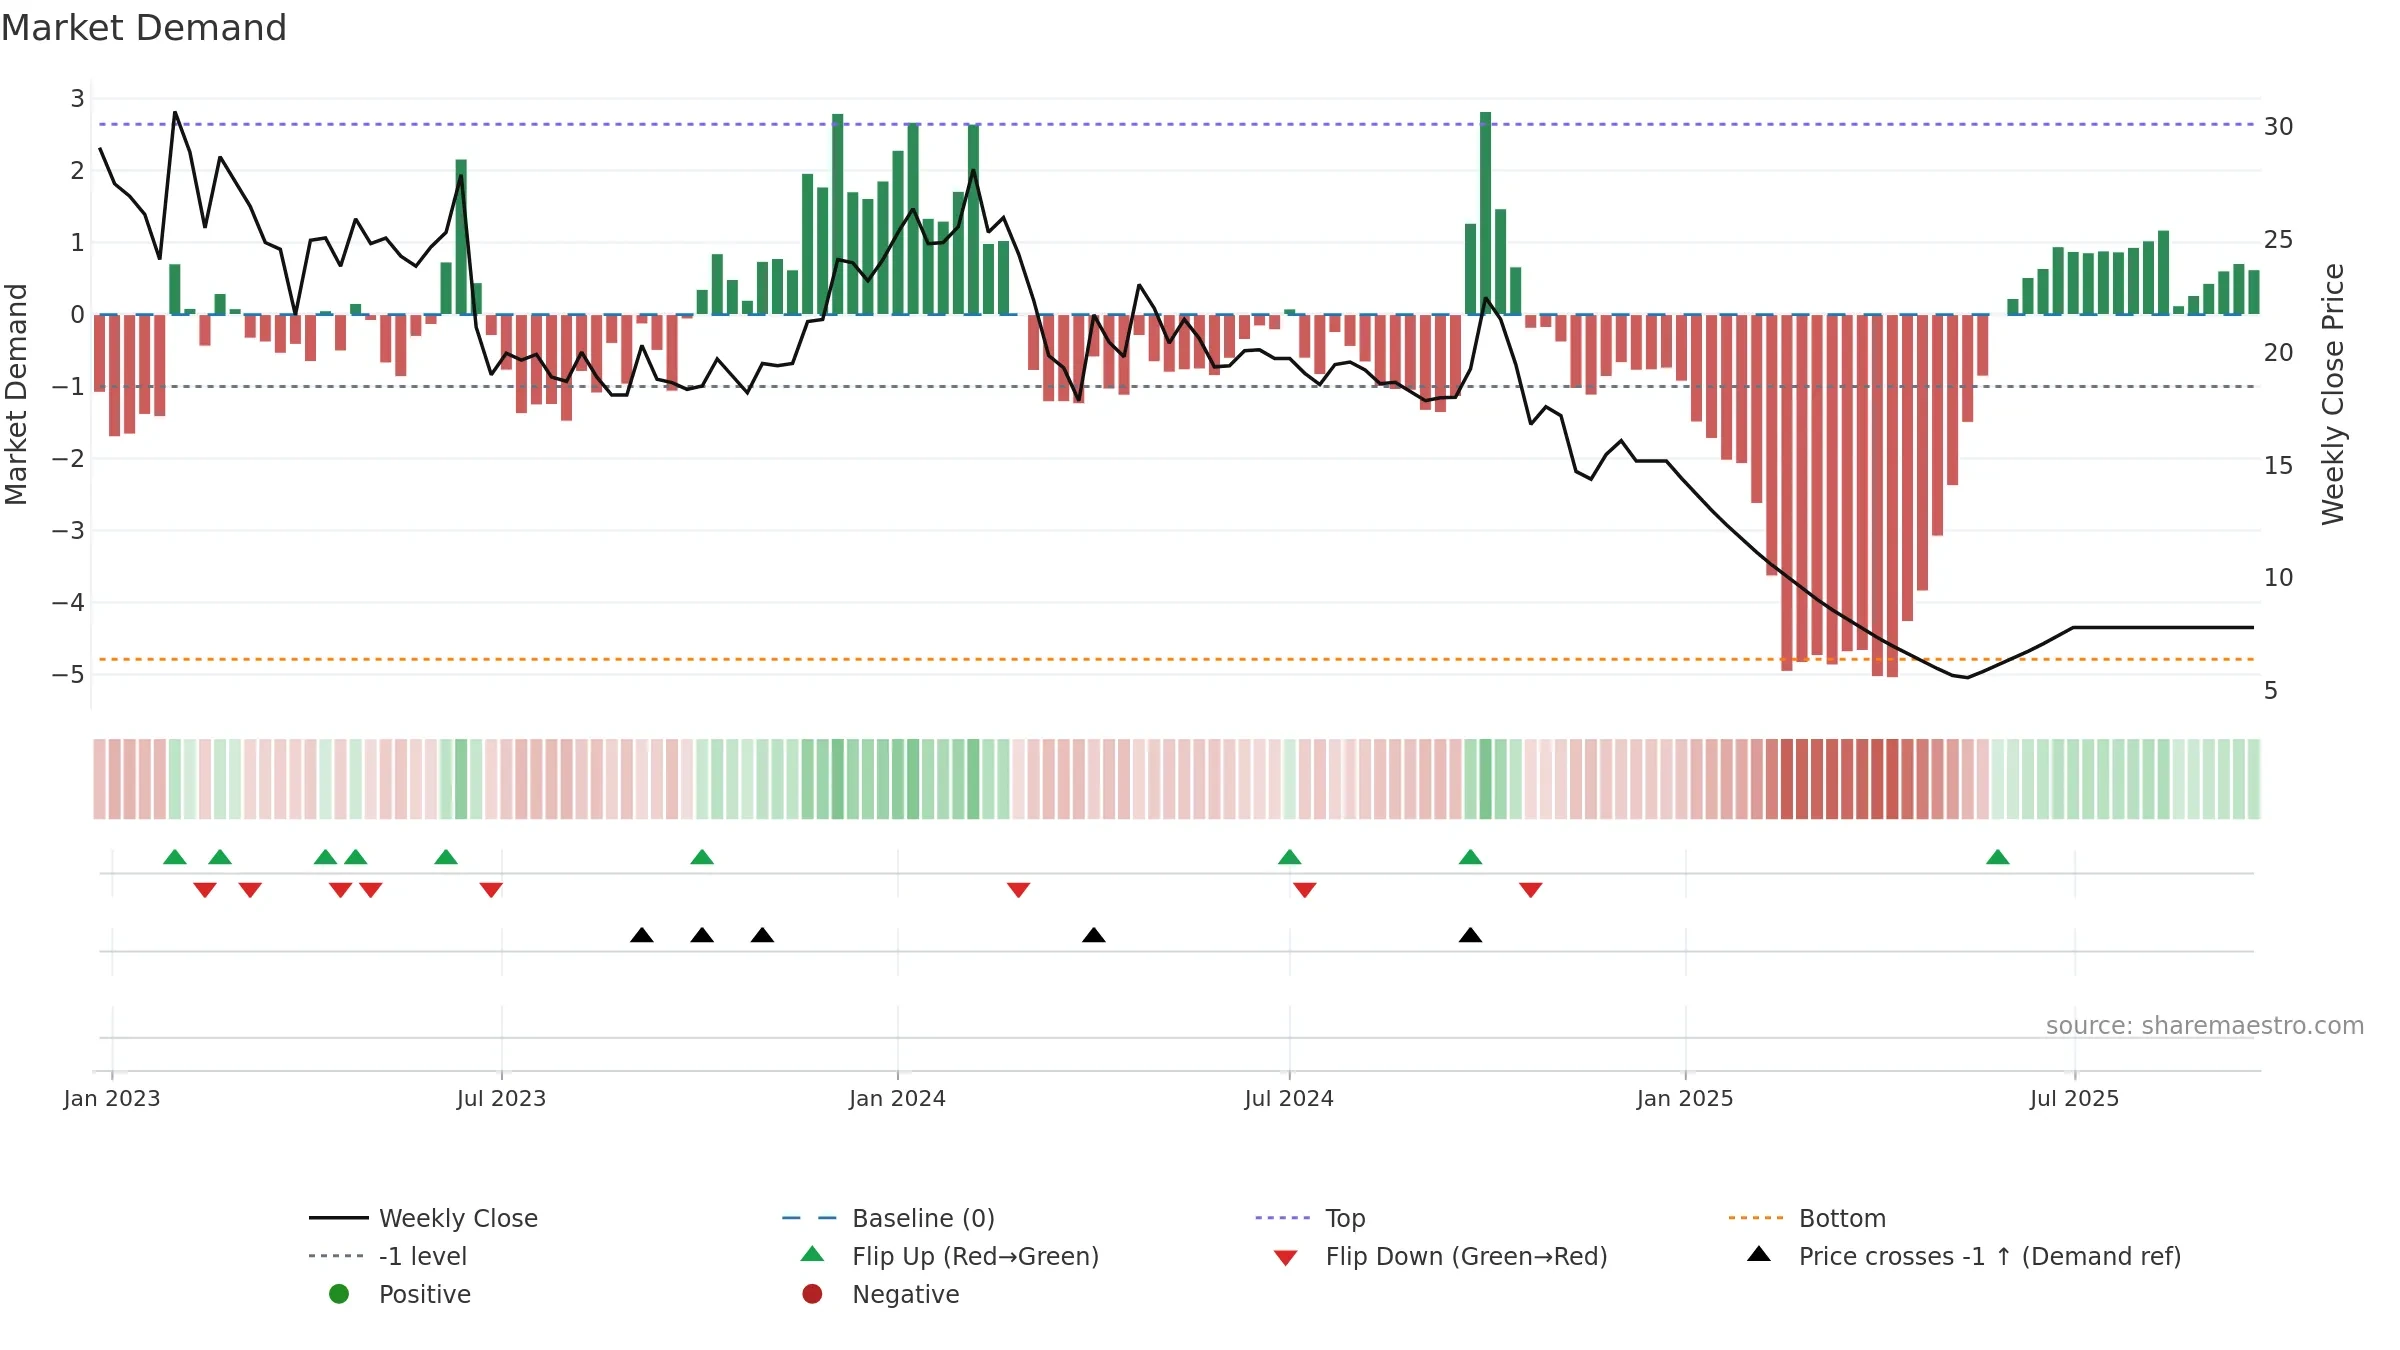
Positive setup. ★★★★☆ confidence. Price window: 0. Trend: Range / Neutral; gauge 44. In combination, liquidity confirmation is mixed.
- Low return volatility supports durability
- Buyers step in at depressed levels (accumulation)
- Price is not above key averages
Why: Return volatility 0.00%. Liquidity flat with price. Trend state range / neutral. Low-regime (≤0.25) upticks 3/4 (75.0%) • Accumulating. Momentum neutral and rising.
Tip: Most metrics include a hover tooltip where they appear in the report.