ABM International Limited
ABMINTLLTD NSE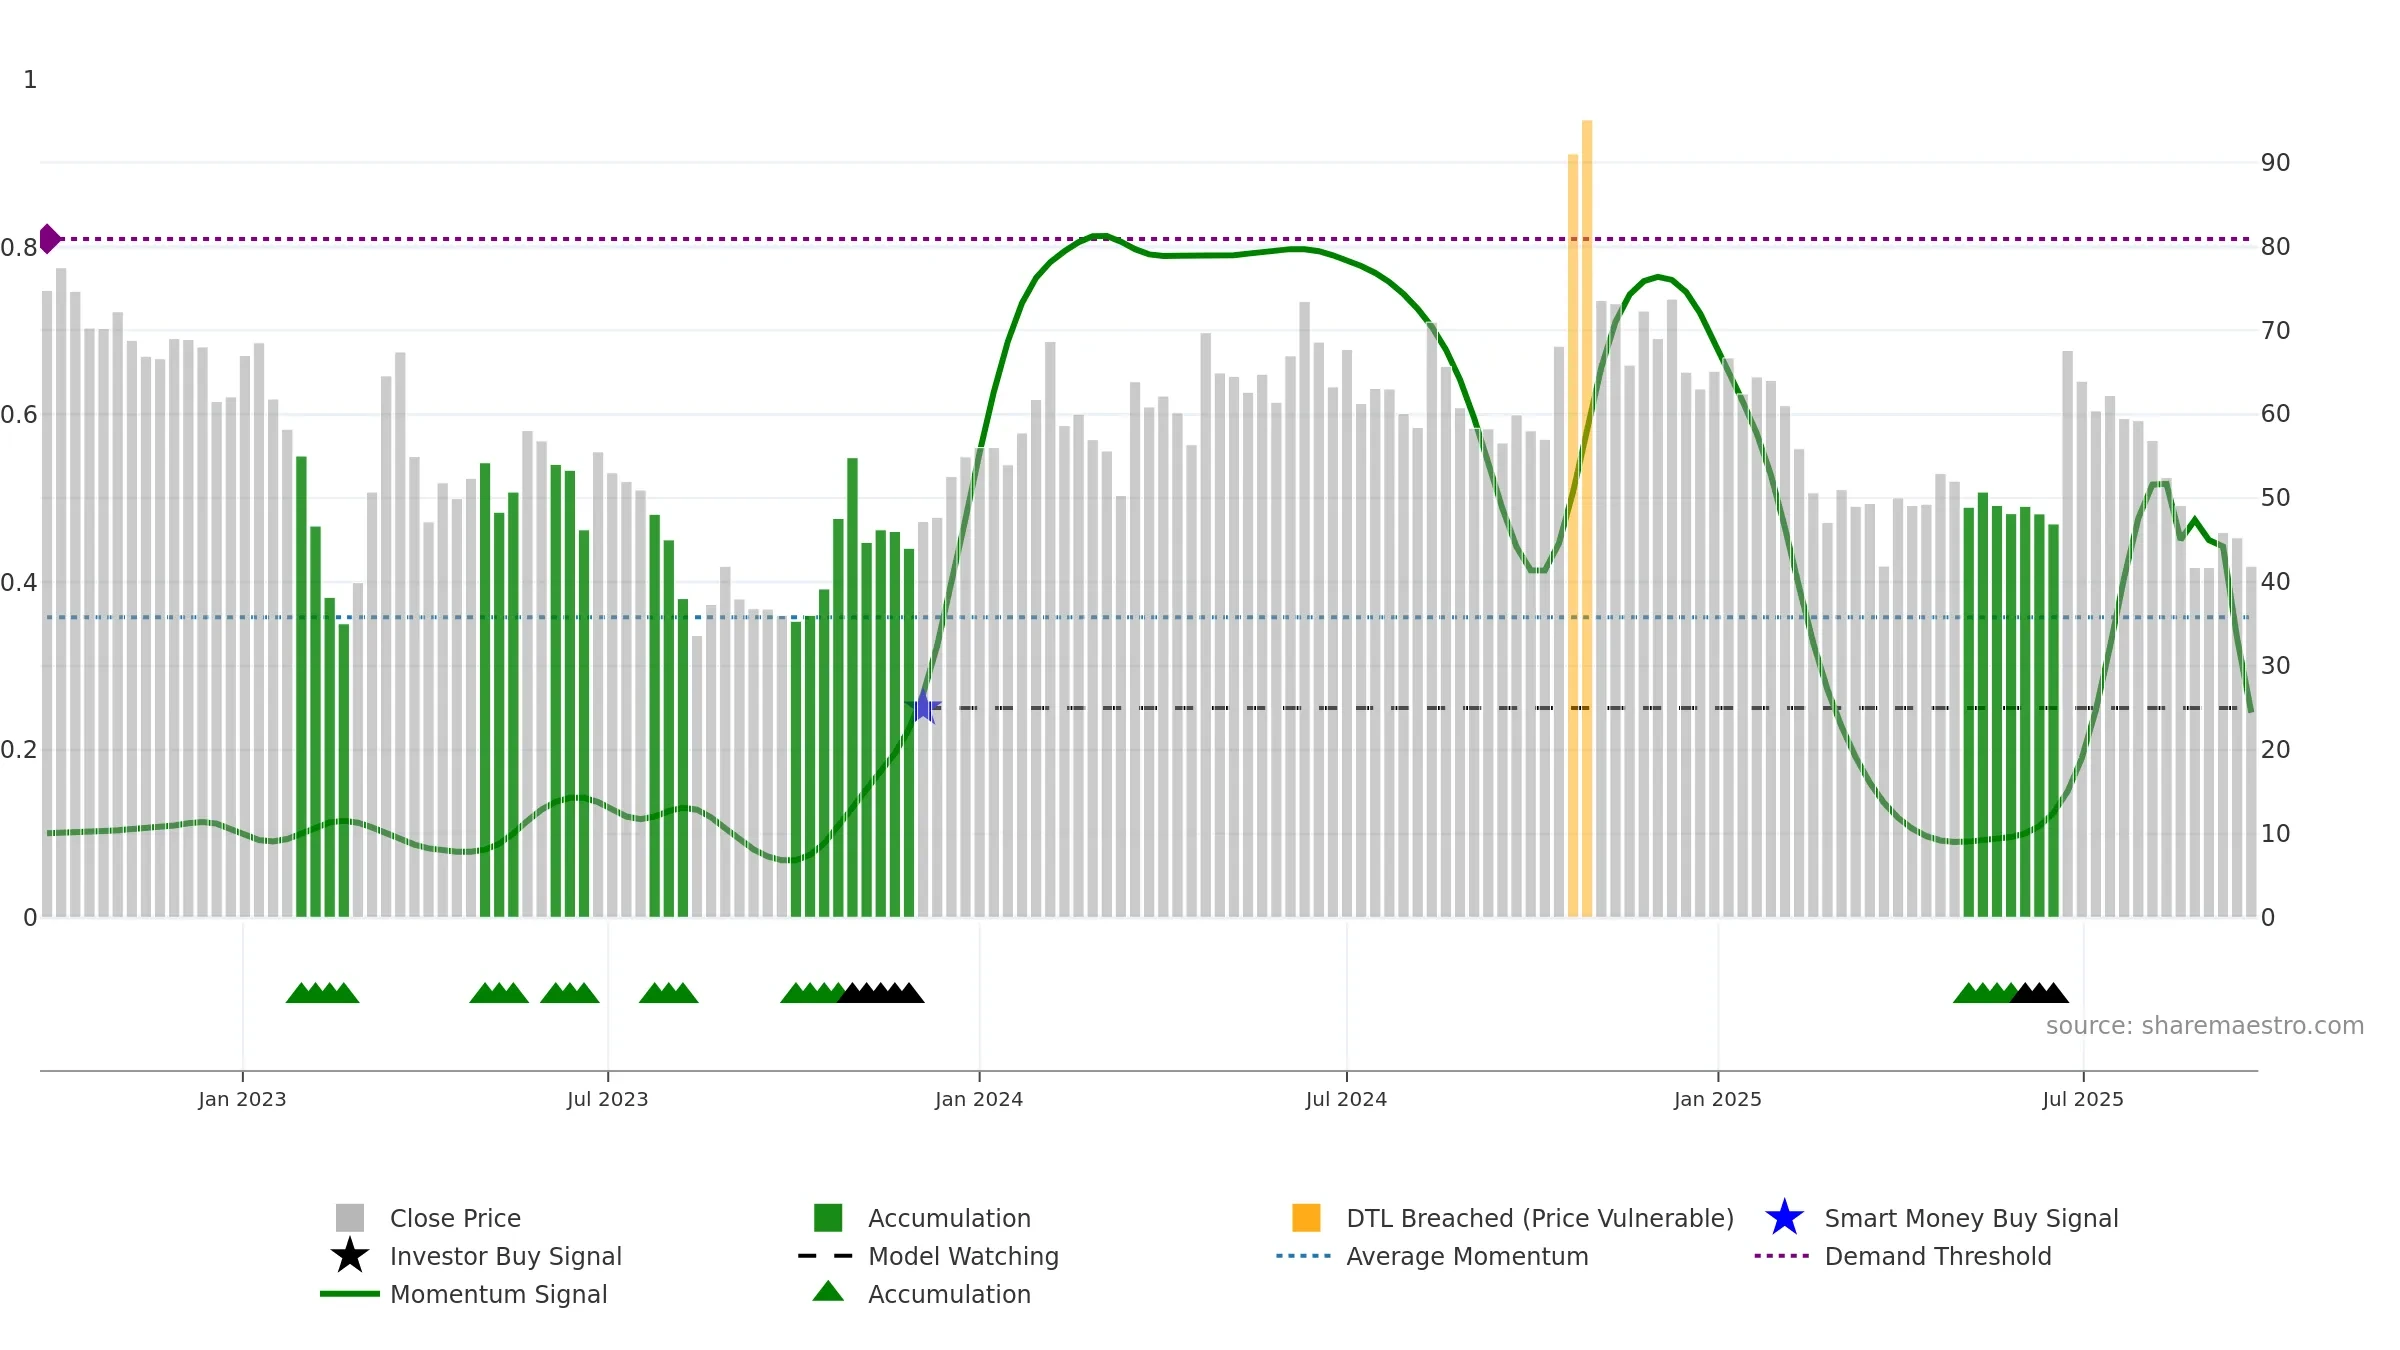
Weekly Summary
ABM International Limited closed at 41.8700 (-1.48% WoW) . Data window ends Mon, 22 Sep 2025.
How to read this — Price slope is downward, indicating persistent supply pressure. Volume and price are moving in the same direction — a constructive confirmation. Returns are negatively correlated with volume — strength may come on lighter activity. Price sits below key averages, keeping pressure on the tape.
Down-slope argues for patience; rallies can fade sooner unless participation improves.
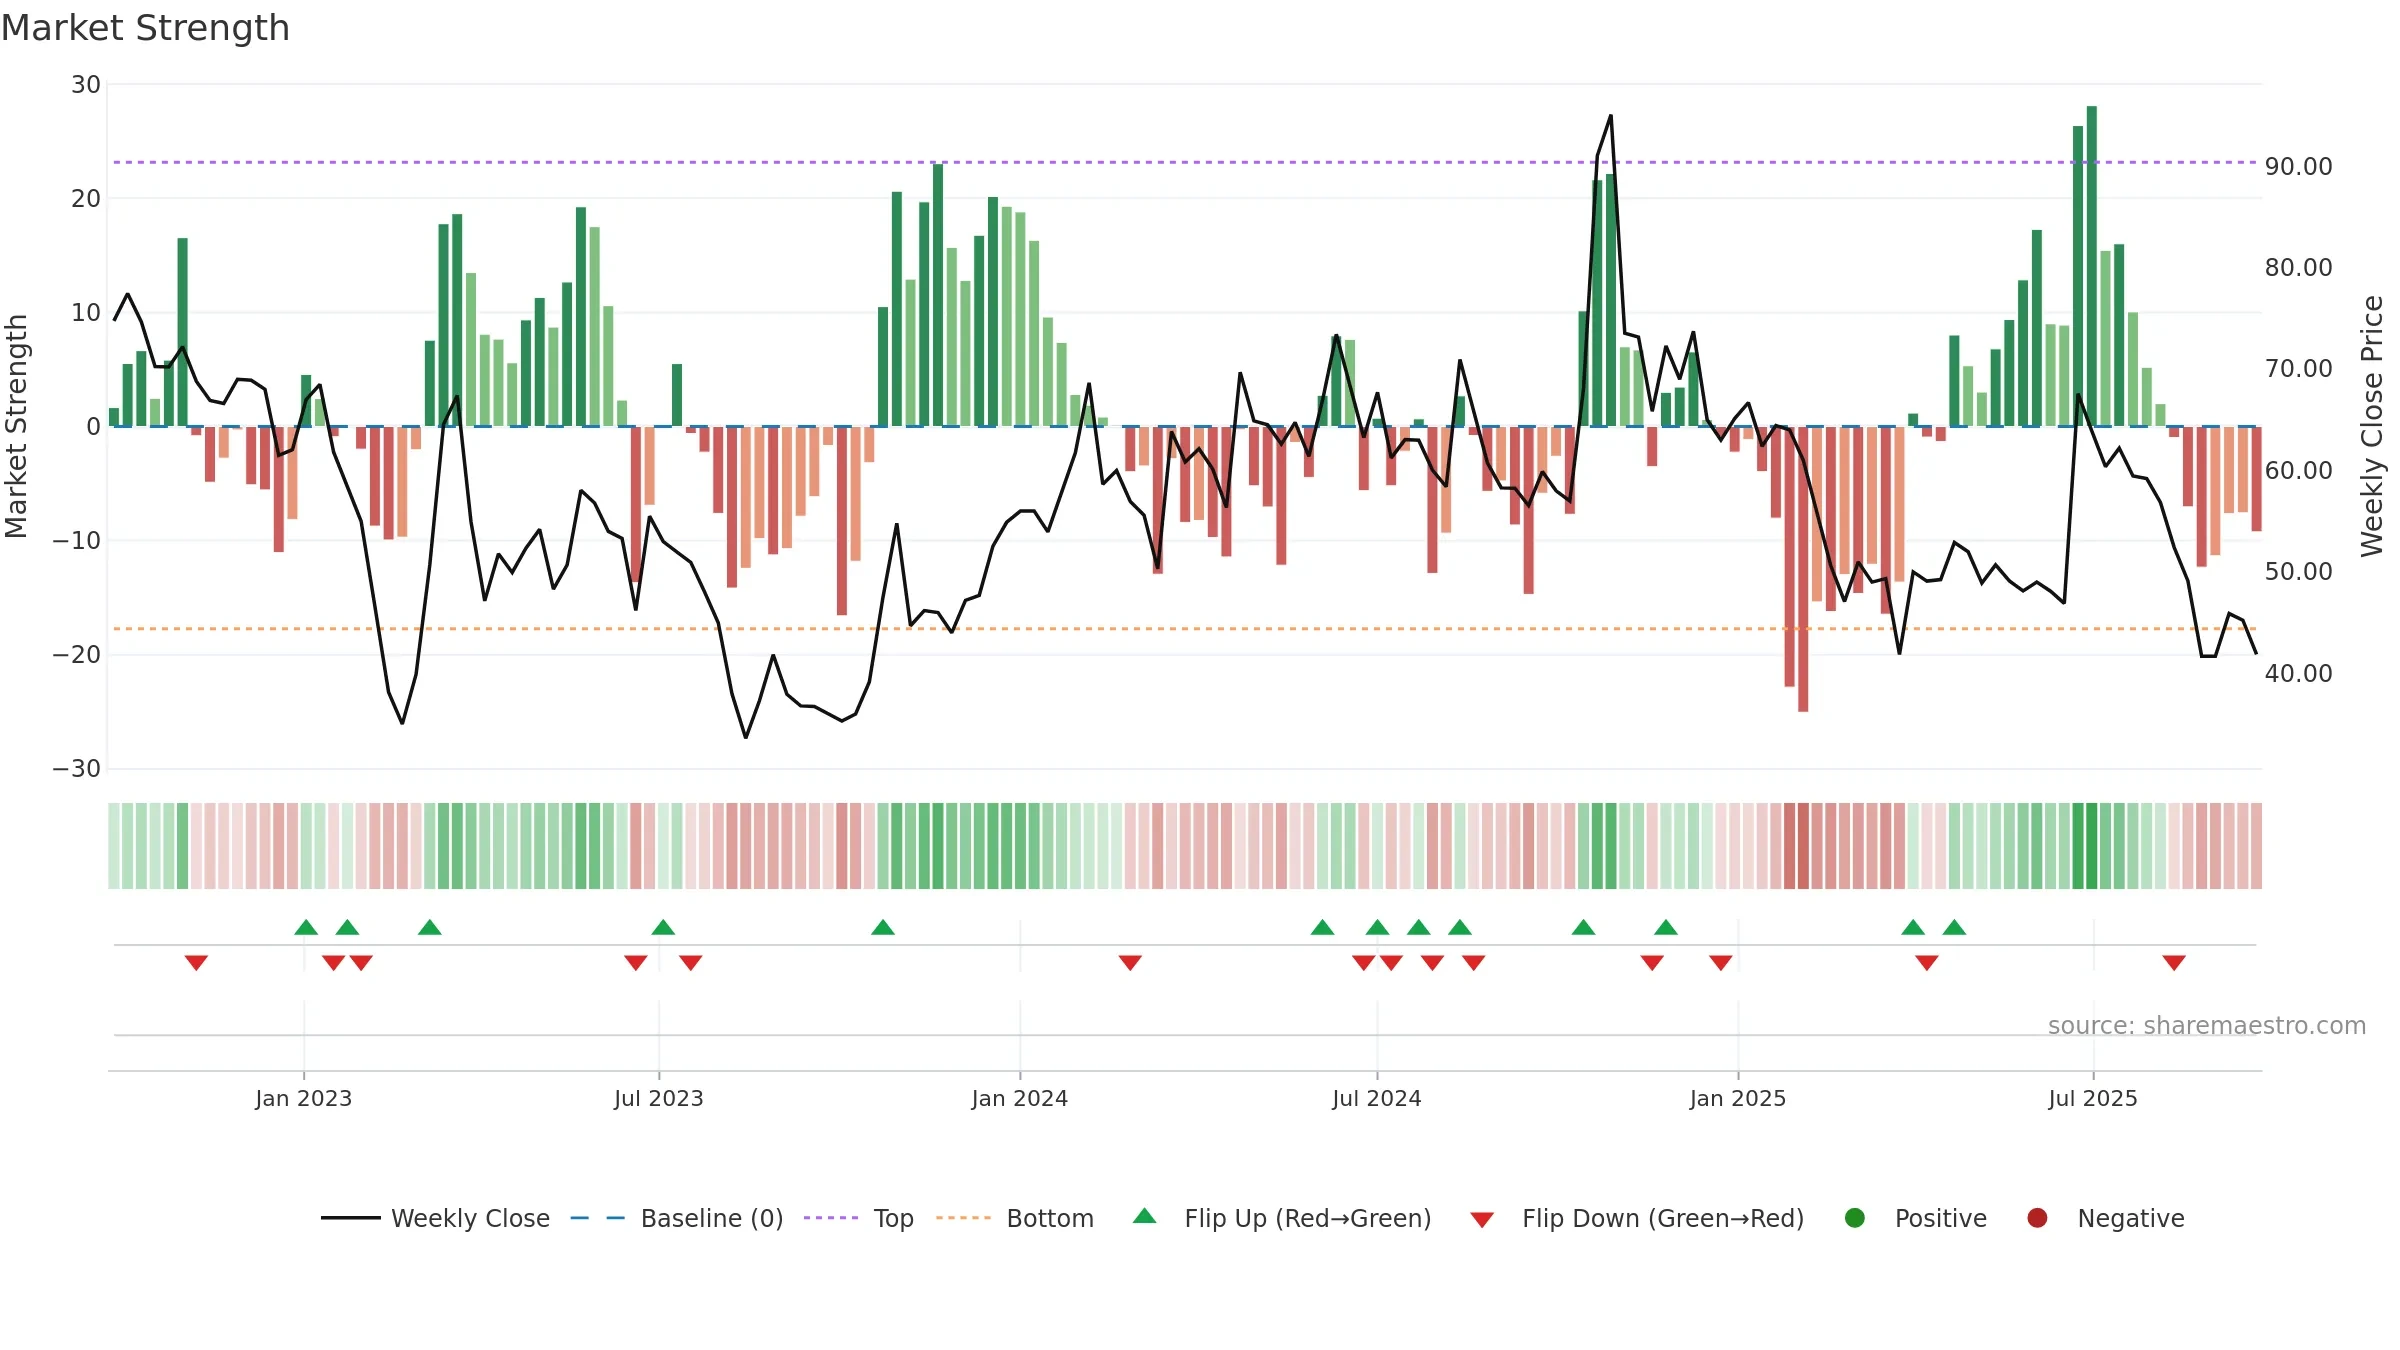
Gauge maps the trend signal to a 0–100 scale.
How to read this — Bearish zone with falling momentum — sellers in control. Sub-0.40 print confirms downside control.
Bias remains lower; rallies are suspect unless gauge reclaims 0.50/0.60.

Relative strength is Negative
(< 0%, underperforming).
Latest MRS: -19.46% (week ending Fri, 19 Sep 2025).
Slope: Falling over 8w.
Notes:
- Below zero line indicates relative weakness vs benchmark.
- MRS slope falling over ~8 weeks.
Conclusion
Negative setup. ⯪☆☆☆☆ confidence. Trend: Downtrend Confirmed · -26.35% over window · vol 3.19% · liquidity convergence · posture below · RS weak
- Liquidity confirms the price trend
- Bearish control with falling momentum
- Momentum is weak/falling
- Price is not above key averages
- Negative multi-week performance
Why: Price window -26.35% over w. Close is -26.35% below the prior-window high. Volume trend falling. Liquidity convergence with price. Trend state downtrend confirmed. Momentum bearish and falling.
Tip: Most metrics include a hover tooltip where they appear in the report.