Loongson Technology Corporation Limited
688047 SHA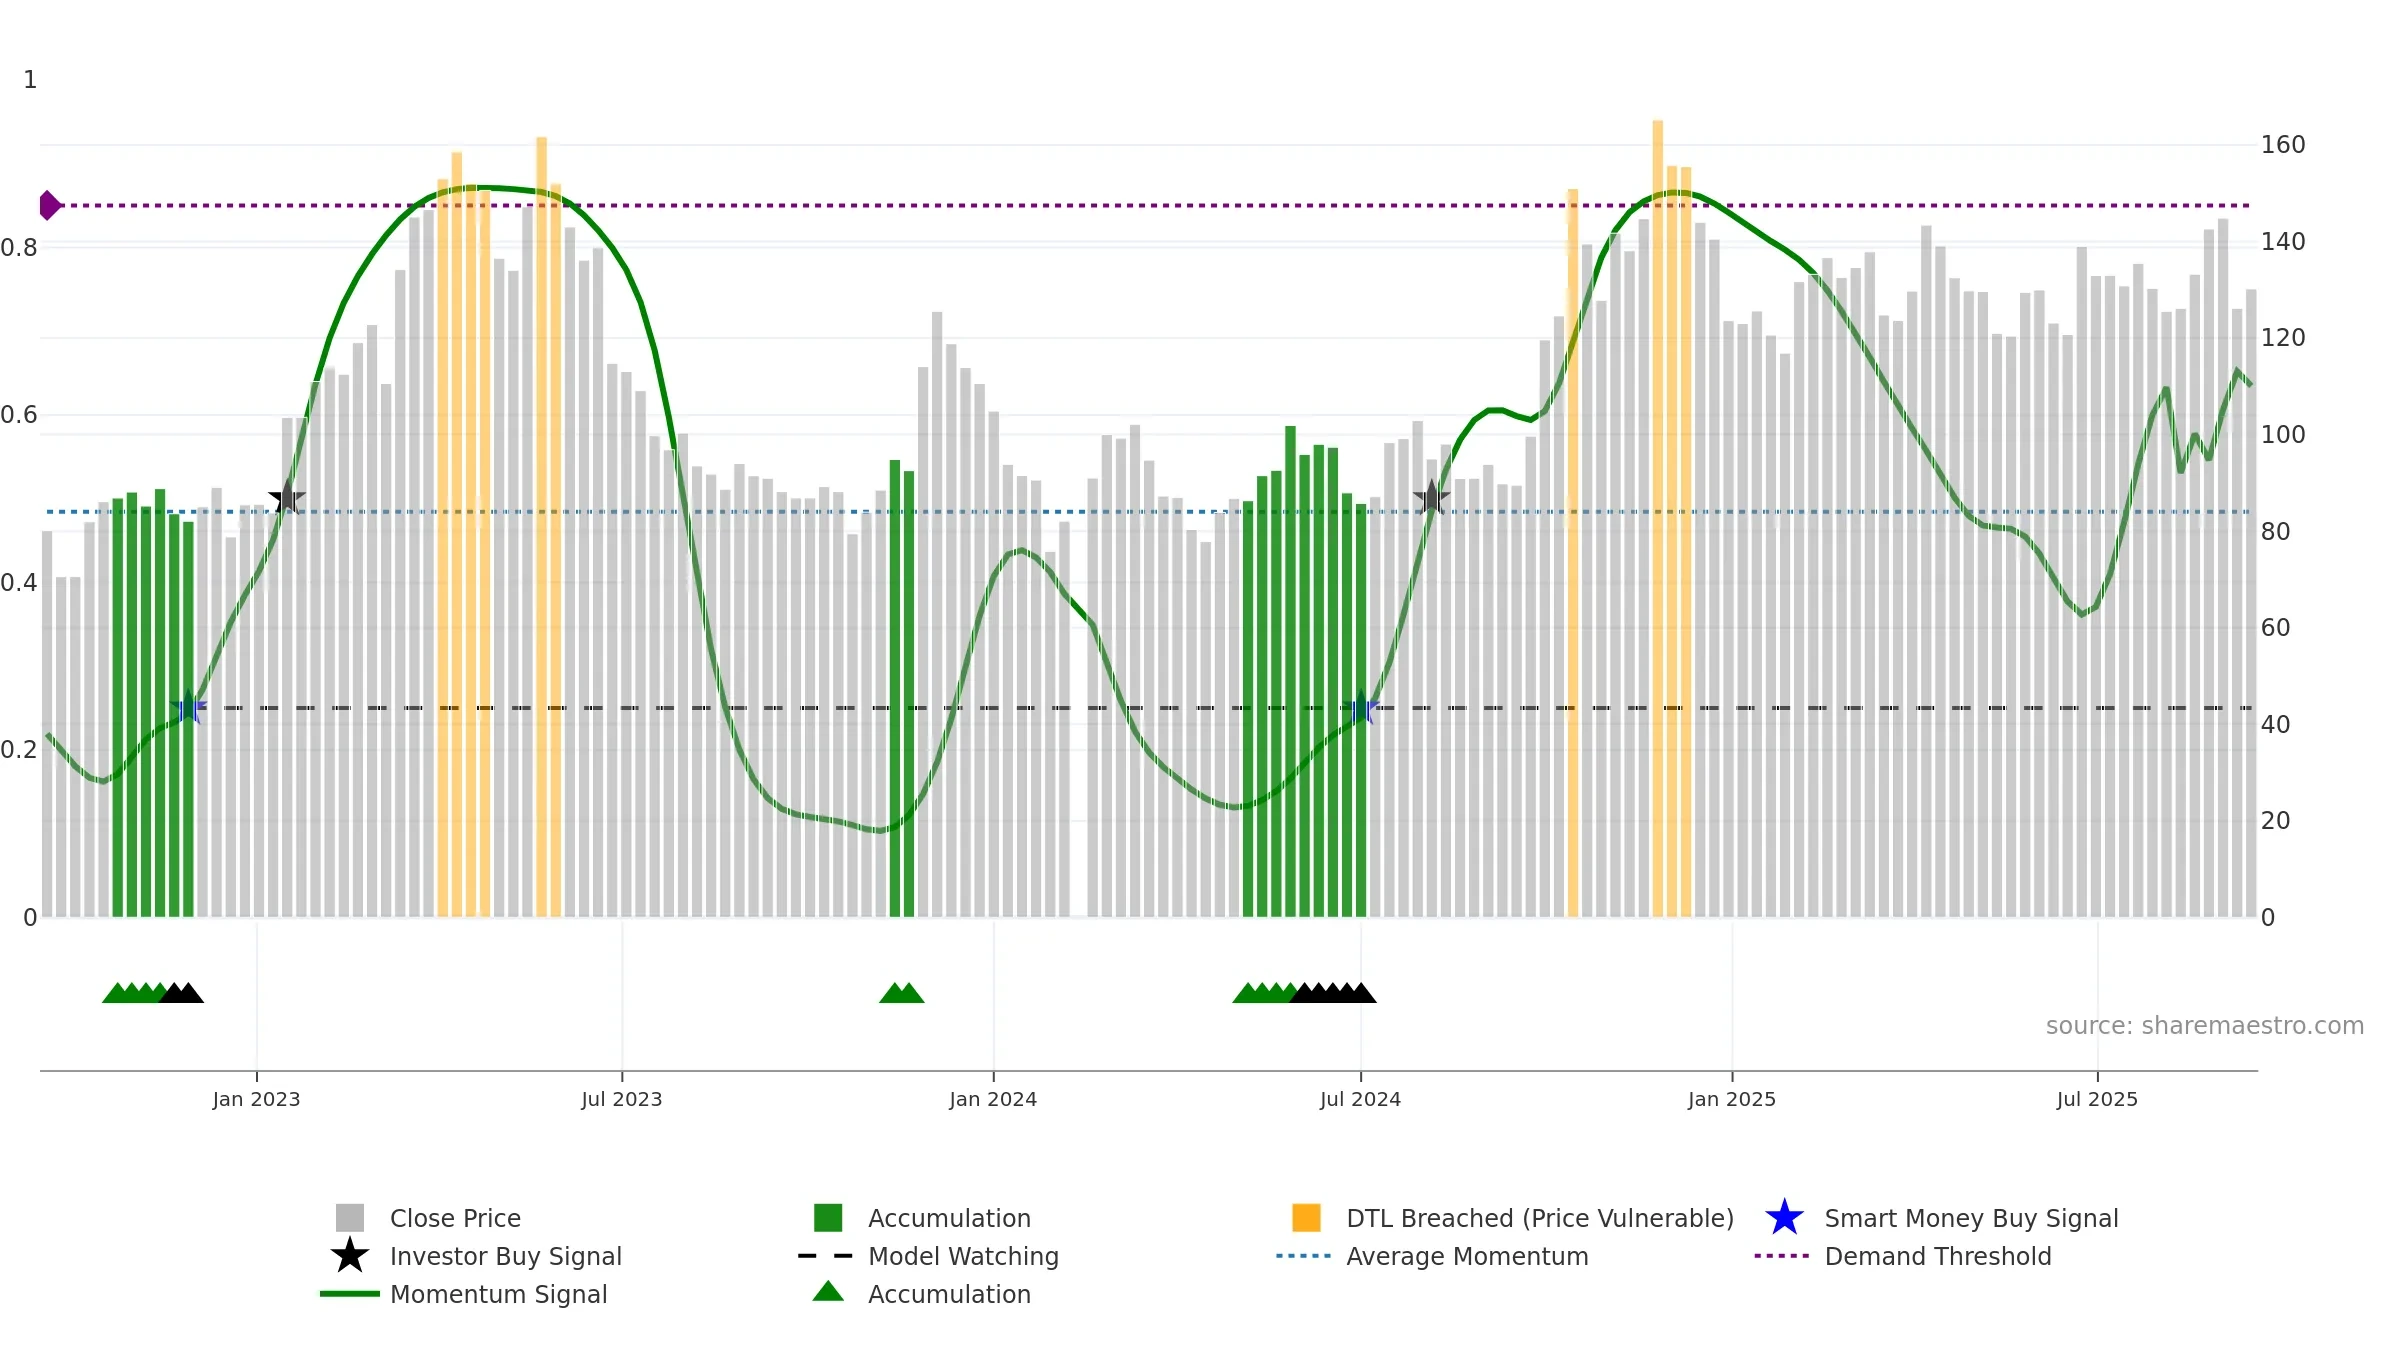
Weekly Report
Loongson Technology Corporation Limited closed at 130.2000 (-1.36% WoW) . Data window ends Mon, 15 Sep 2025.
How to read this — Price slope is upward, indicating persistent buying over the window. Low weekly volatility favours steadier follow-through. Volume trend diverges from price — watch for fatigue or rotation. Returns are negatively correlated with volume — strength may come on lighter activity. Price sits below key averages, keeping pressure on the tape.
Up-slope supports buying interest; pullbacks may be contained if activity stays firm. Because liquidity isn’t confirming, prefer evidence of fresh demand before chasing moves.
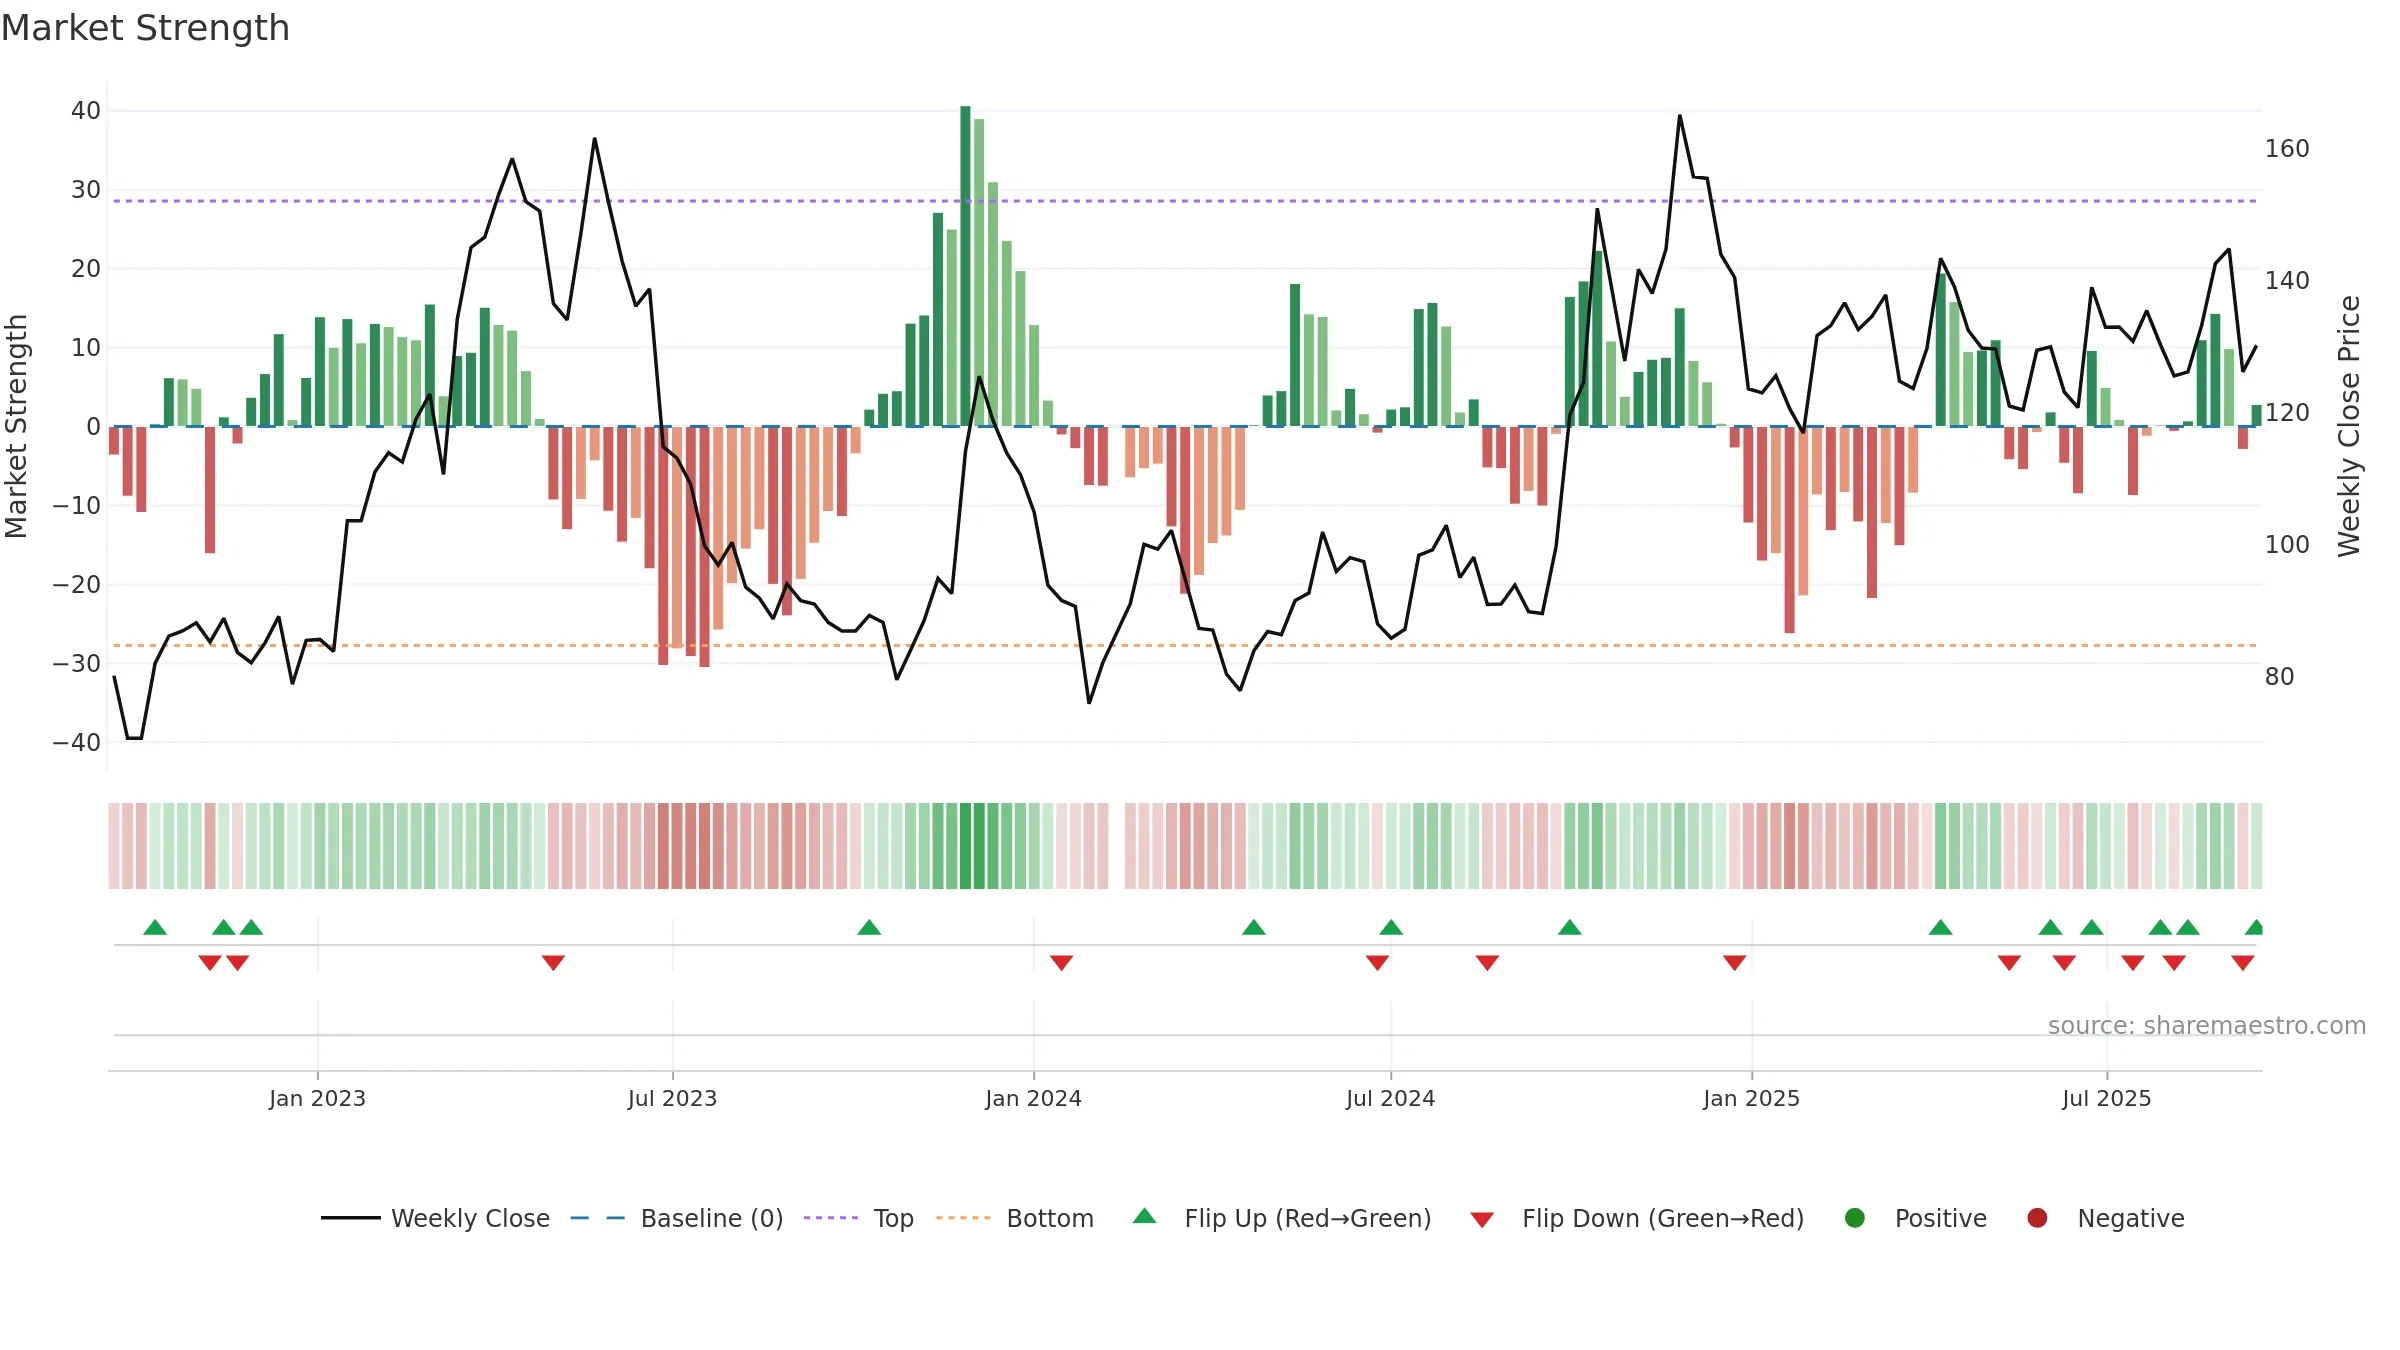
Gauge maps the trend signal to a 0–100 scale.
How to read this — High gauge and rising momentum — buyers in control.
Bias remains higher; pullbacks could be buyable if participation holds.
Conclusion
Neutral setup. ★★★☆☆ confidence. Price window: -0. Trend: Strong Uptrend; gauge 63. In combination, liquidity diverges from price.
- High gauge with rising momentum (strong uptrend)
- Momentum is bullish and rising
- Low return volatility supports durability
- Price is not above key averages
- Liquidity diverges from price
- Negative multi-week performance
Why: Price window -0.08% over 8w. Close is -10.12% below the prior-window high. Return volatility 1.72%. Volume trend falling. Liquidity divergence with price. Trend state strong uptrend. Momentum bullish and rising.
Tip: Most metrics include a hover tooltip where they appear in the report.