CAE Inc.
CAE NYSE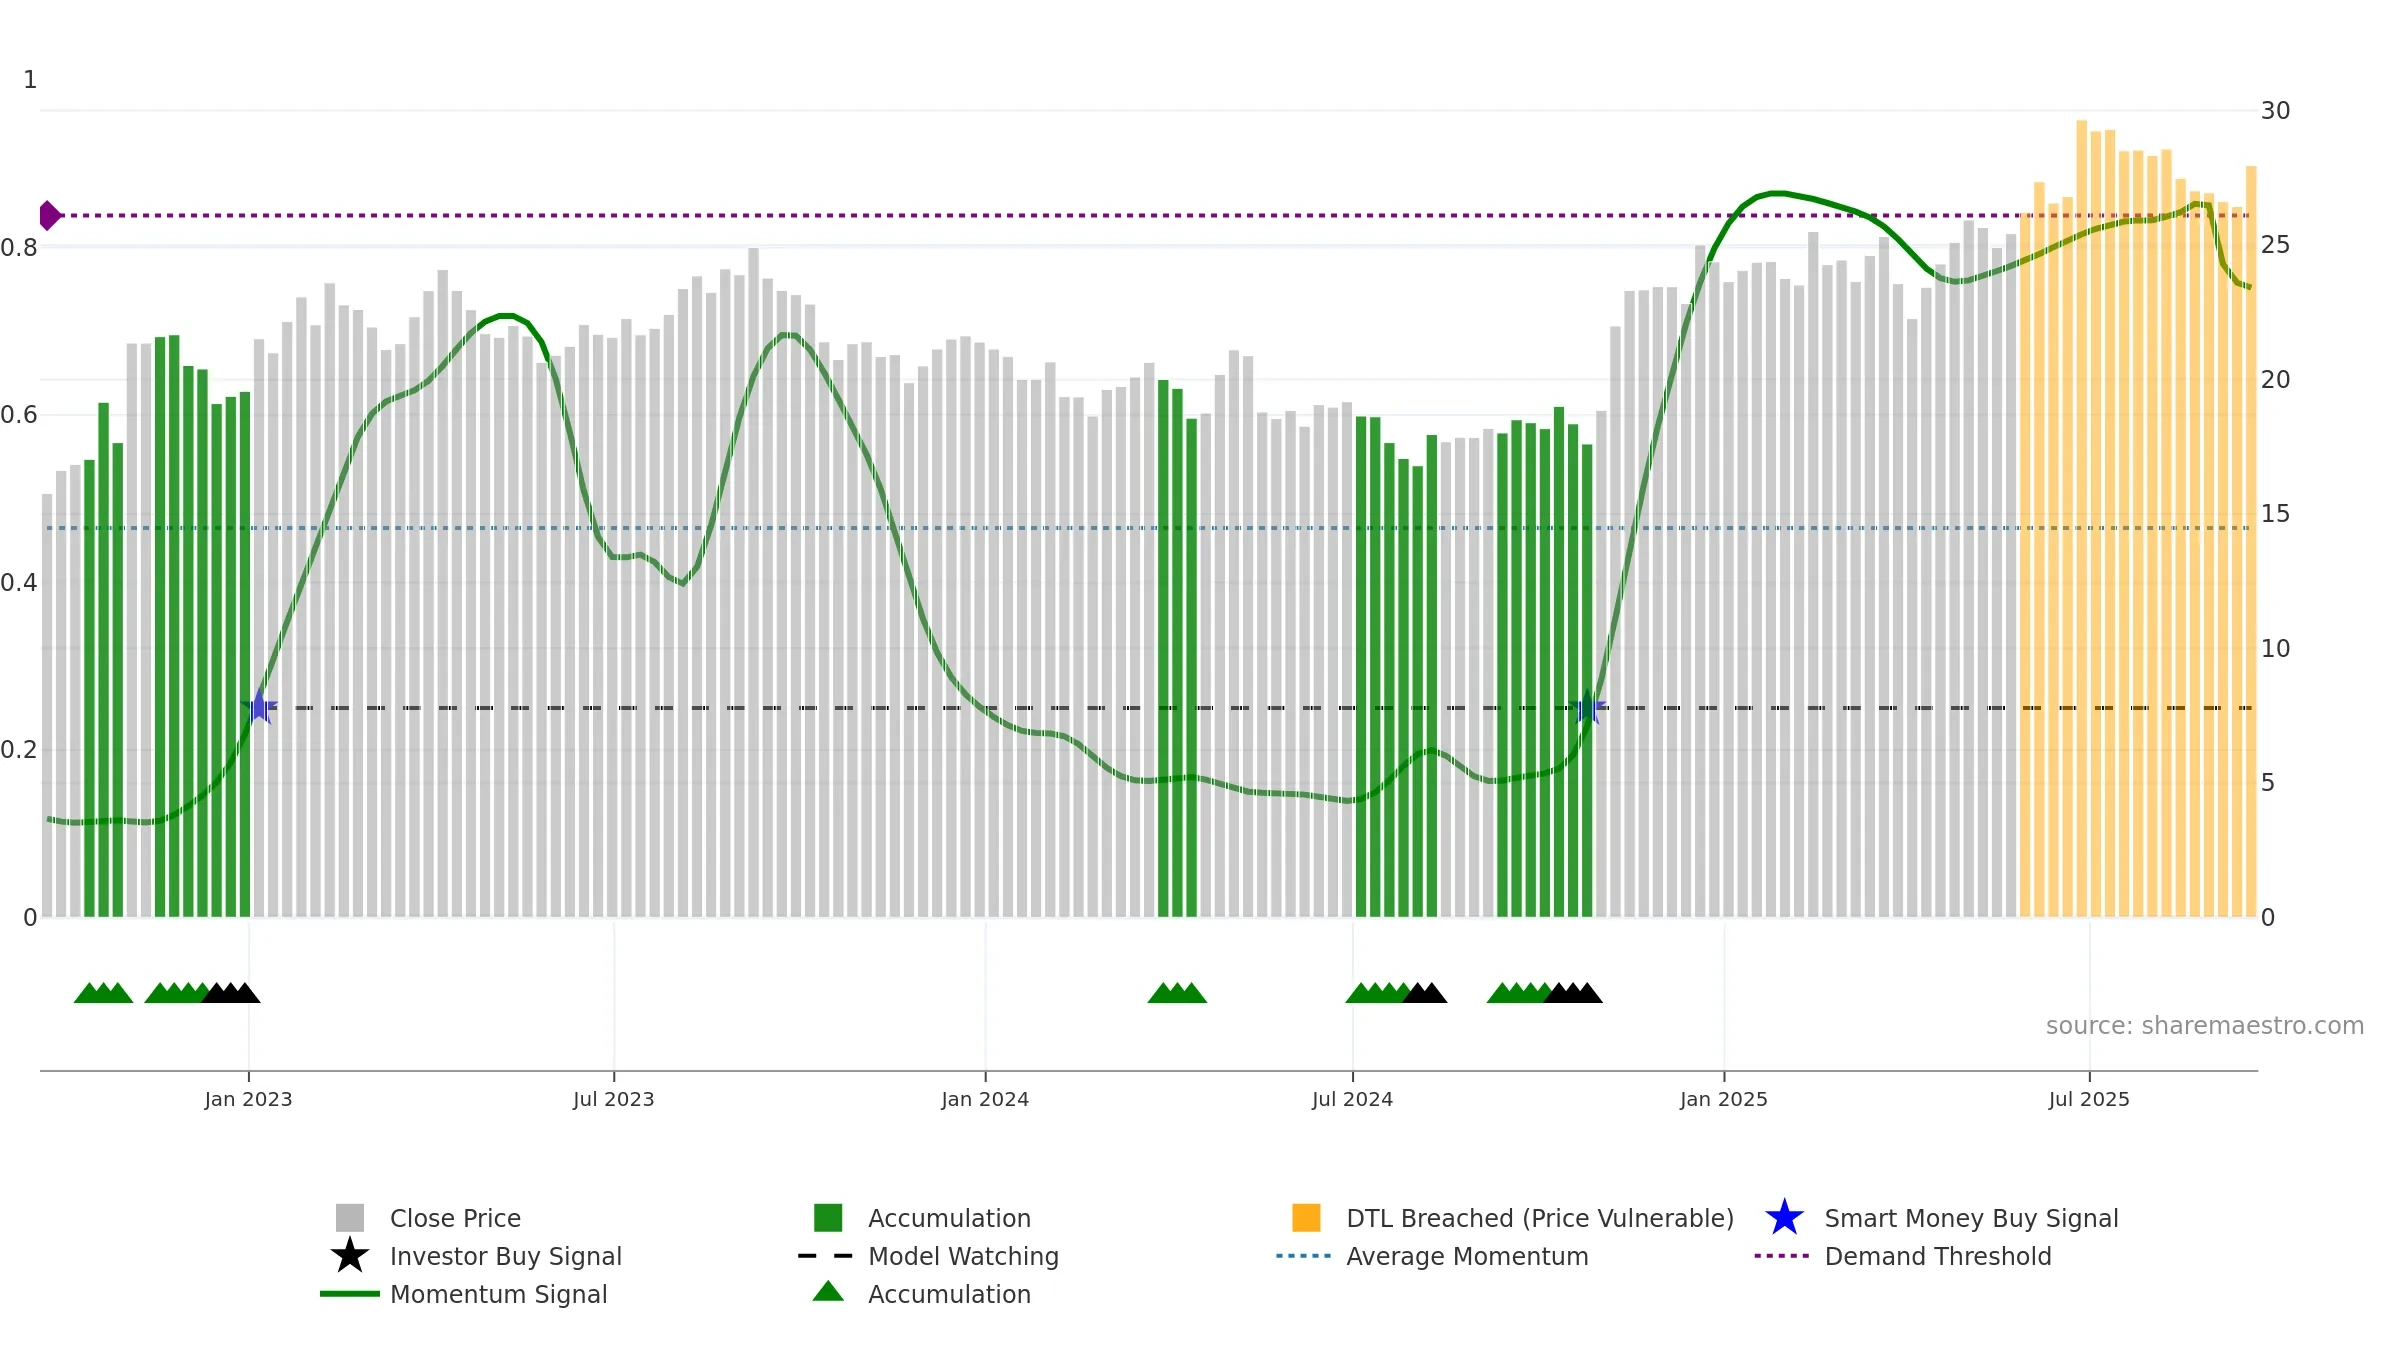
Weekly Report
CAE Inc. closed at 27.9500 (2.53% WoW) . Data window ends Fri, 19 Sep 2025.
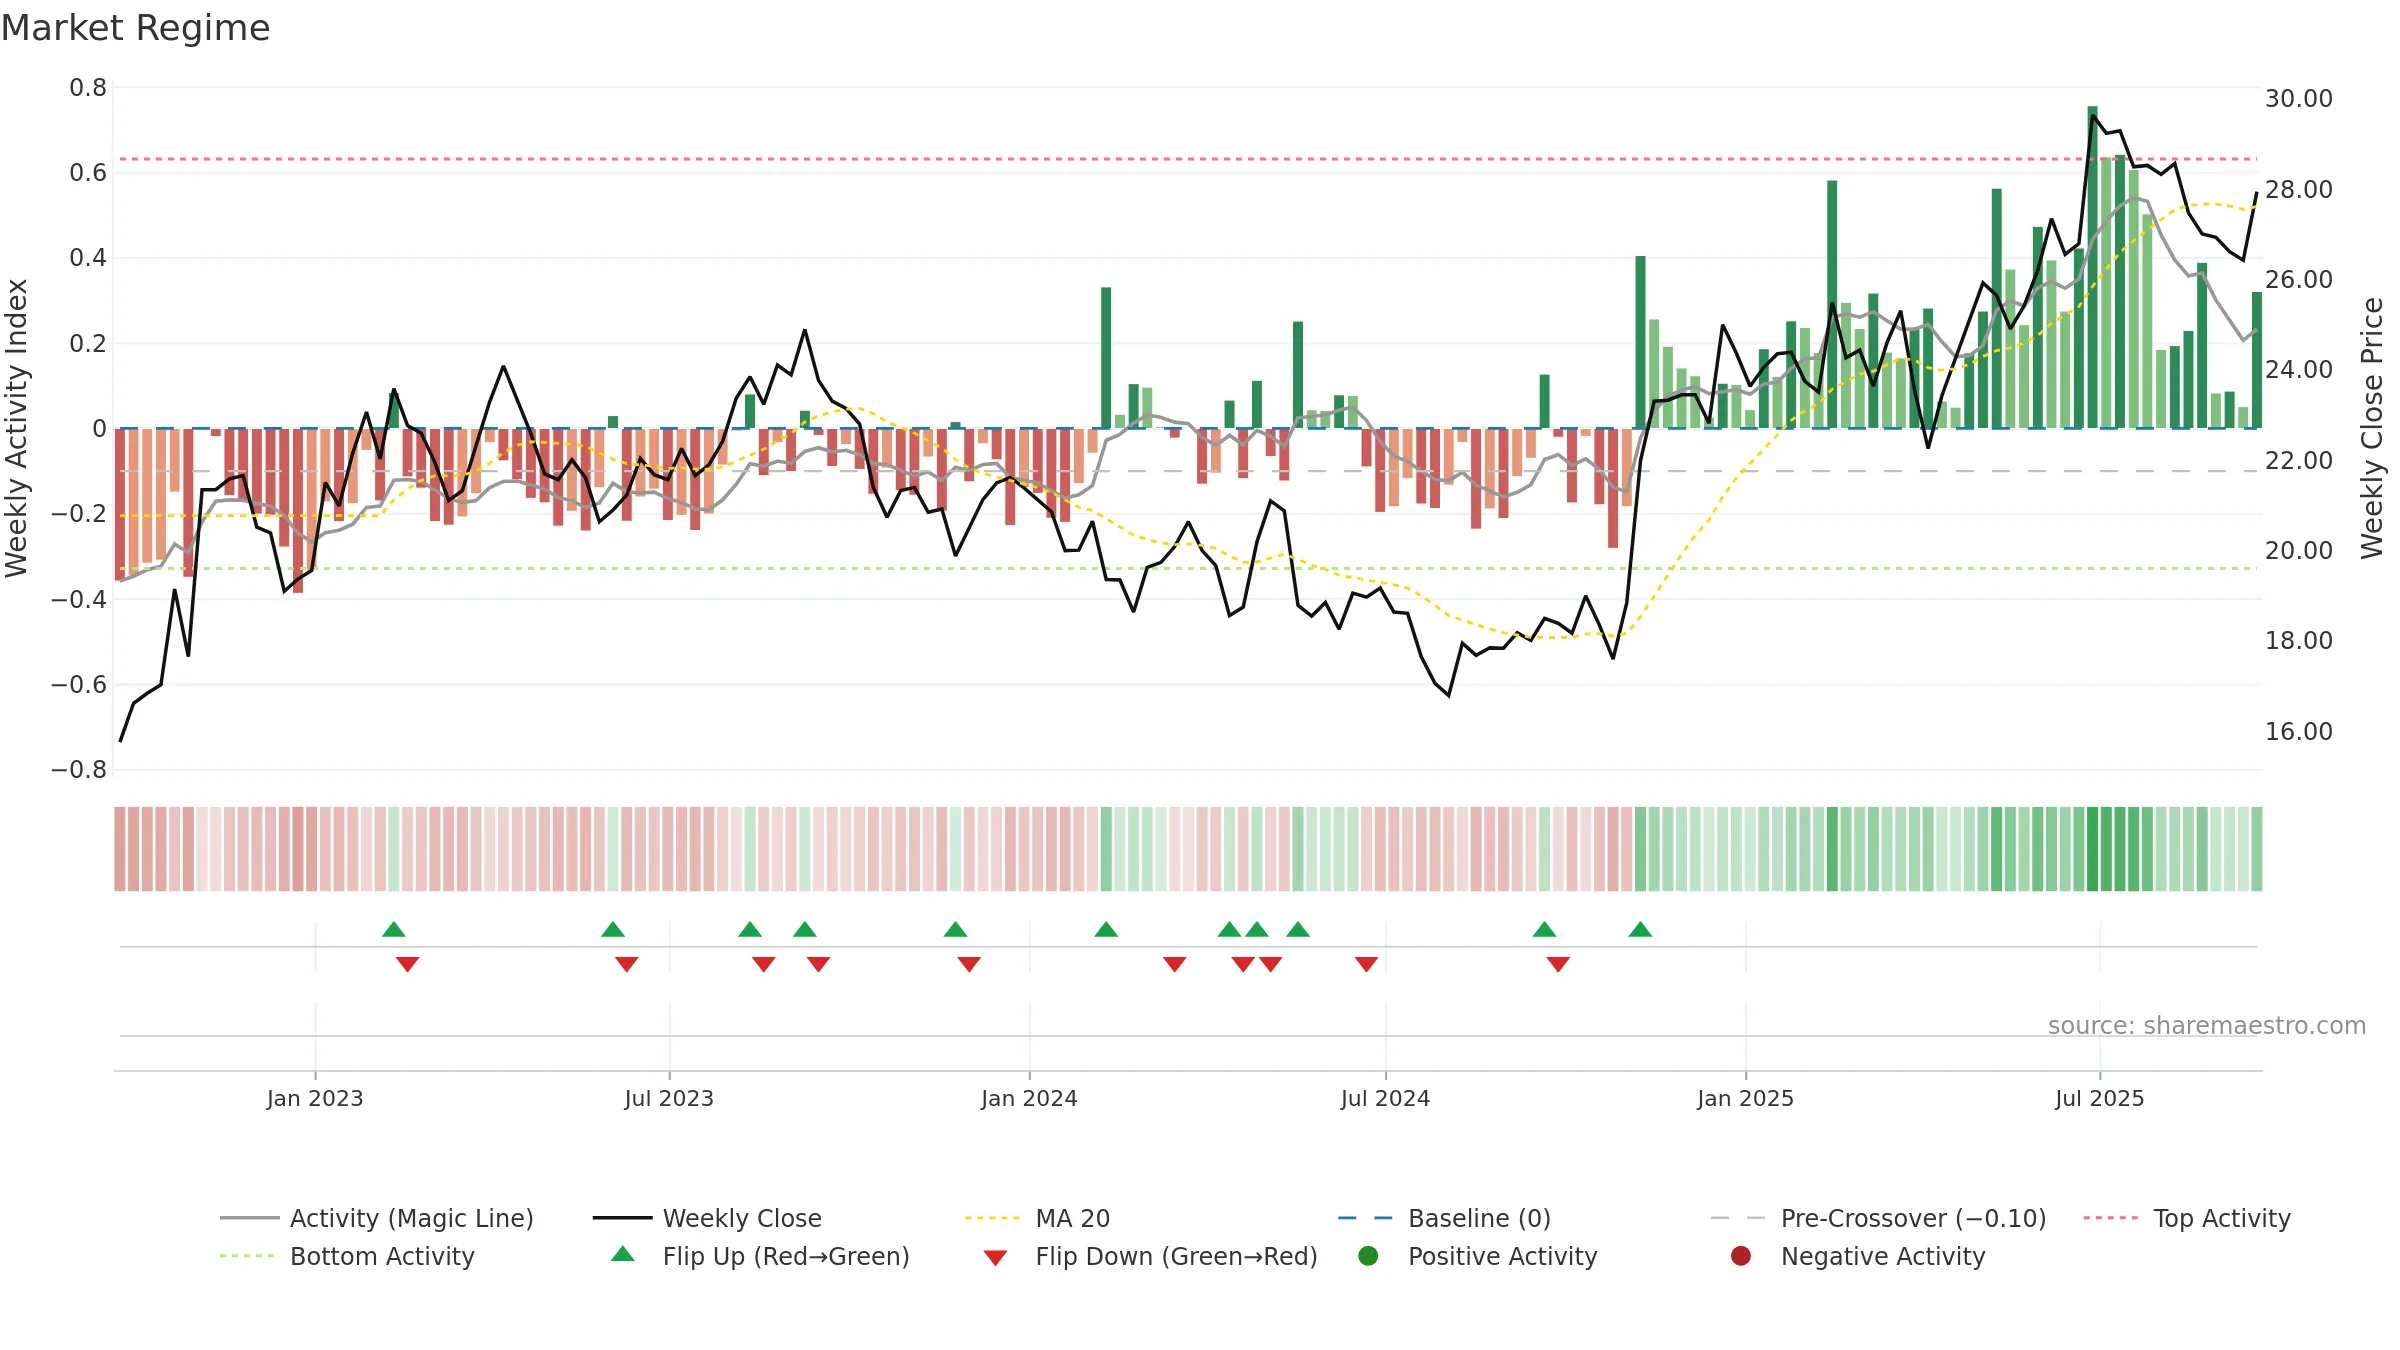
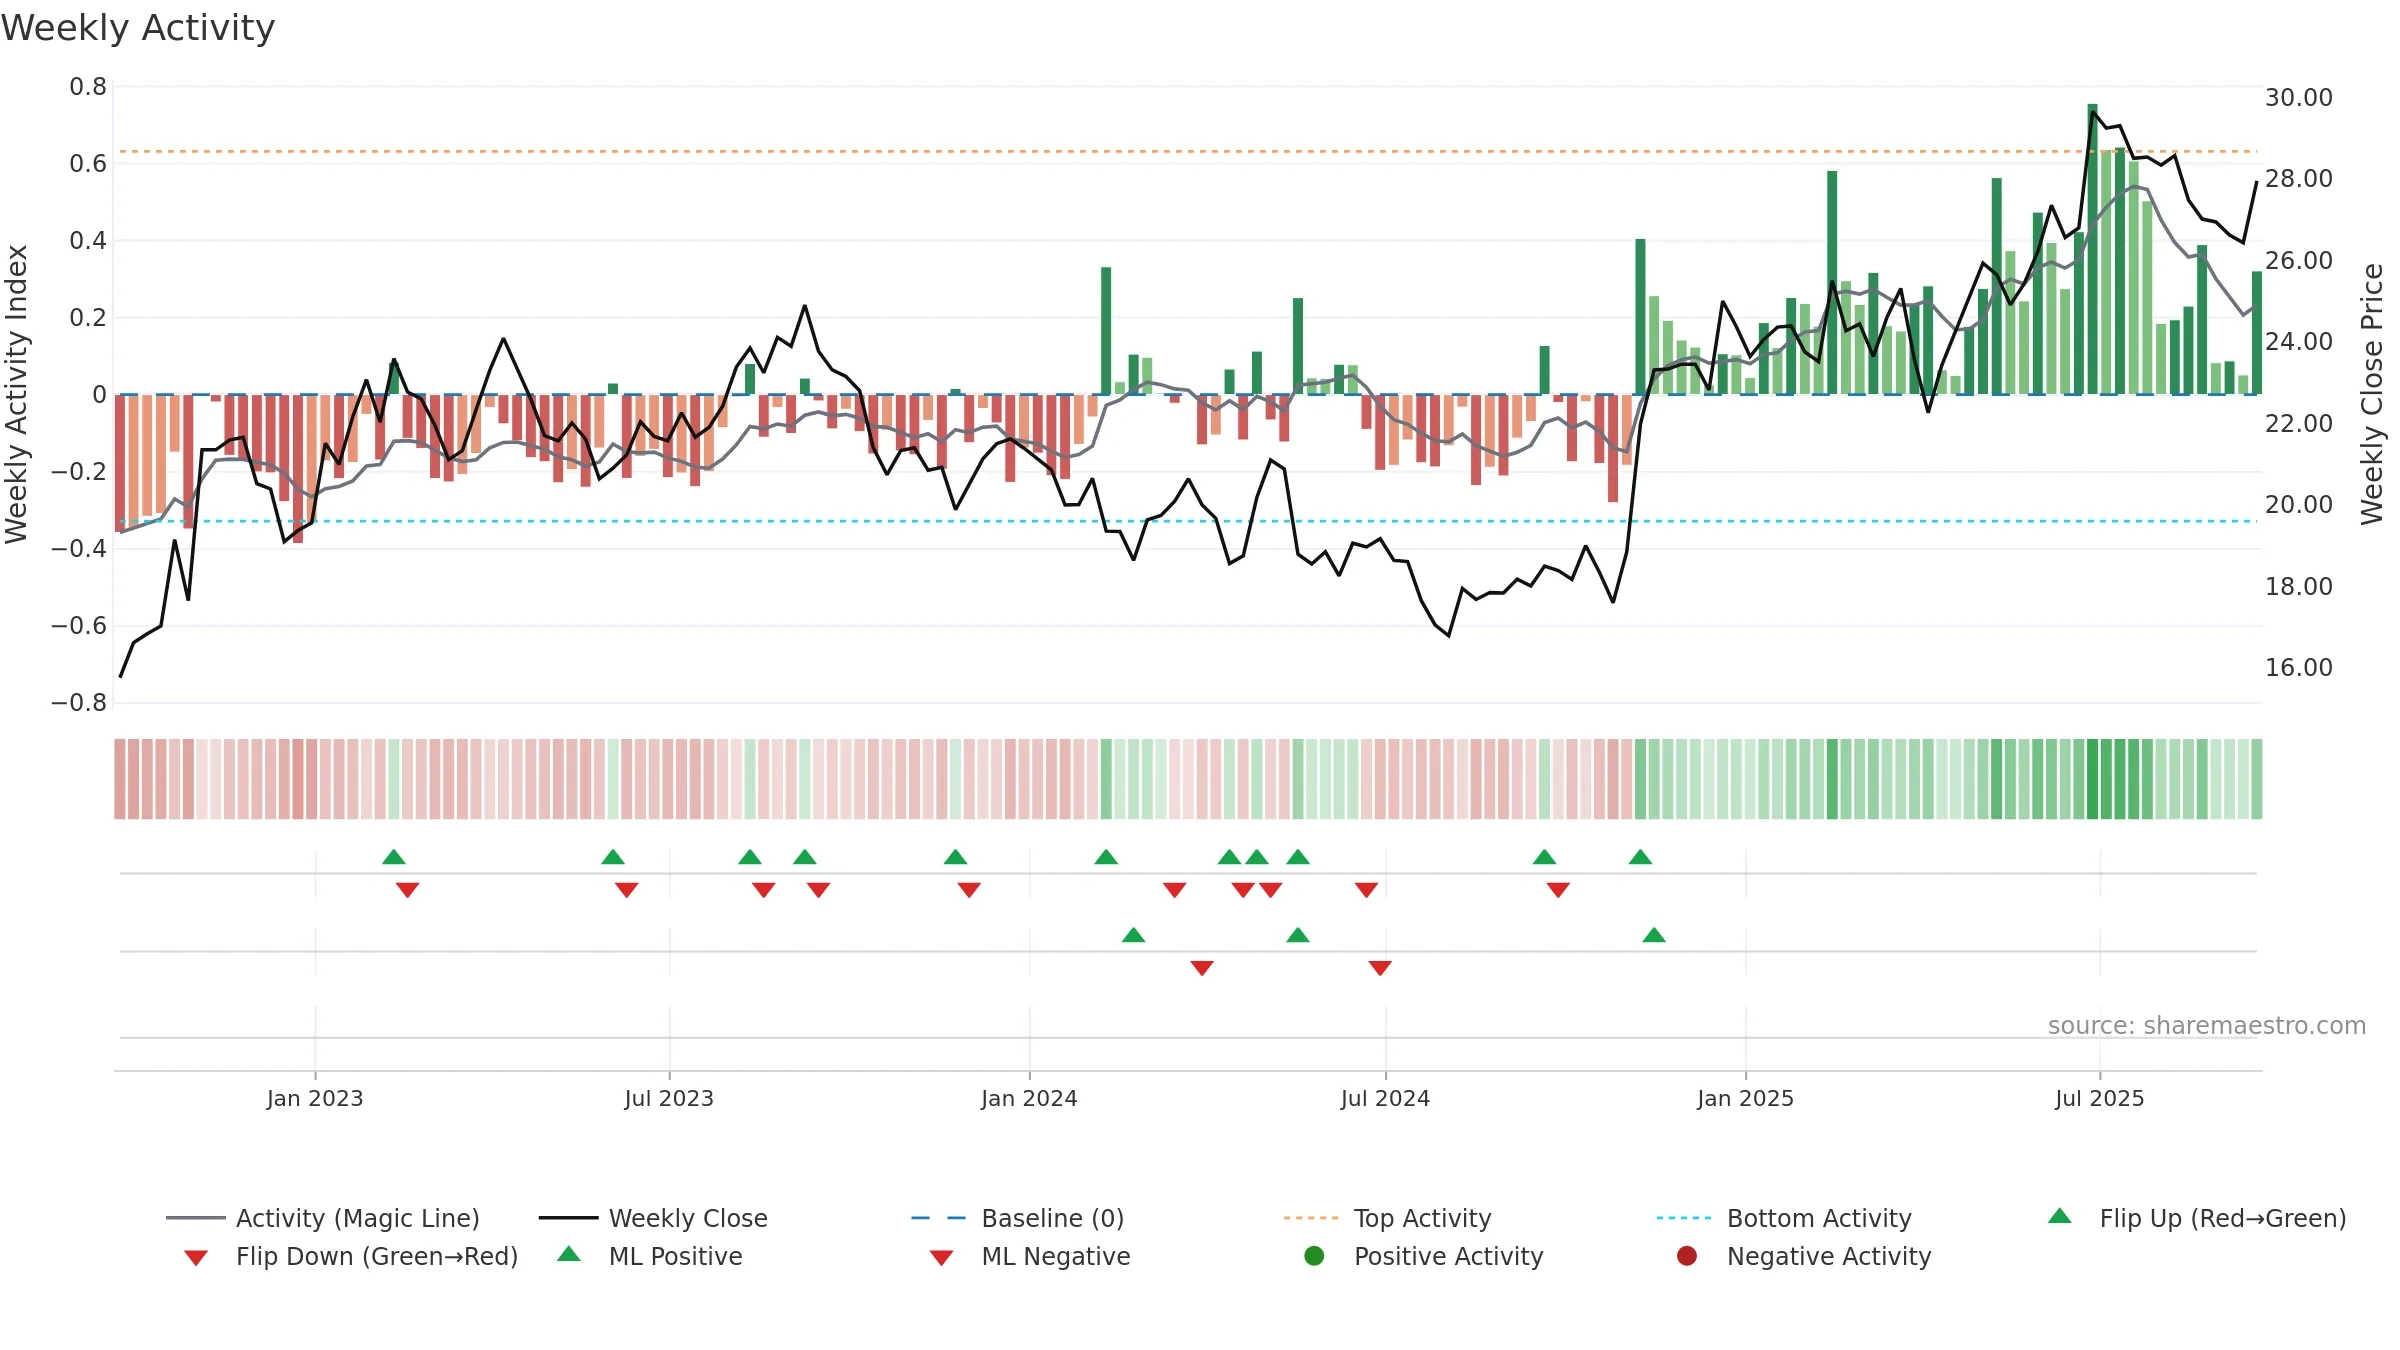
How to read this — Price slope is downward, indicating persistent supply pressure. Low weekly volatility favours steadier follow-through. Volume trend diverges from price — watch for fatigue or rotation. Price is stretched above its baseline; consolidation risk rises if activity fades. Price holds above key averages, indicating constructive participation.
Down-slope argues for patience; rallies can fade sooner unless participation improves. Because liquidity isn’t confirming, prefer evidence of fresh demand before chasing moves.
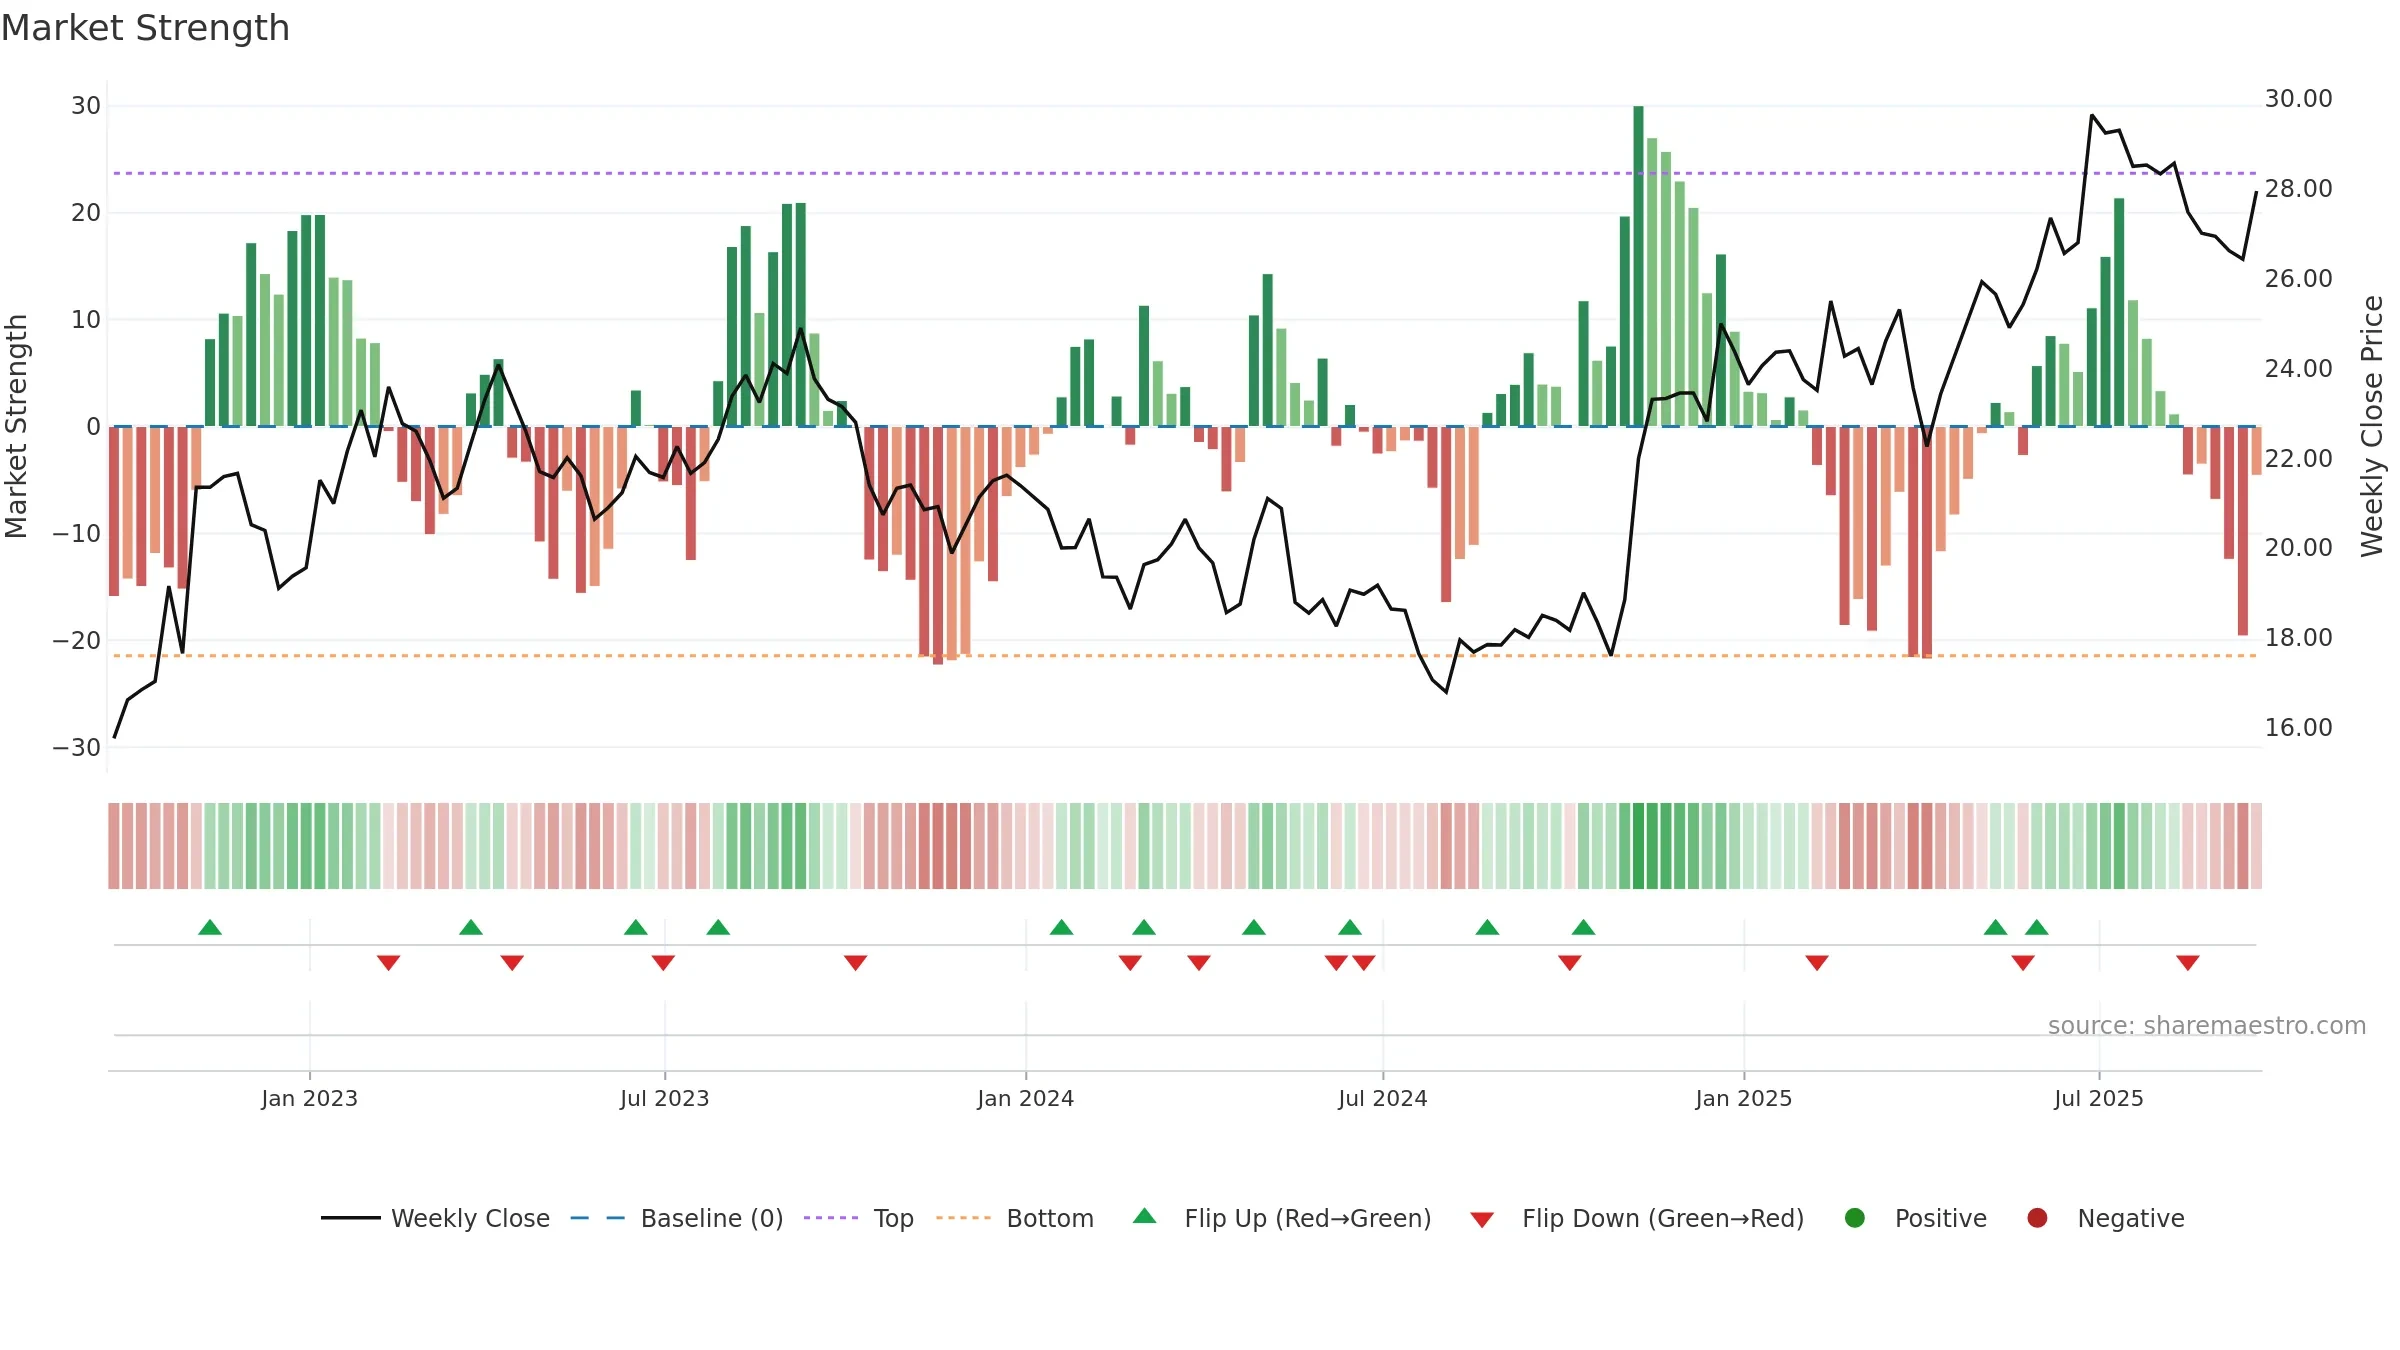
Gauge maps the trend signal to a 0–100 scale.
How to read this — Gauge is elevated but momentum is rolling over; topping risk is rising. Notable breakdown from ≥0.80 weakens trend quality.
Stay alert: protect gains or seek confirmation before adding risk.
Price is above fair value; upside may be capped without catalysts.
Conclusion
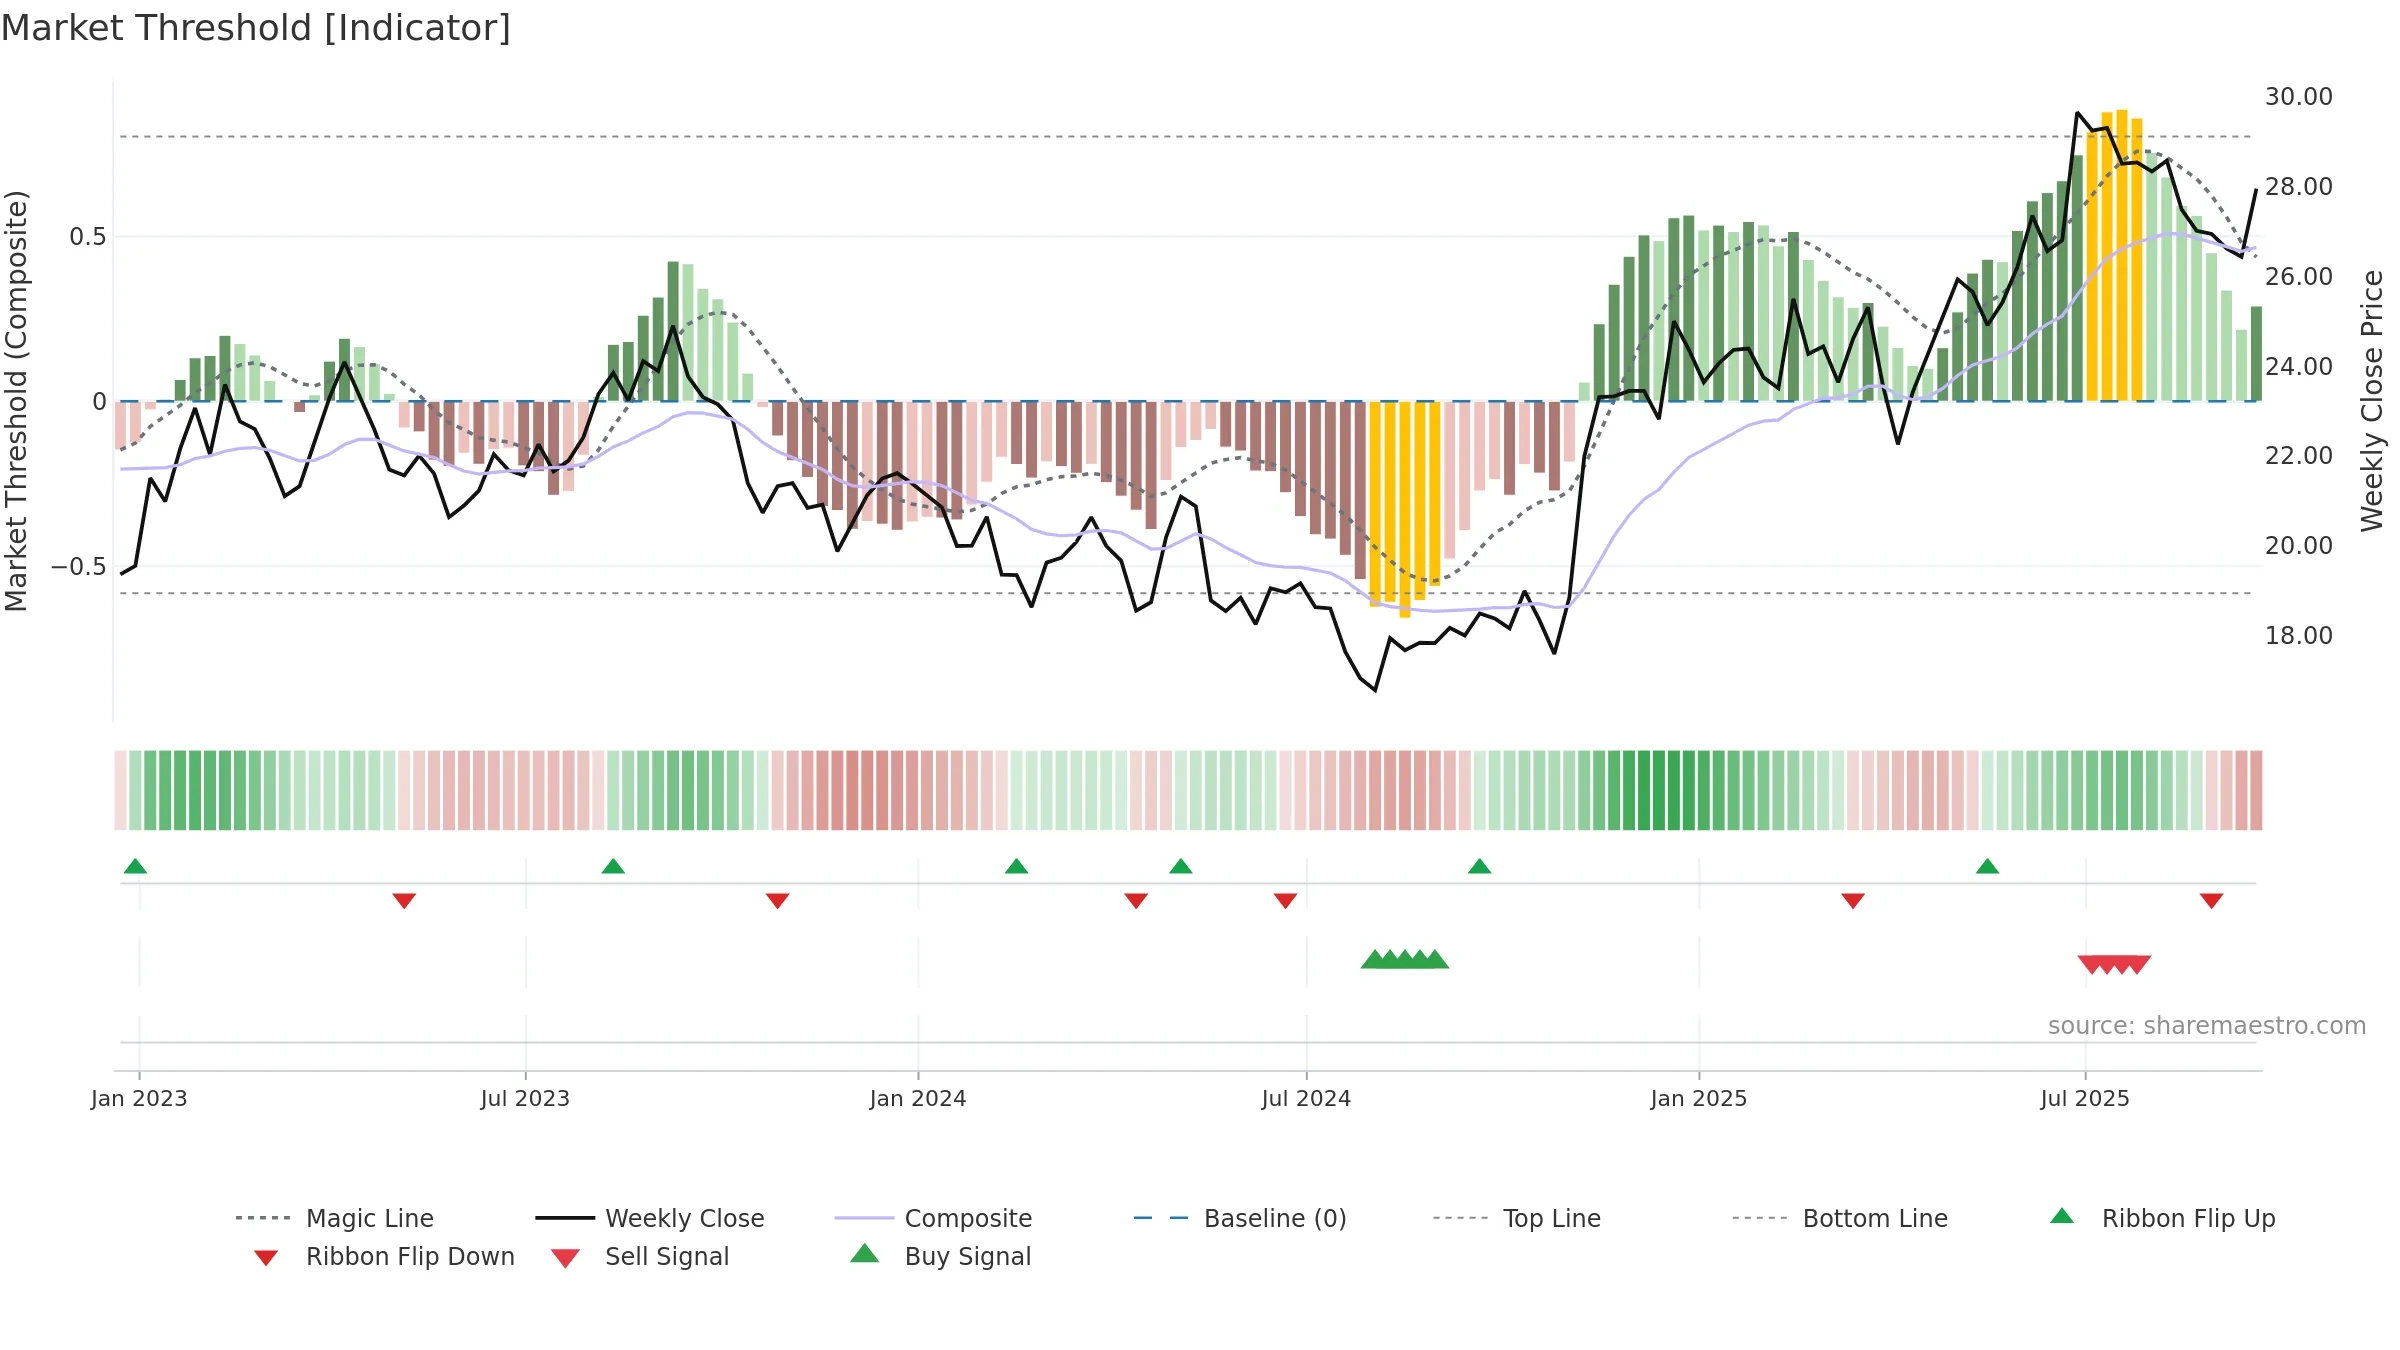
Negative setup. ★★☆☆☆ confidence. Price window: -1. Trend: Uptrend at Risk; gauge 75. In combination, liquidity diverges from price.
- Price holds above 8w & 26w averages
- Low return volatility supports durability
- High-level but rolling over (topping risk)
- Momentum is weak/falling
- Liquidity diverges from price
- Negative multi-week performance
Why: Price window -1.34% over 8w. Close is -2.17% below the prior-window high. Return volatility 1.22%. Volume trend rising. Liquidity divergence with price. Trend state uptrend at risk. High-regime (0.80–1.00) downticks 2/5 (40.0%) • Accumulating. Momentum neutral and falling. Valuation limited upside without catalysts.
Tip: Most metrics include a hover tooltip where they appear in the report.