Utz Brands, Inc.
UTZ NYSE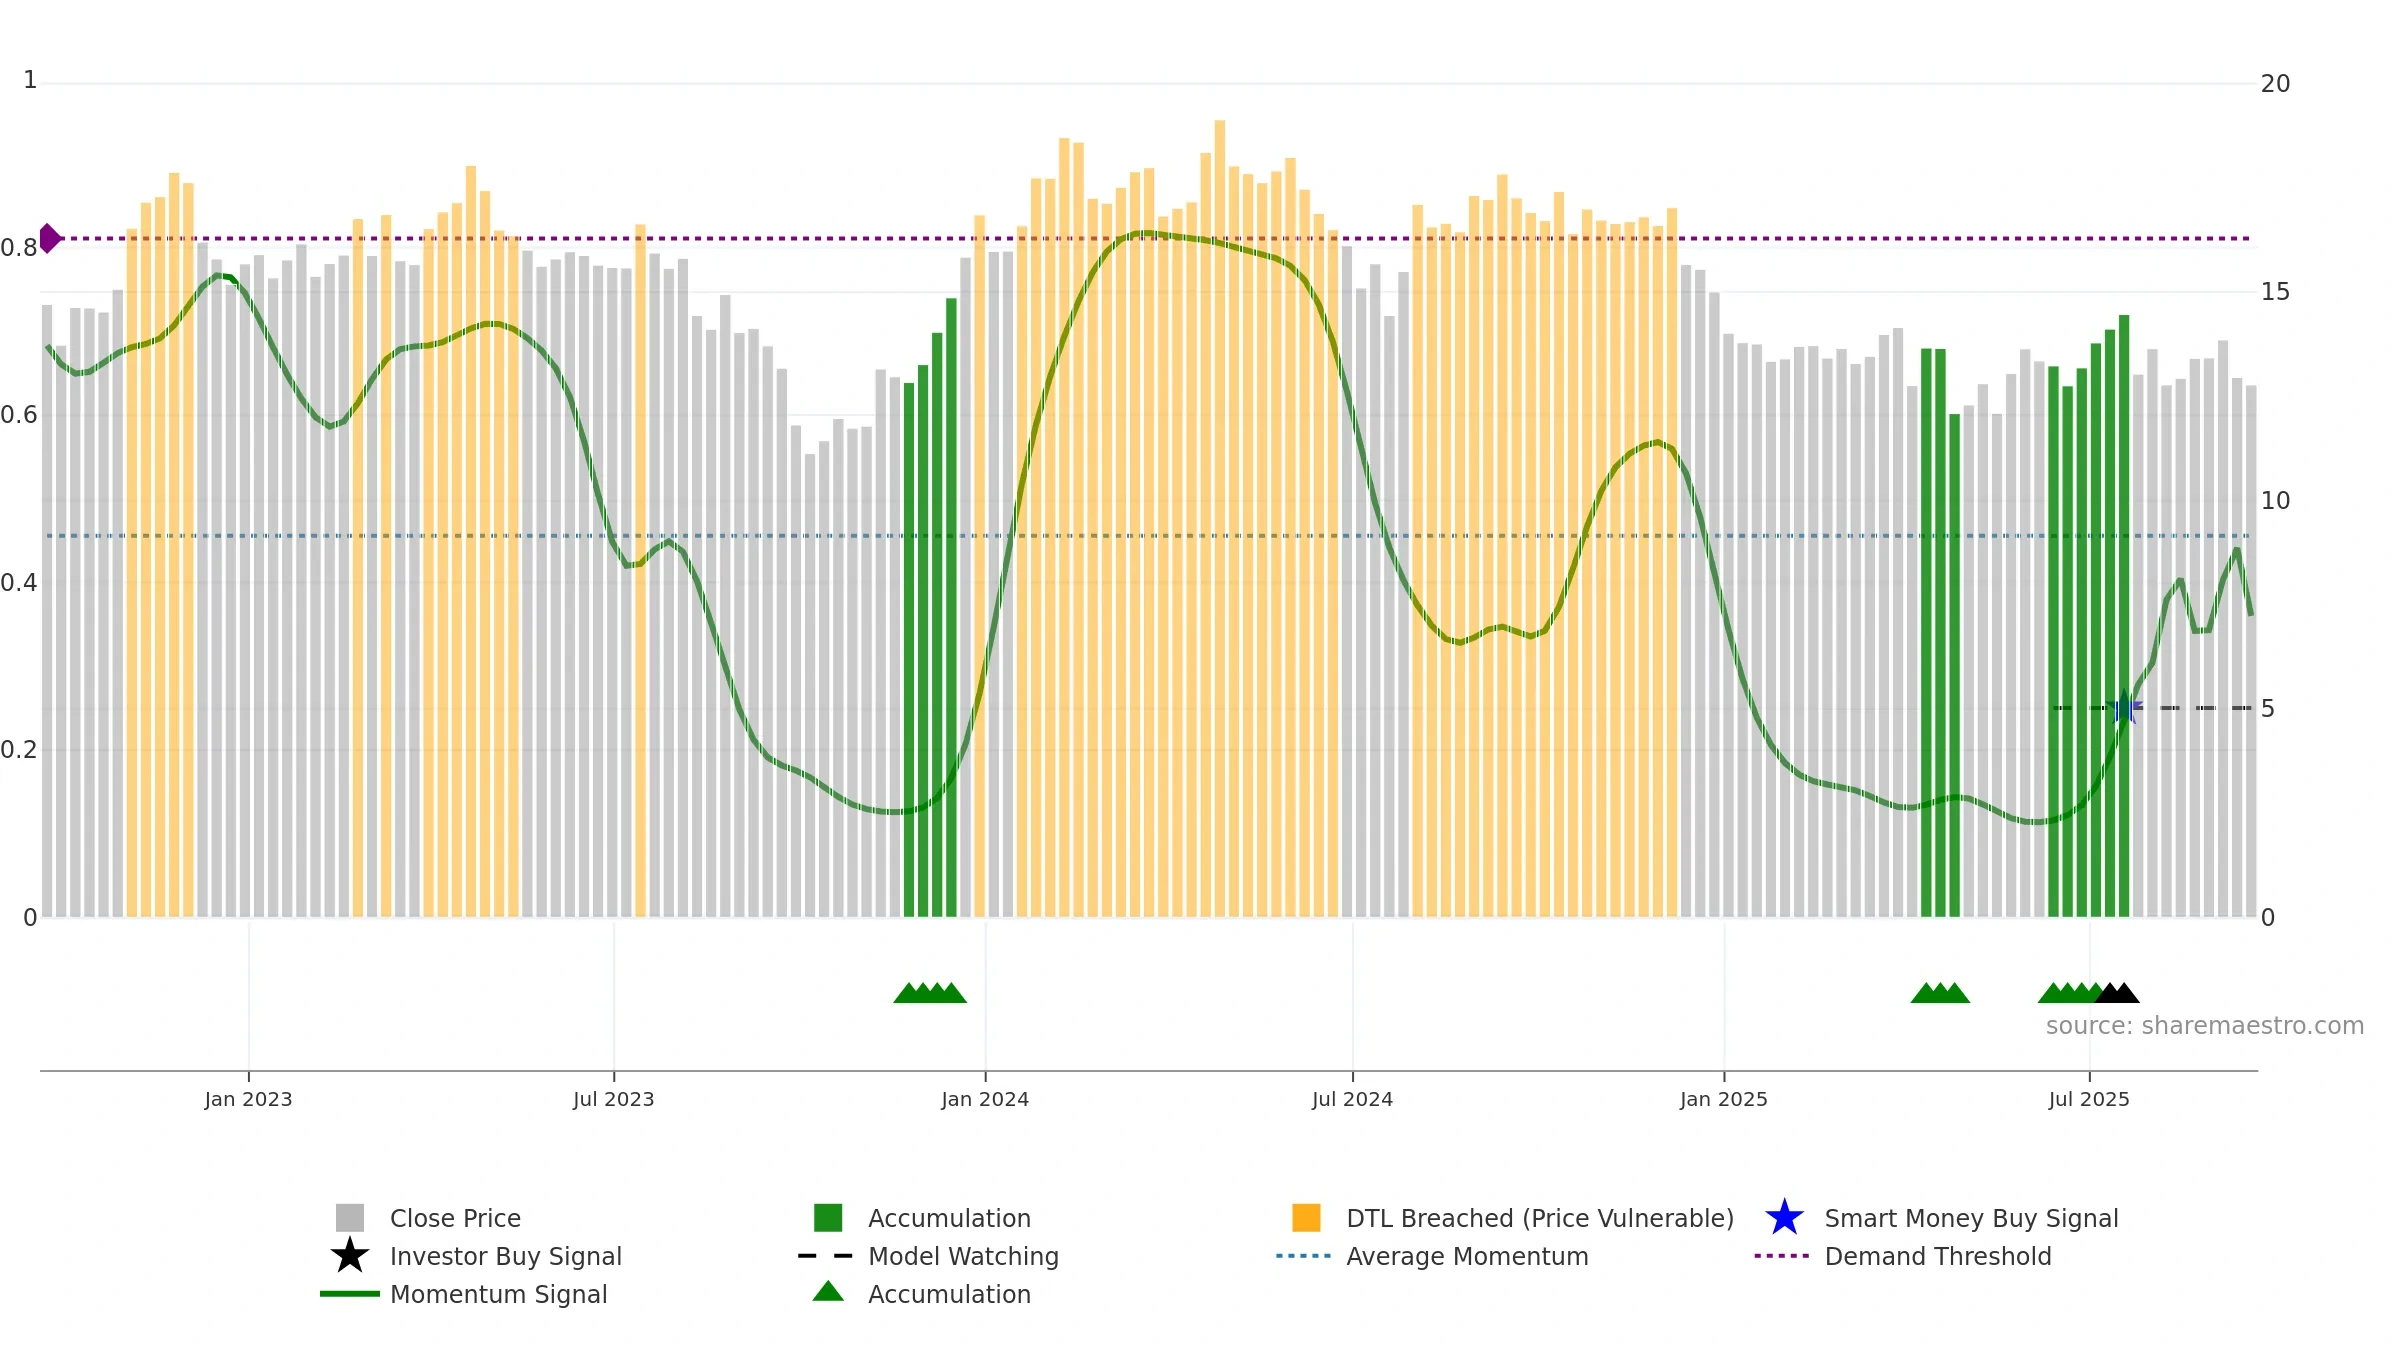
Weekly Summary
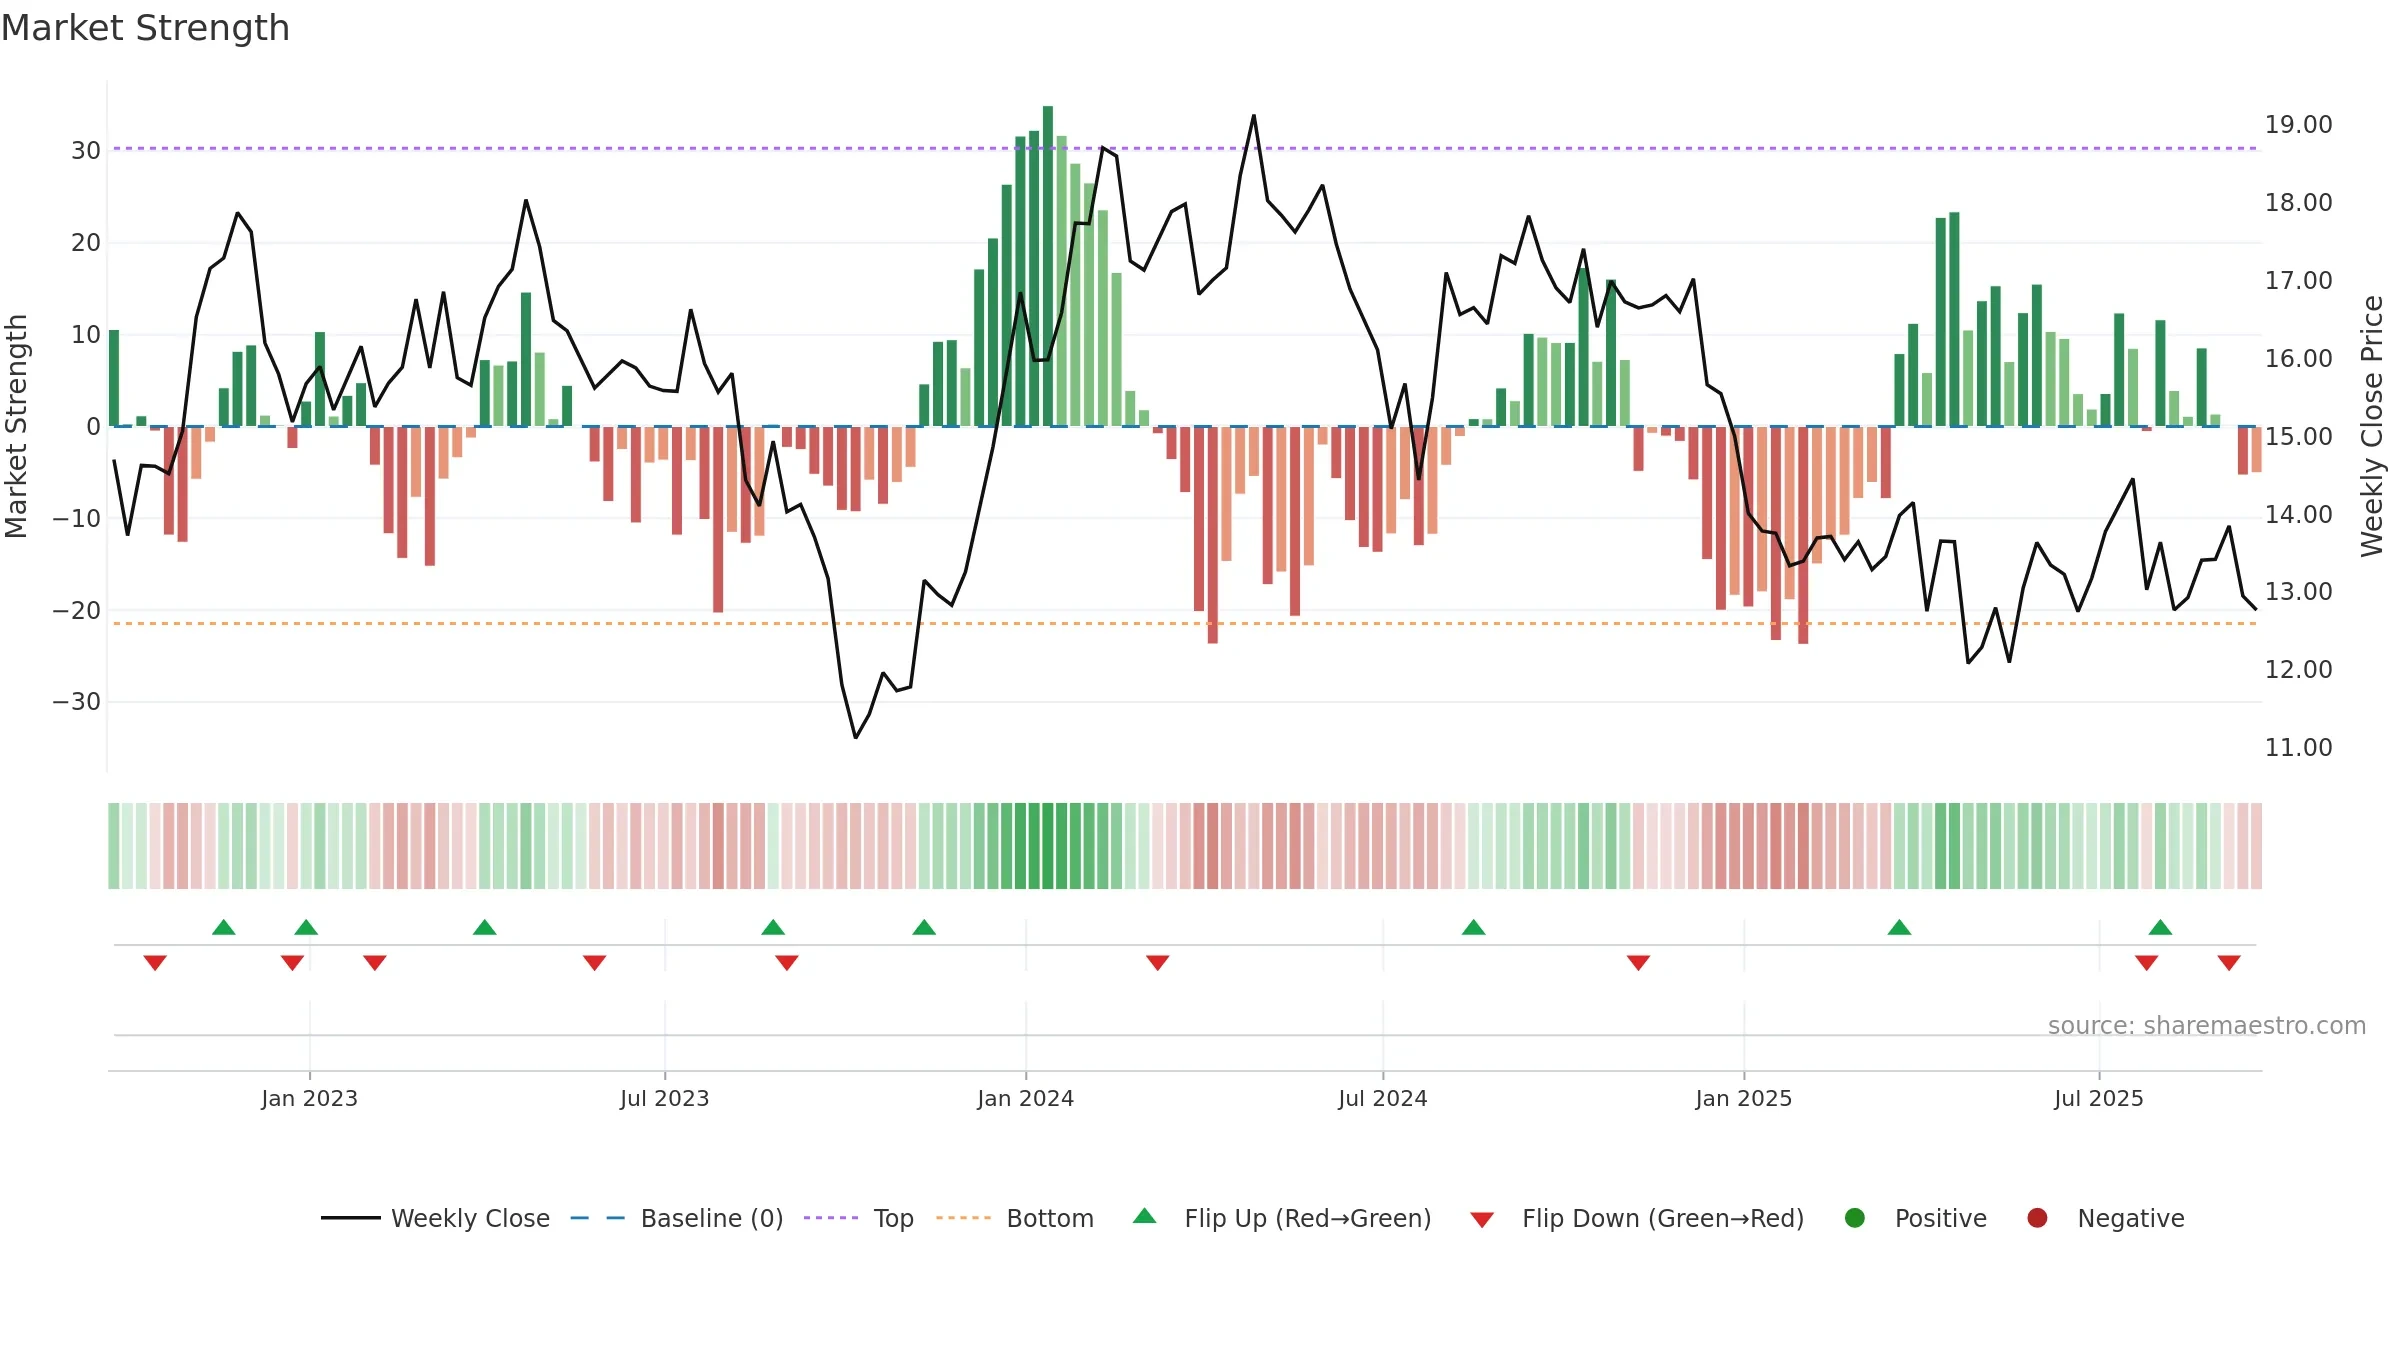
Utz Brands, Inc. closed at 12.7700 (-0.55% WoW) . Data window ends Fri, 19 Sep 2025.
How to read this — Price slope is downward, indicating persistent supply pressure. Volume and price are moving in the same direction — a constructive confirmation. Returns are positively correlated with volume — strength tends to arrive on higher activity. Price sits below key averages, keeping pressure on the tape.
Down-slope argues for patience; rallies can fade sooner unless participation improves.
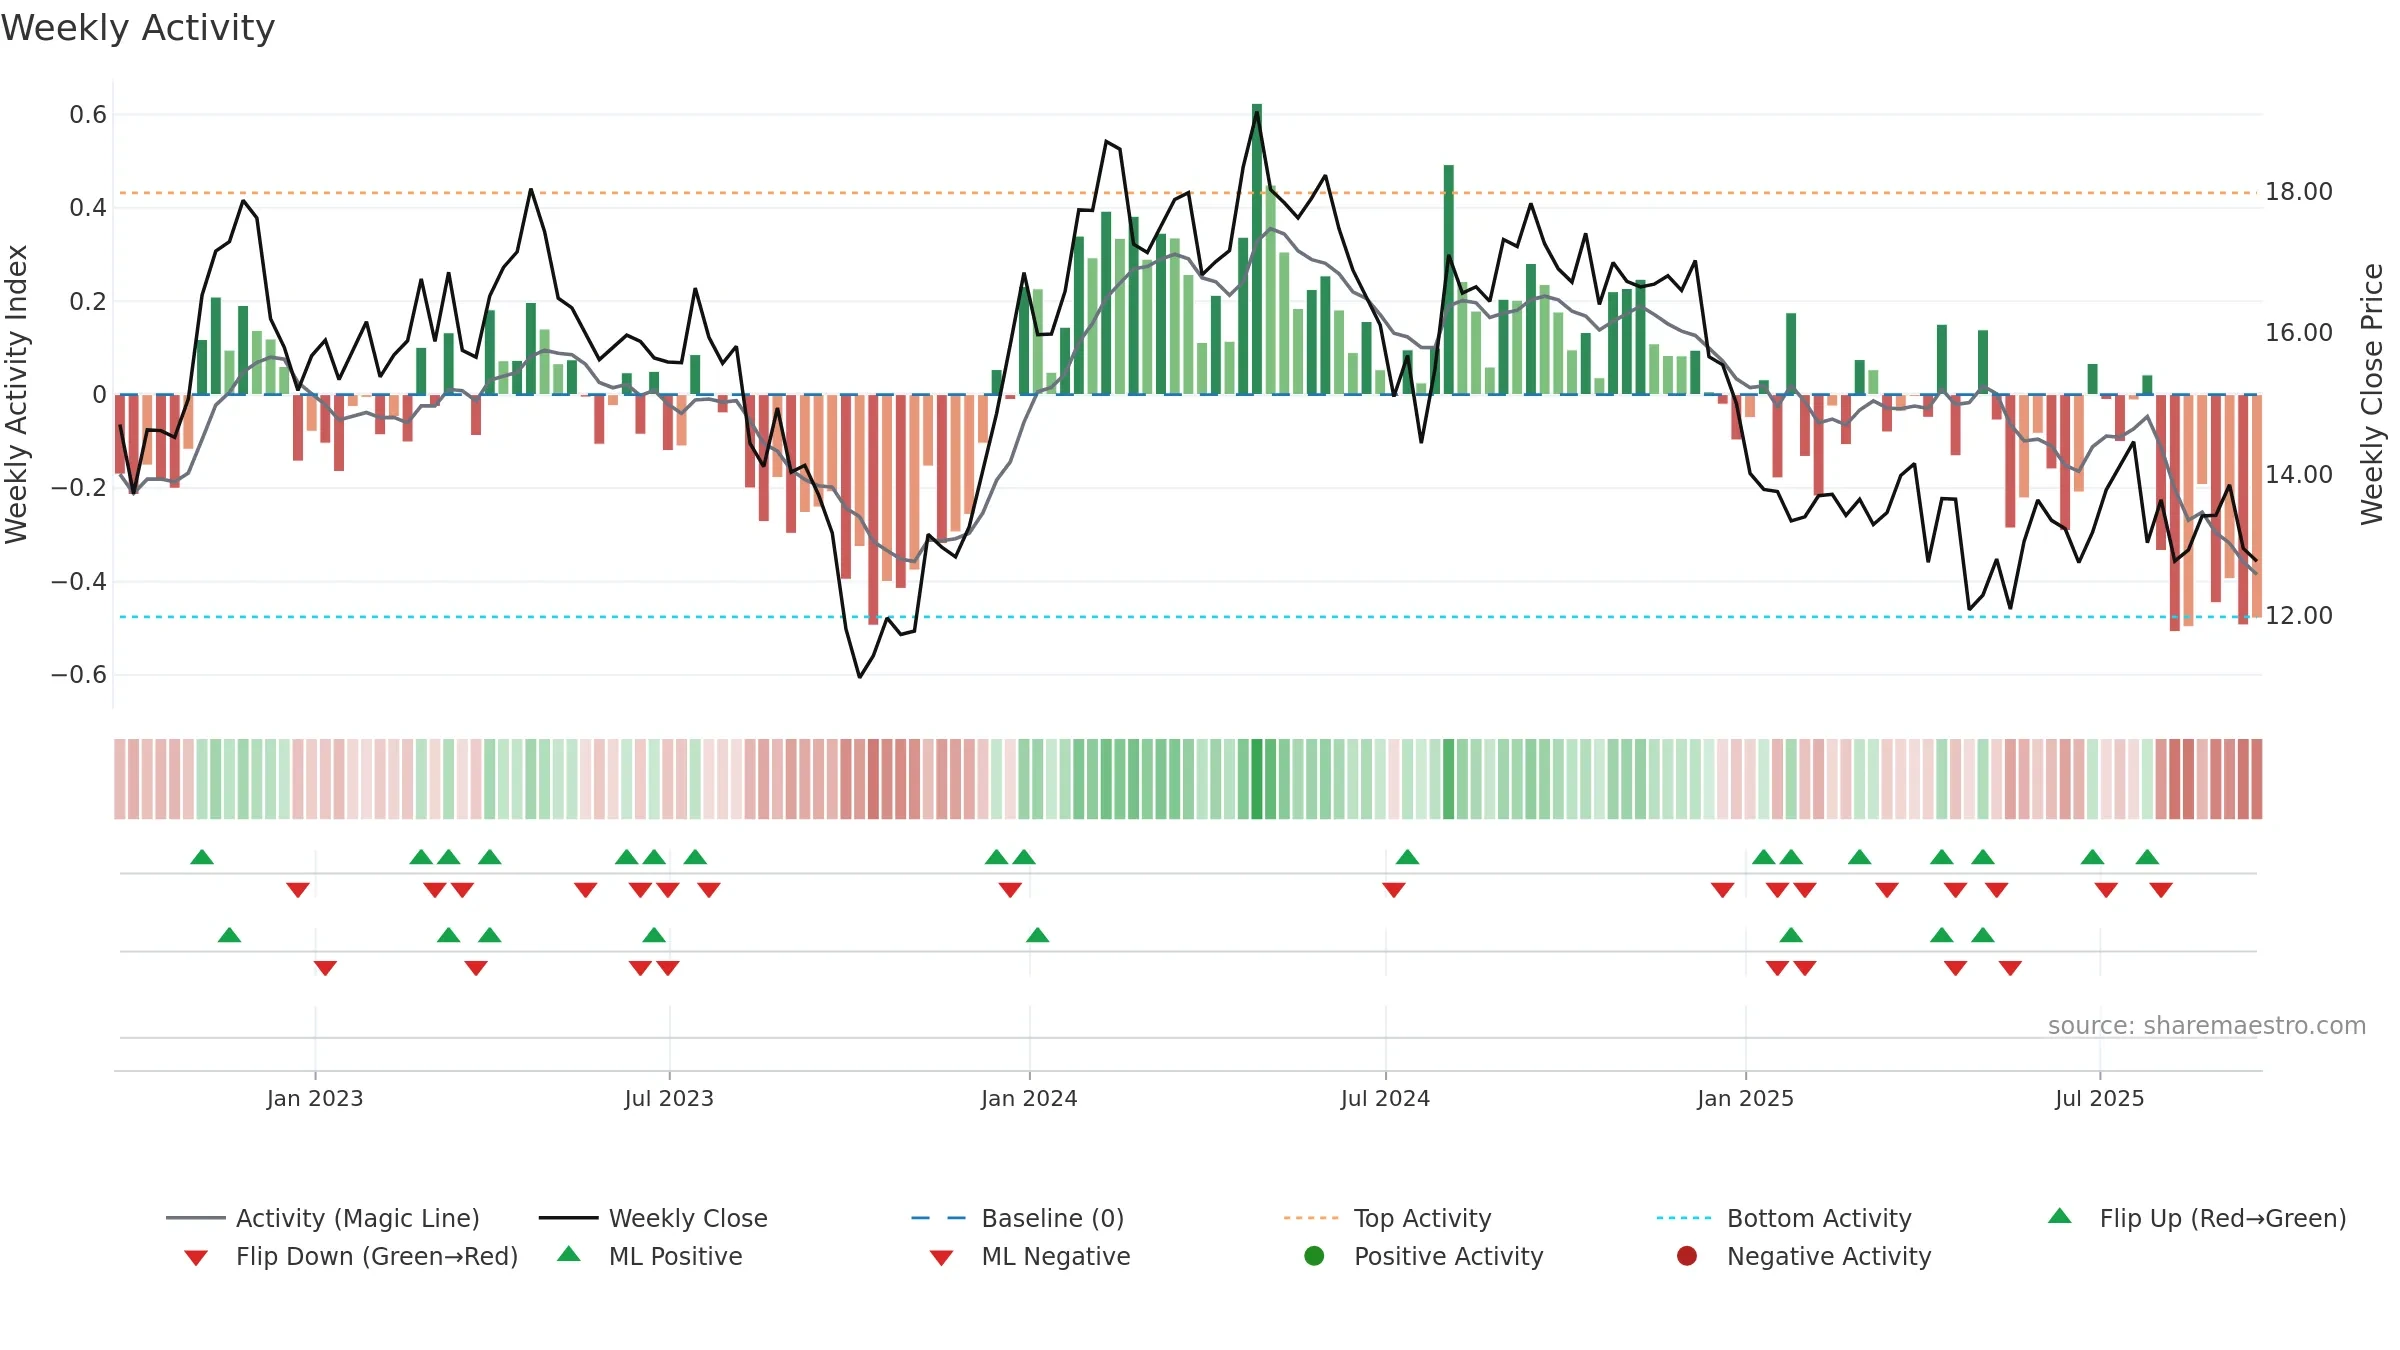
Gauge maps the trend signal to a 0–100 scale.
How to read this — Range-bound conditions; conviction is limited until a break or acceleration emerges. Sub-0.40 print confirms downside control.
Wait for a directional break or improving acceleration.

Relative strength is Negative
(< 0%, underperforming).
Latest MRS: -11.57% (week ending Fri, 19 Sep 2025).
Slope: Falling over 8w.
Notes:
- Below zero line indicates relative weakness vs benchmark.
- MRS slope falling over ~8 weeks.
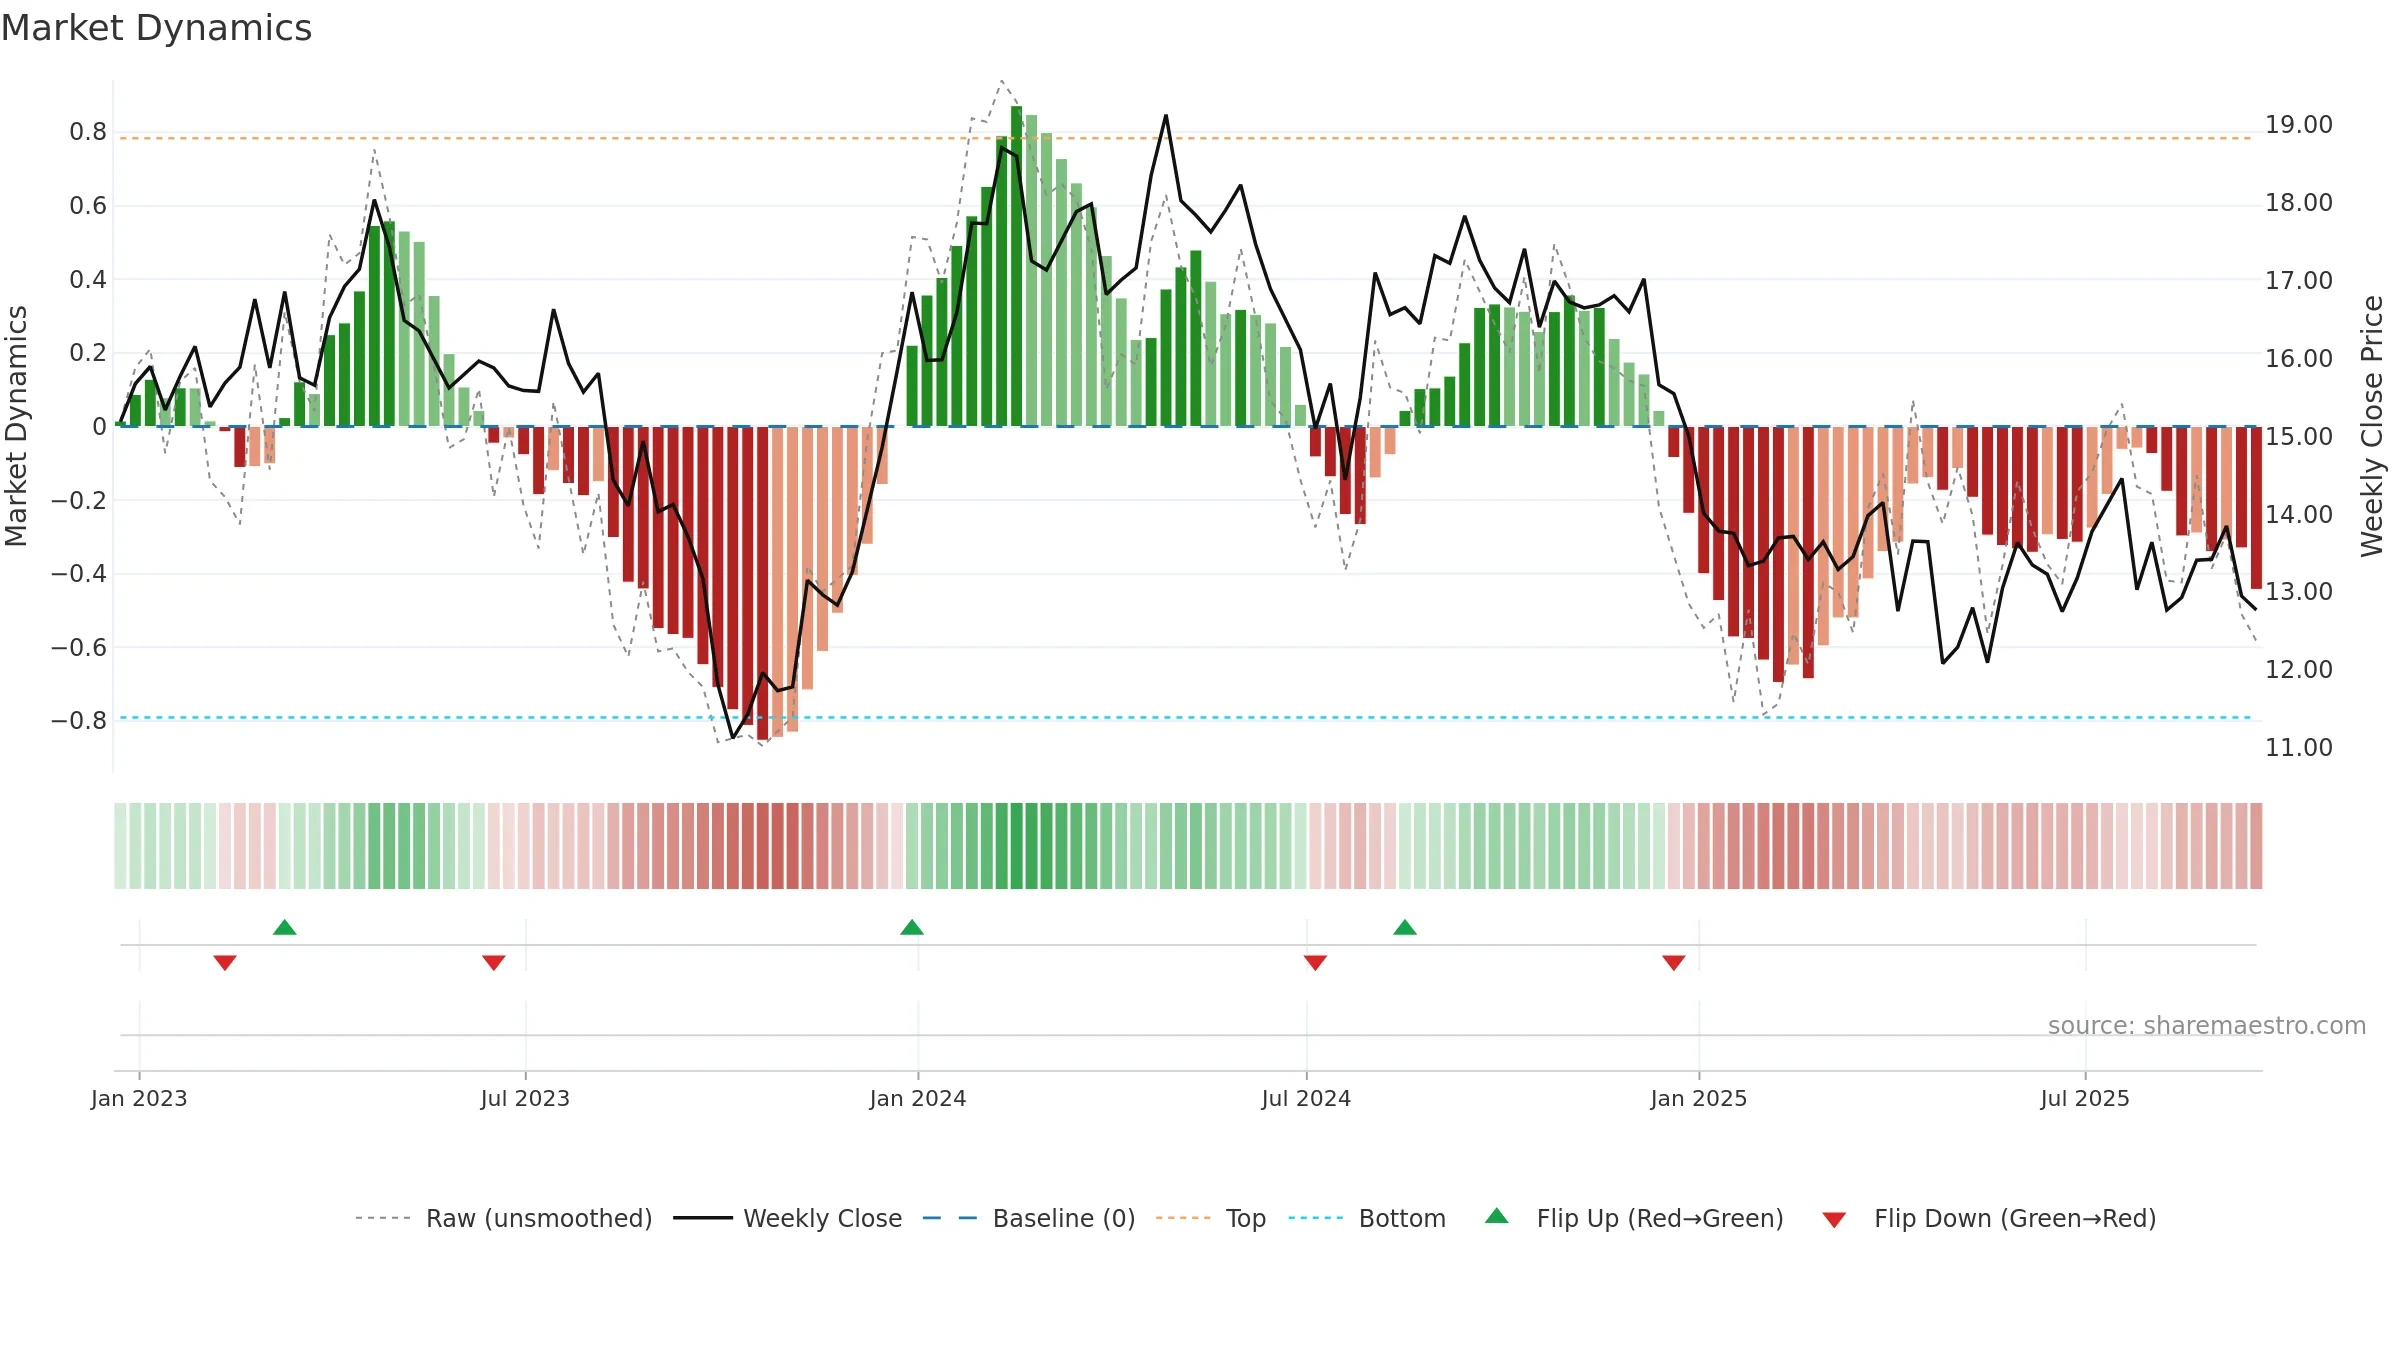
Price is below fair value; potential upside if momentum constructive.
Conclusion
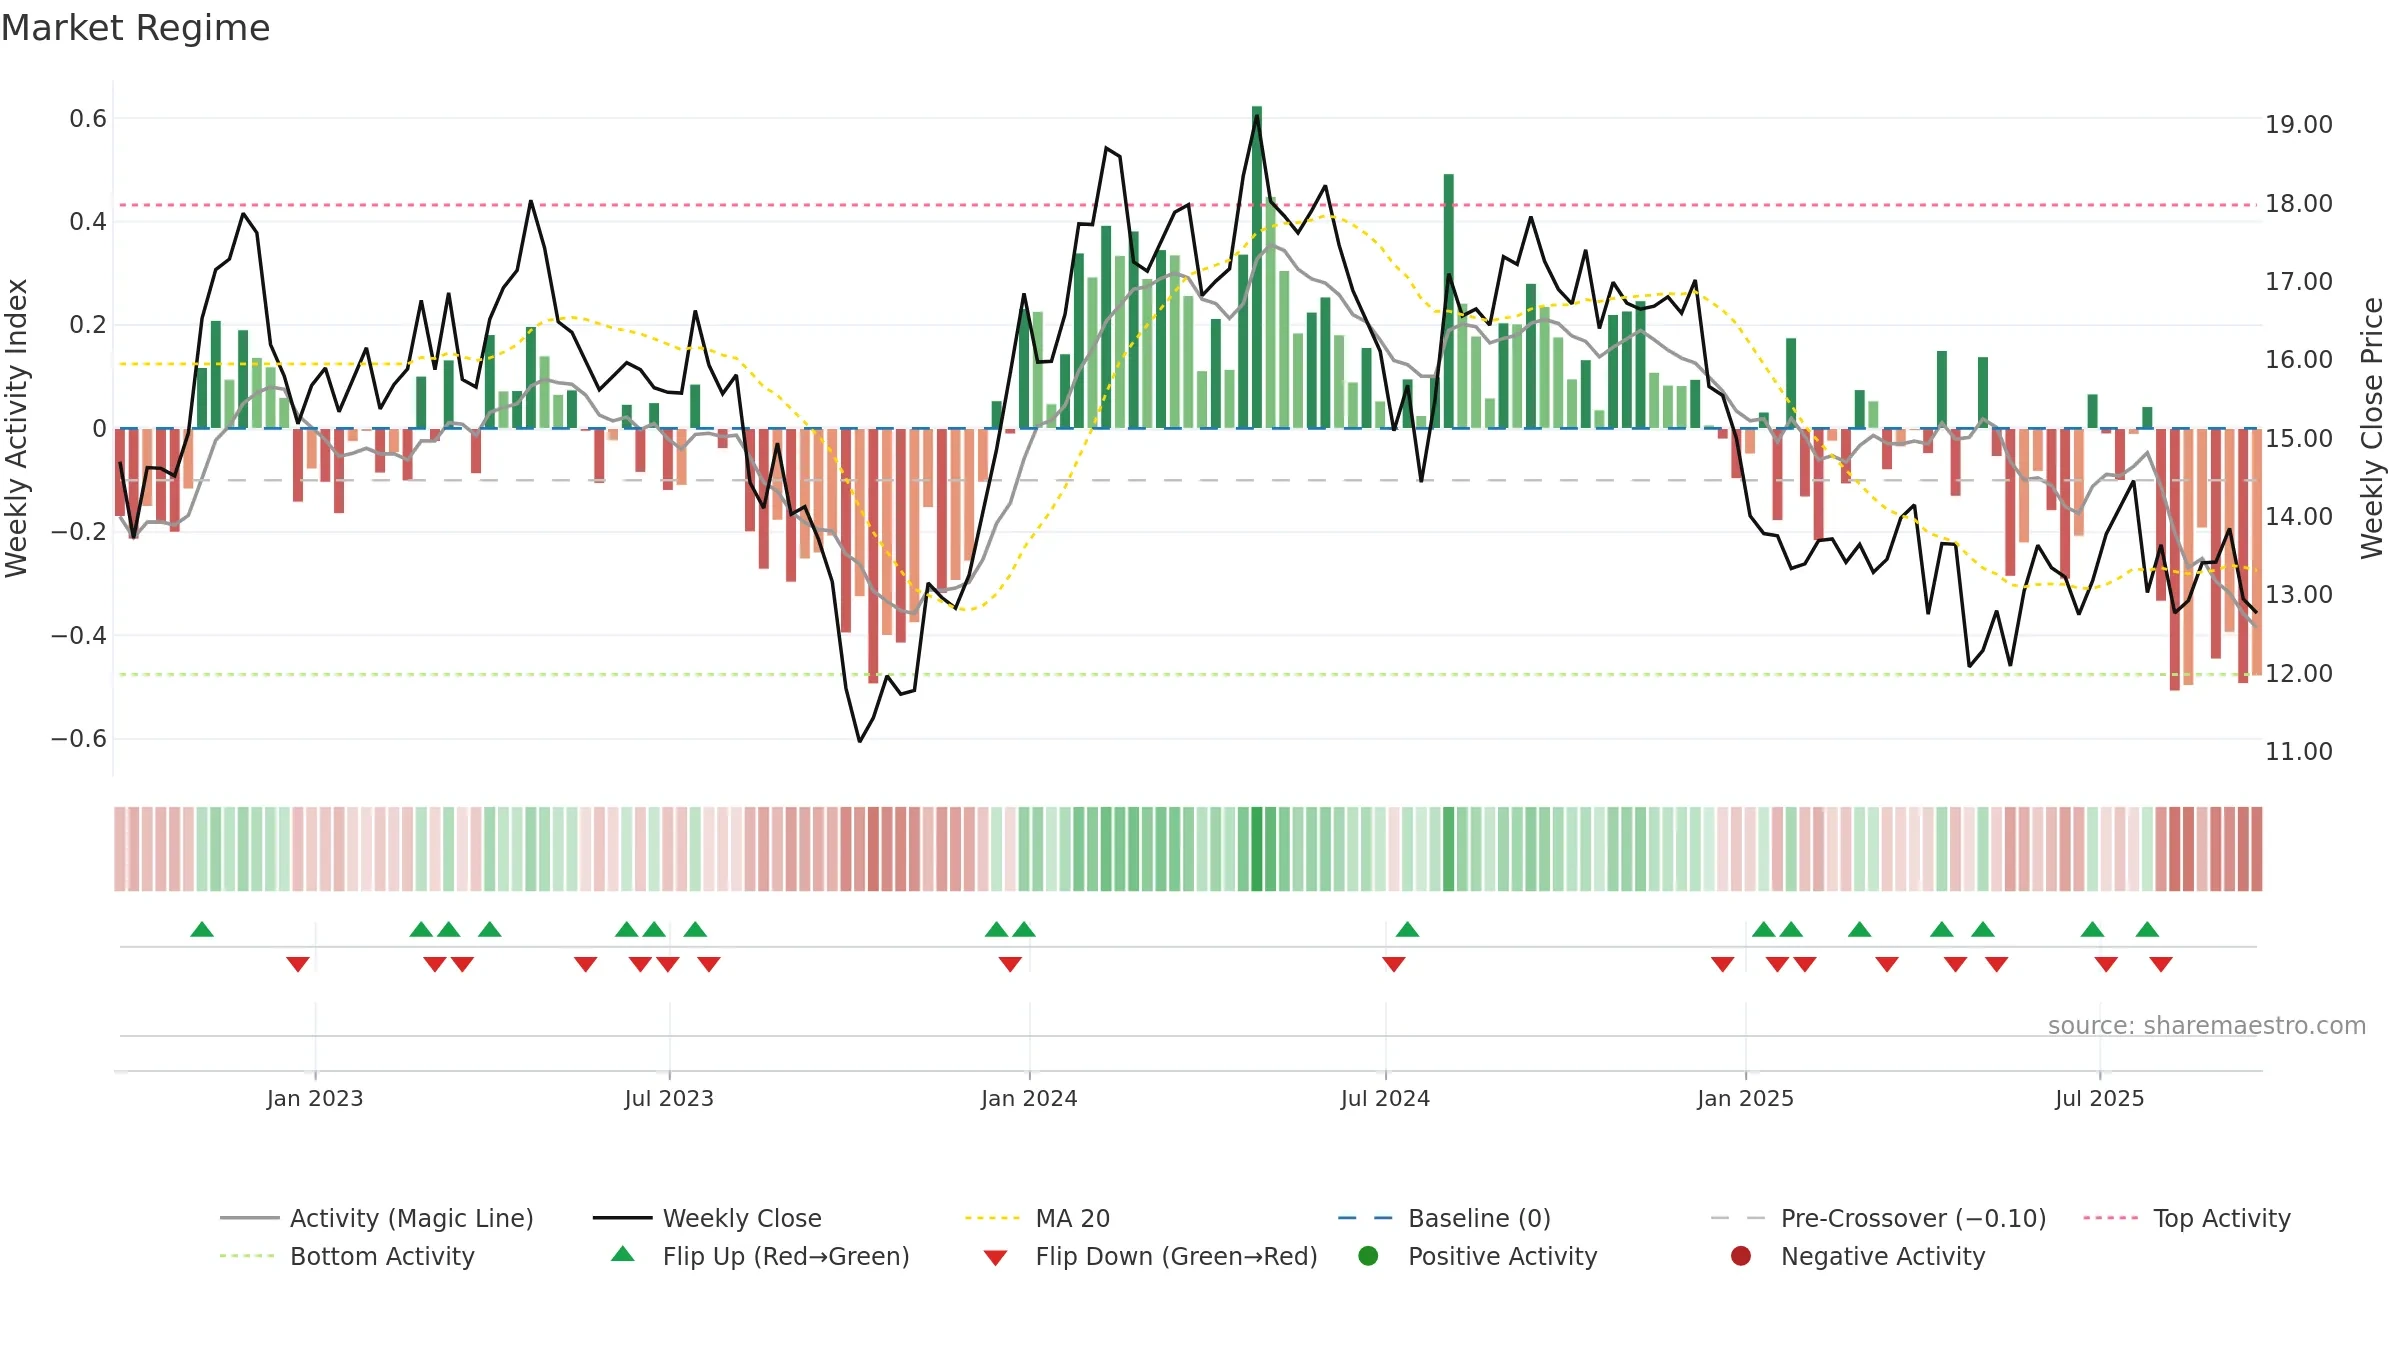
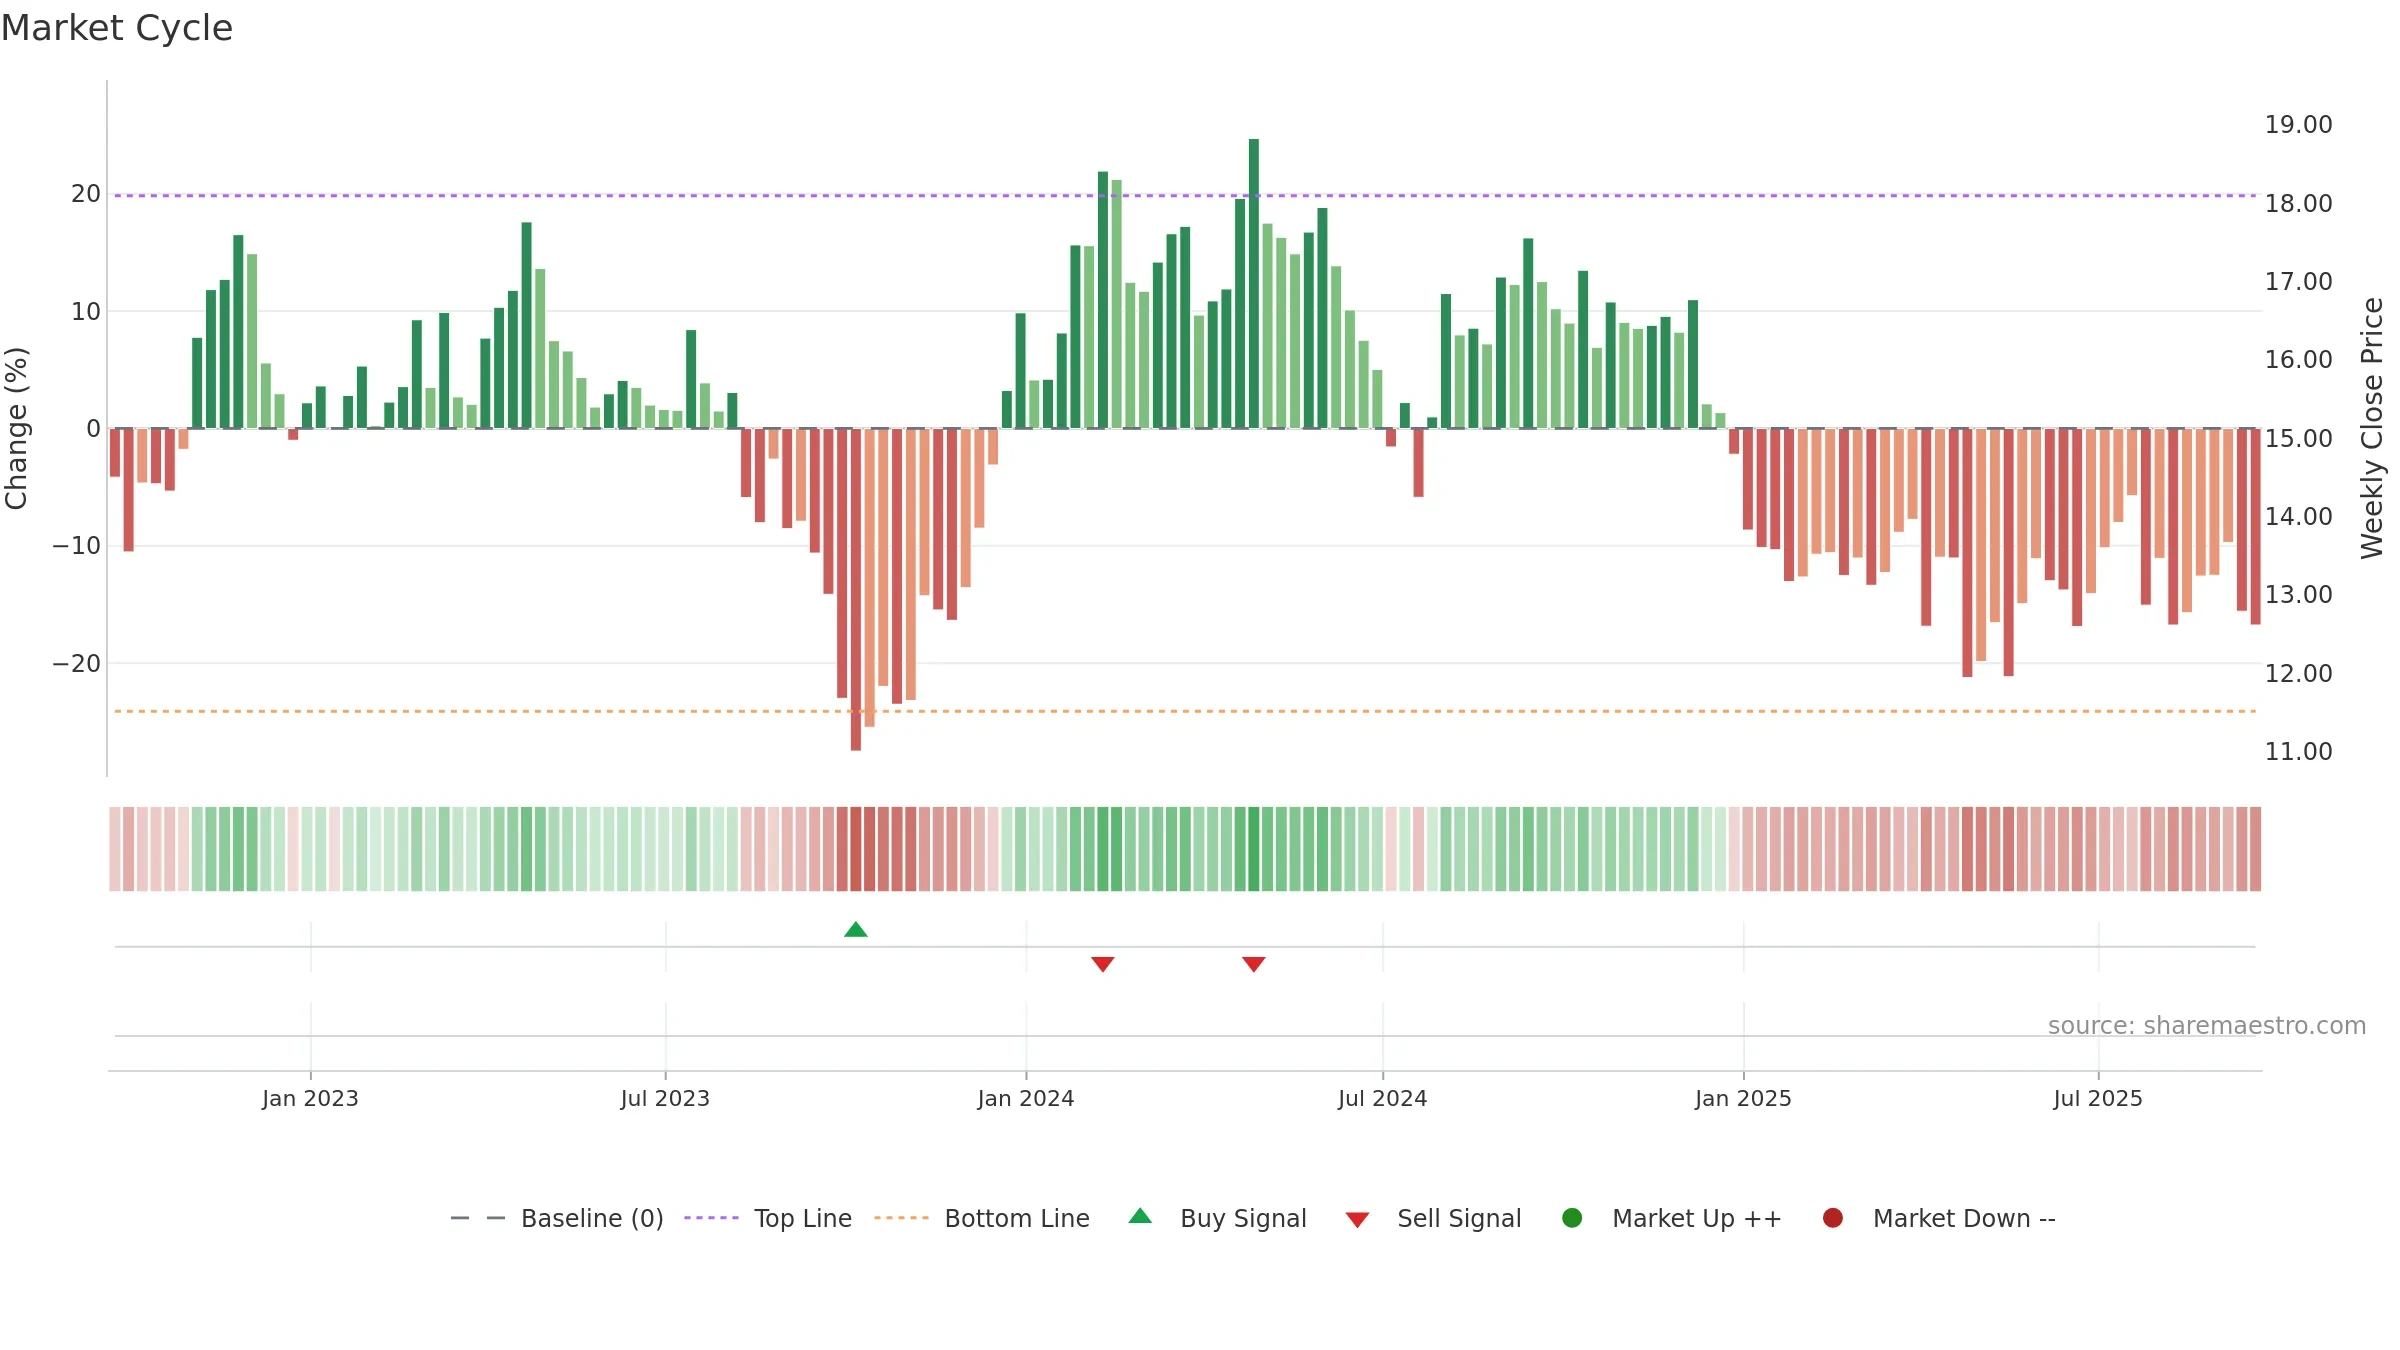
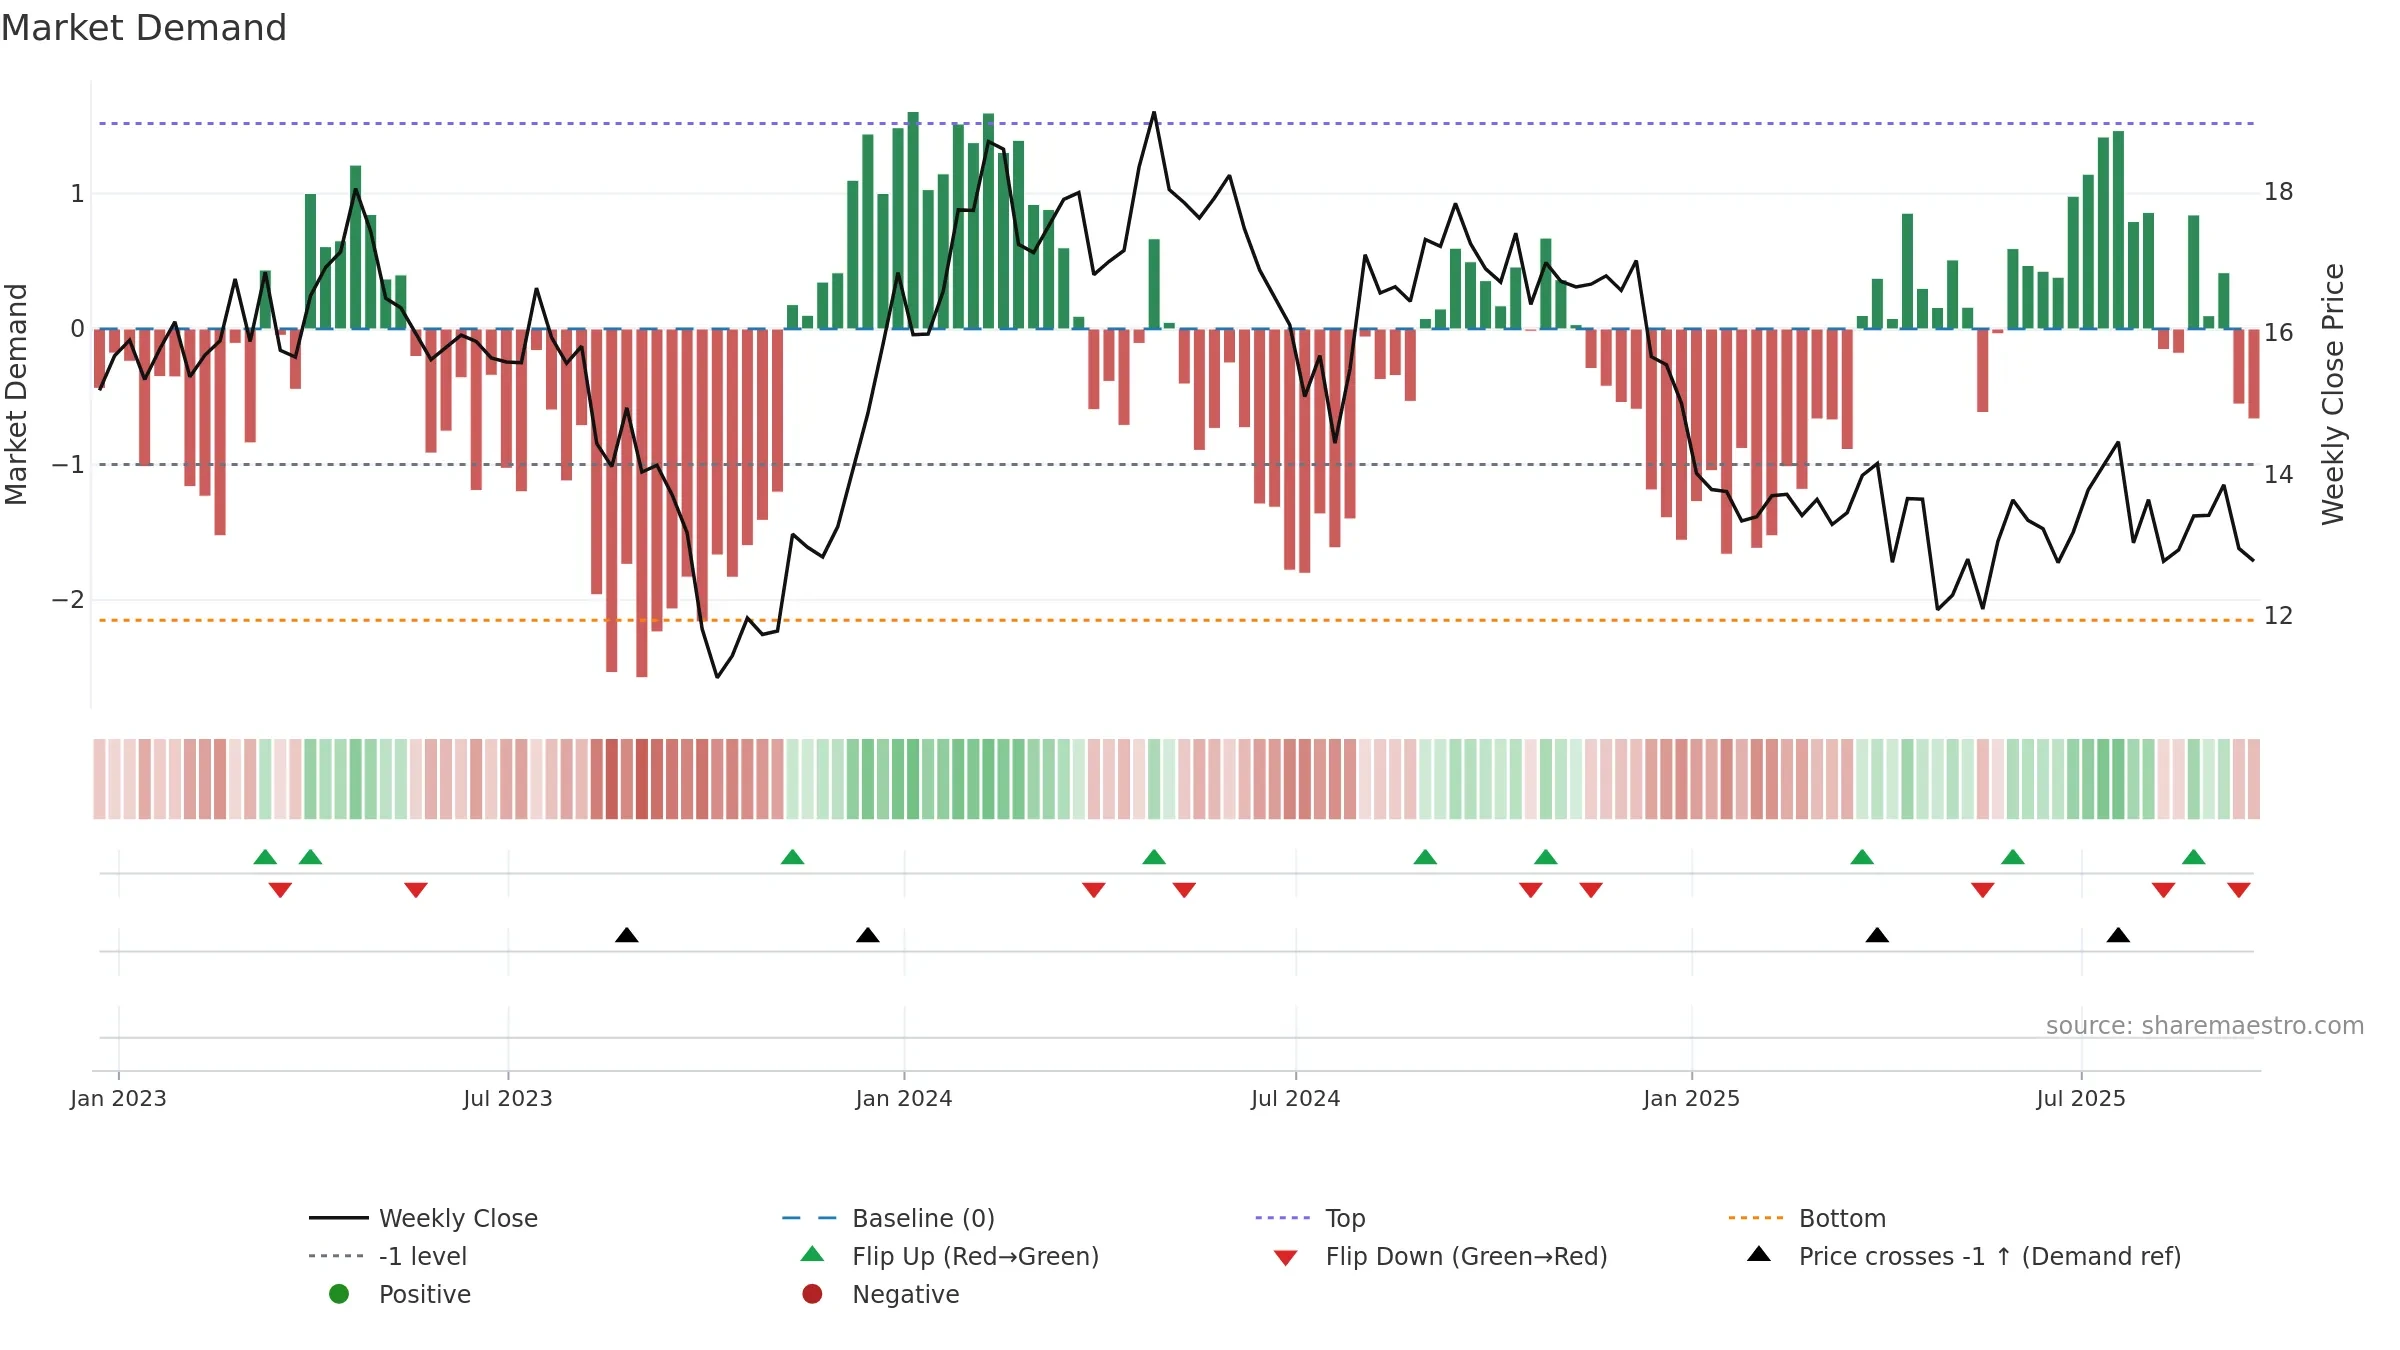
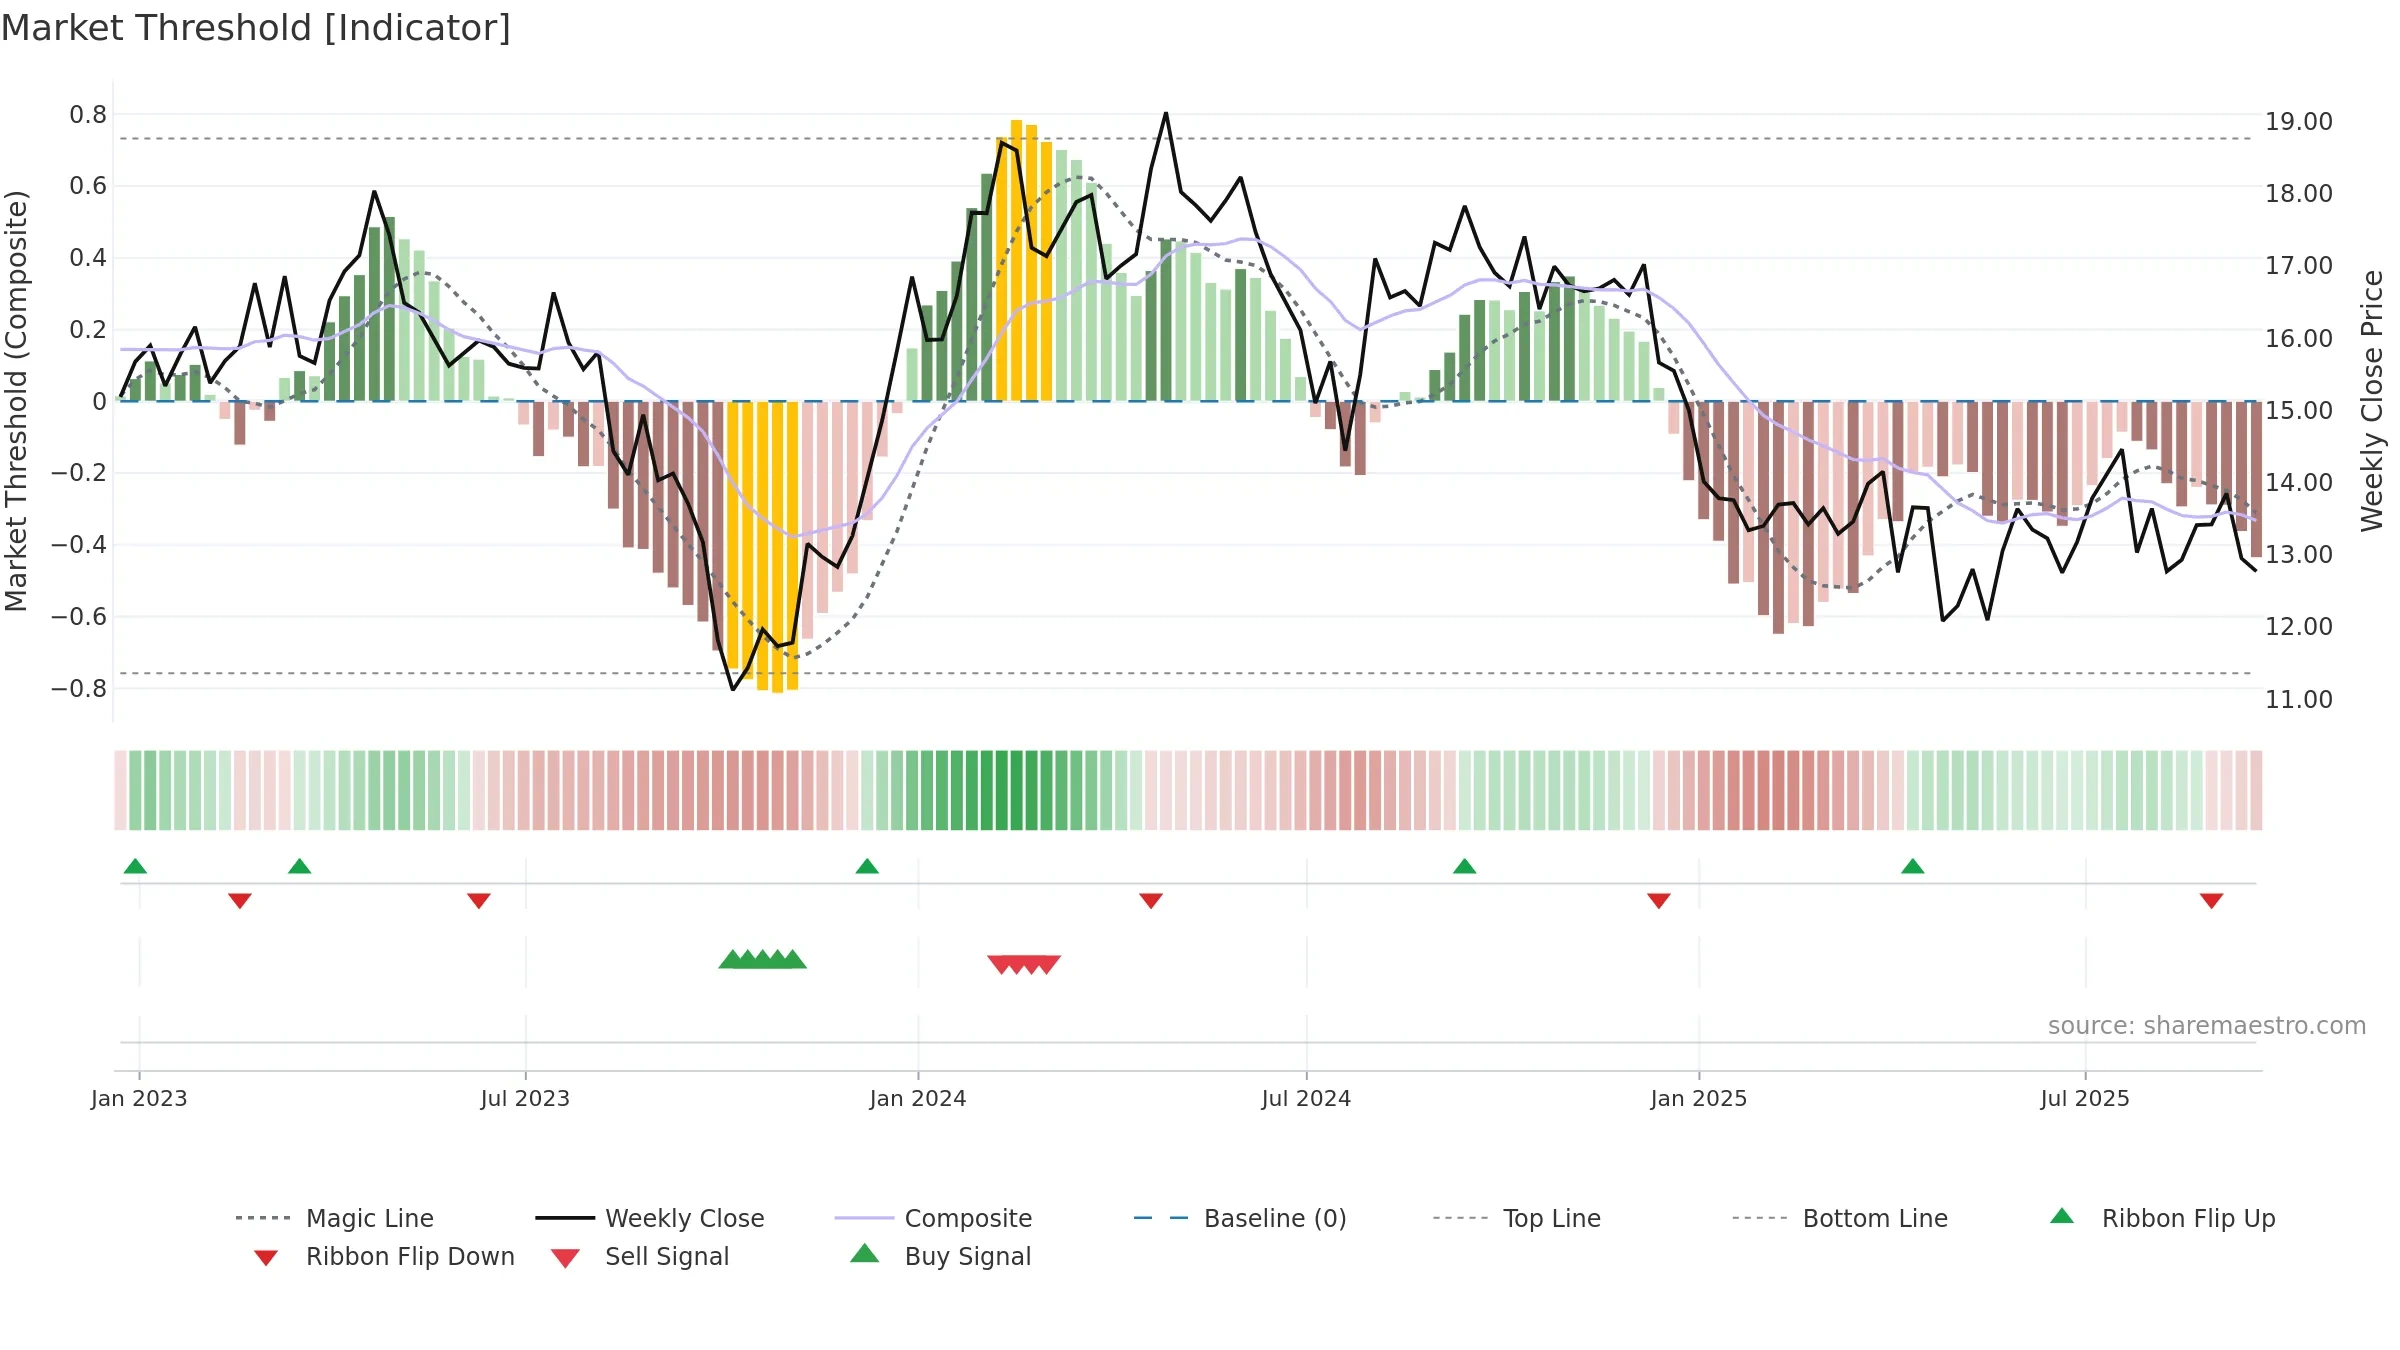
Neutral setup. ★★★☆☆ confidence. Price window: -6. Trend: Range / Neutral; gauge 36. In combination, liquidity confirms the move.
- Liquidity confirms the price trend
- Momentum is weak/falling
- Price is not above key averages
- Negative multi-week performance
- Sub-0.40 print confirms bear control
Why: Price window -6.38% over 8w. Close is -7.80% below the prior-window high. Volume trend falling. Liquidity convergence with price. Trend state range / neutral. Momentum bearish and rising. Valuation supportive skew.
Tip: Most metrics include a hover tooltip where they appear in the report.