The Sage Group plc
SGE LSE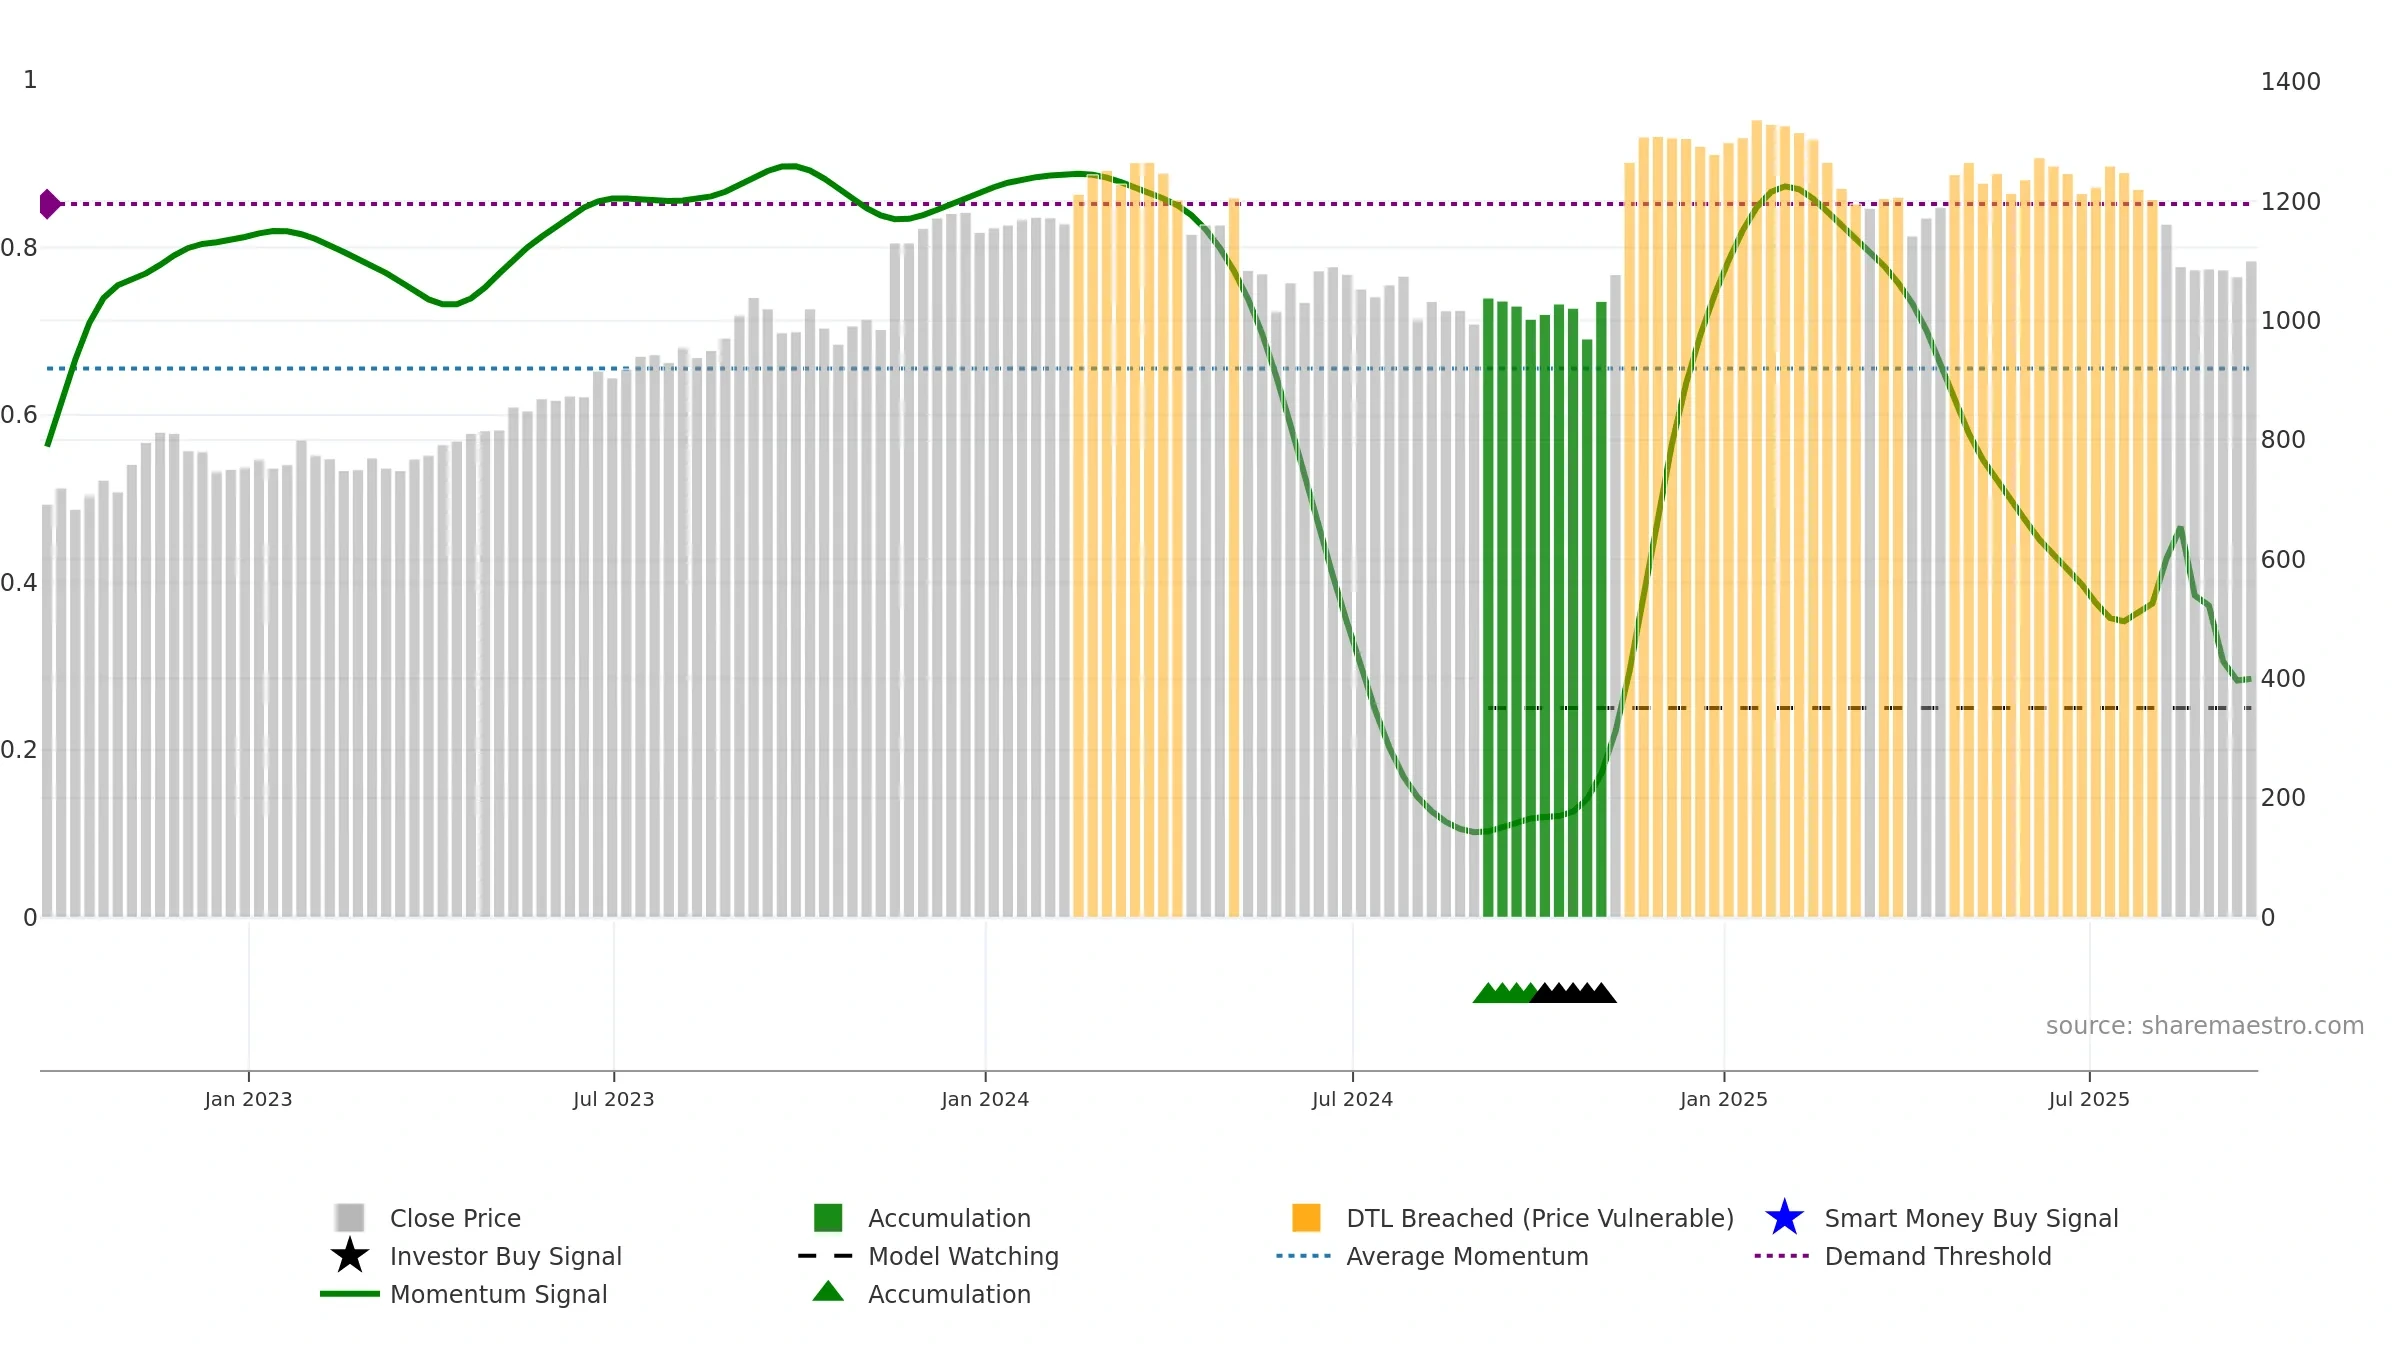
Weekly Summary
The Sage Group plc closed at 1100.0000 (0.14% WoW) . Data window ends Fri, 19 Sep 2025.
How to read this — Price slope is downward, indicating persistent supply pressure. Low weekly volatility favours steadier follow-through. Volume and price are moving in the same direction — a constructive confirmation. Distance to baseline is narrowing — reverting closer to its fair-value track. Weak MA stack argues for caution; rallies can fail near the 8–13 week region. Price sits below key averages, keeping pressure on the tape.
Down-slope argues for patience; rallies can fade sooner unless participation improves.
Gauge maps the trend signal to a 0–100 scale.
How to read this — Bearish zone with falling momentum — sellers in control.
Bias remains lower; rallies are suspect unless gauge reclaims 0.50/0.60.

Relative strength is Negative
(< 0%, underperforming).
Latest MRS: -12.84% (week ending Fri, 19 Sep 2025).
Slope: Falling over 8w.
Notes:
- Below zero line indicates relative weakness vs benchmark.
- MRS slope falling over ~8 weeks.
Price is above fair value; upside may be capped without catalysts.
Conclusion
Negative setup. ★☆☆☆☆ confidence. Trend: Downtrend Confirmed · -8.56% over window · vol 1.11% · liquidity convergence · posture below · RS weak
- Liquidity confirms the price trend
- Low return volatility supports durability
- Bearish control with falling momentum
- Momentum is weak/falling
- Price is not above key averages
- Weak moving-average stack
Why: Price window -8.56% over w. Close is -8.56% below the prior-window high. Return volatility 1.11%. Volume trend falling. Liquidity convergence with price. Trend state downtrend confirmed. MA stack weak. Momentum bearish and falling. Valuation limited upside without catalysts.
Tip: Most metrics include a hover tooltip where they appear in the report.