None
ASCOM NSE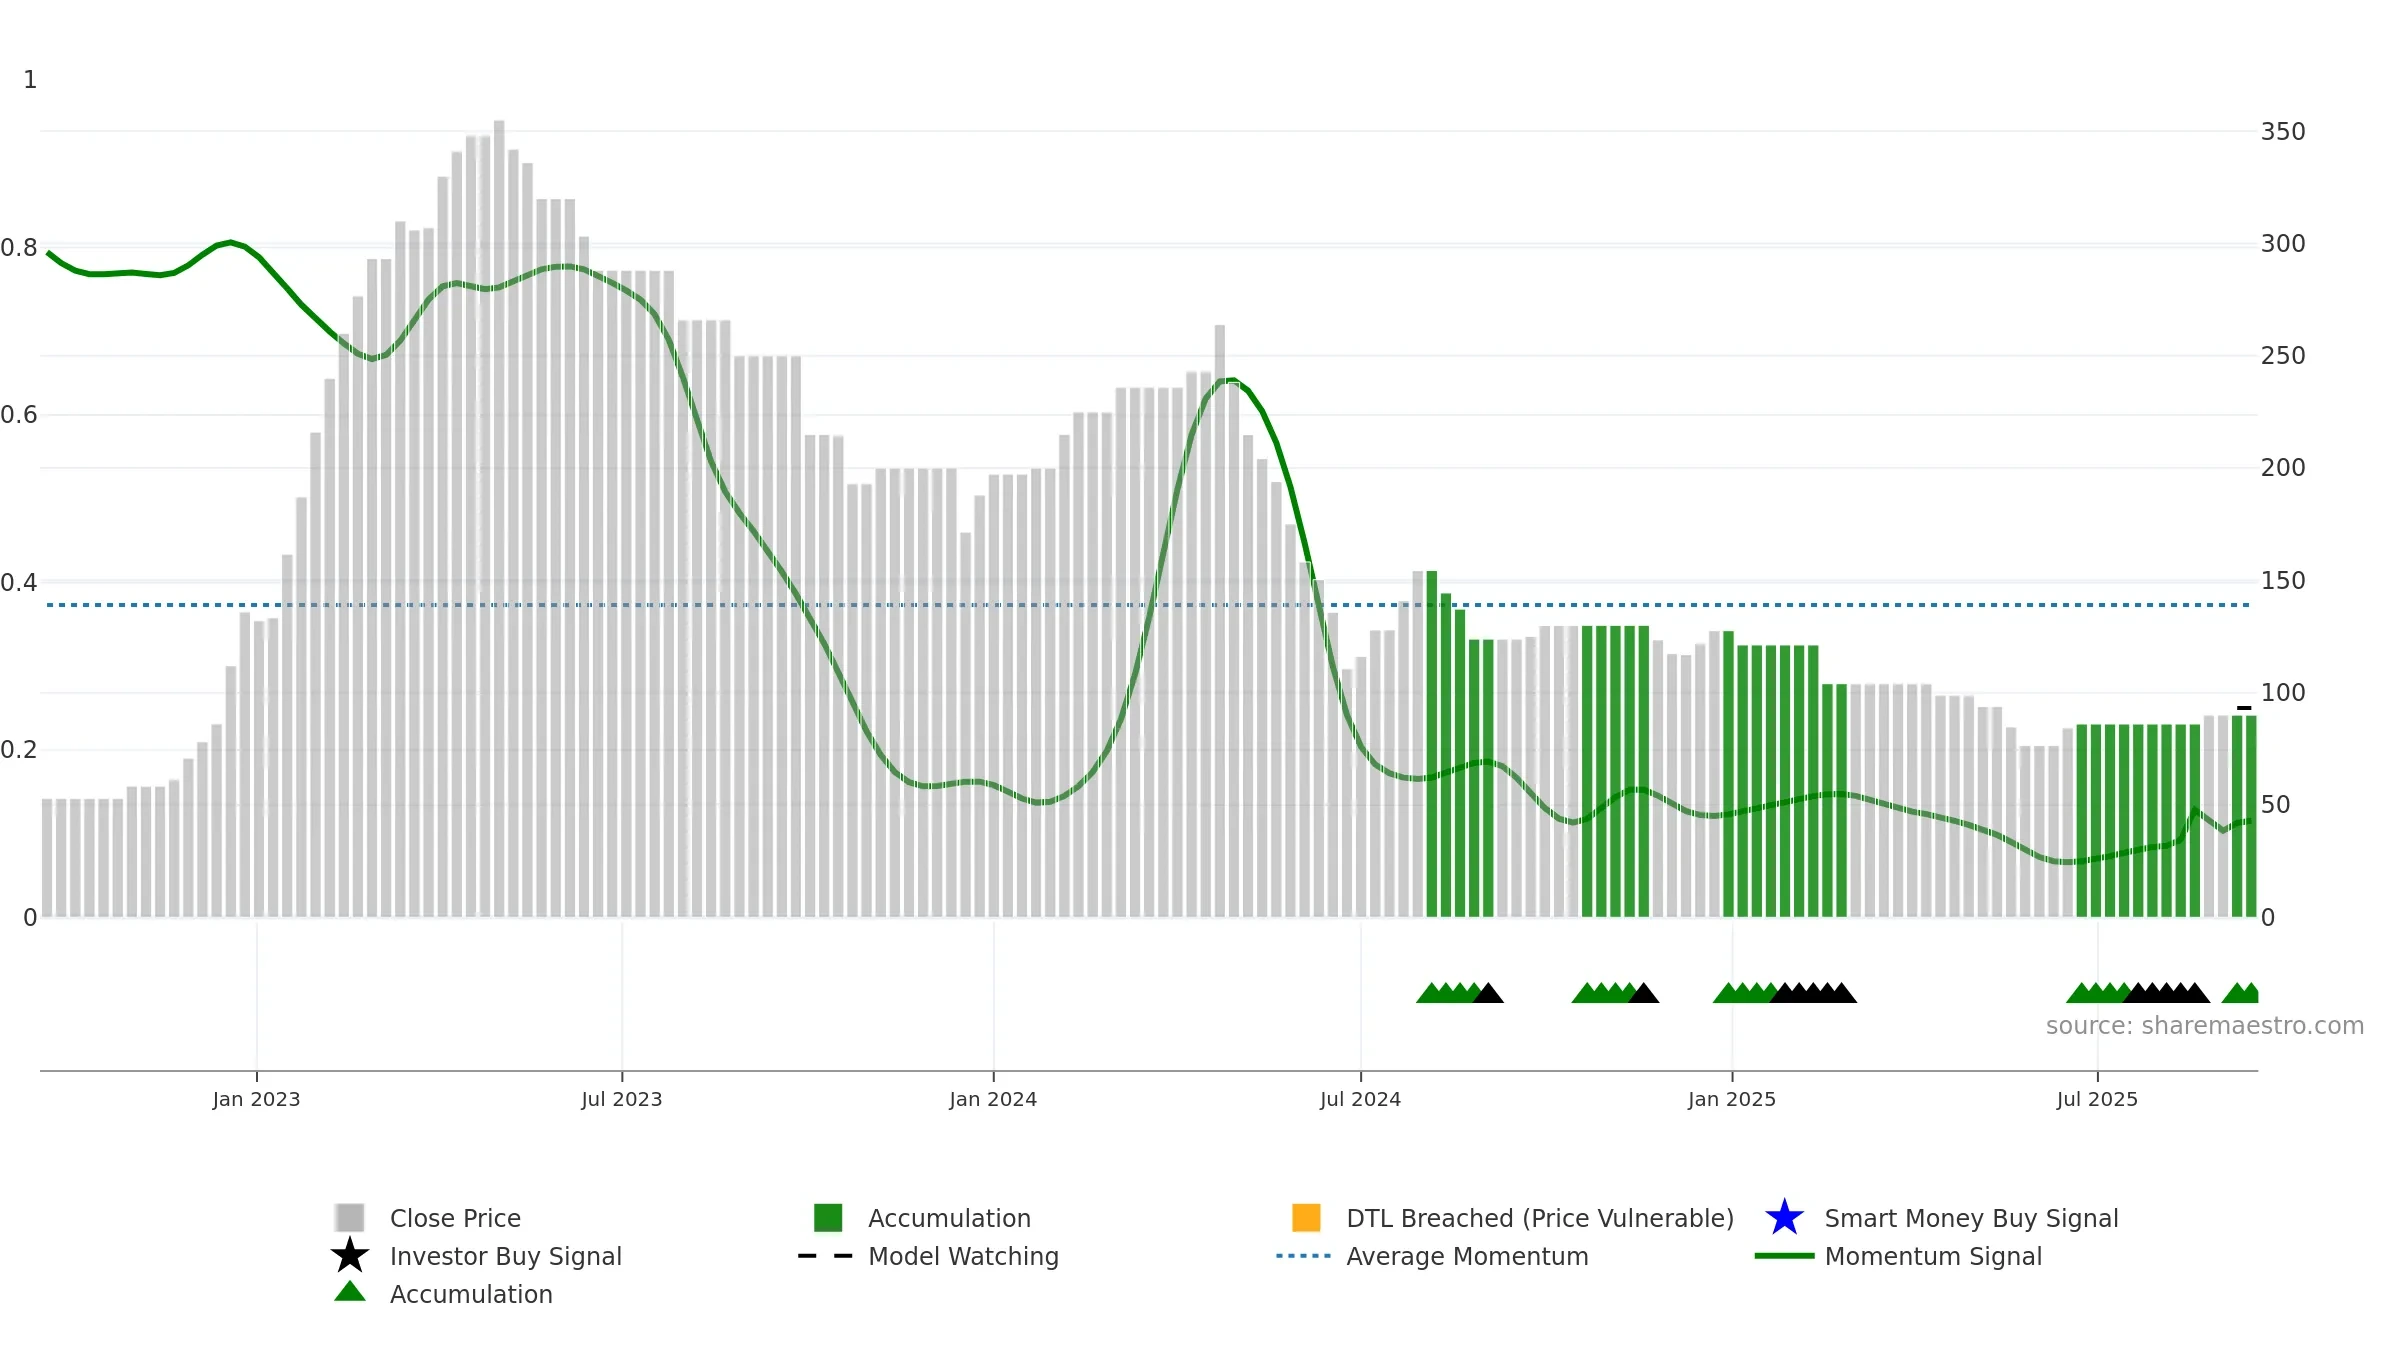
Weekly Report
None closed at 90.0000 (0.00% WoW) . Data window ends Mon, 15 Sep 2025.
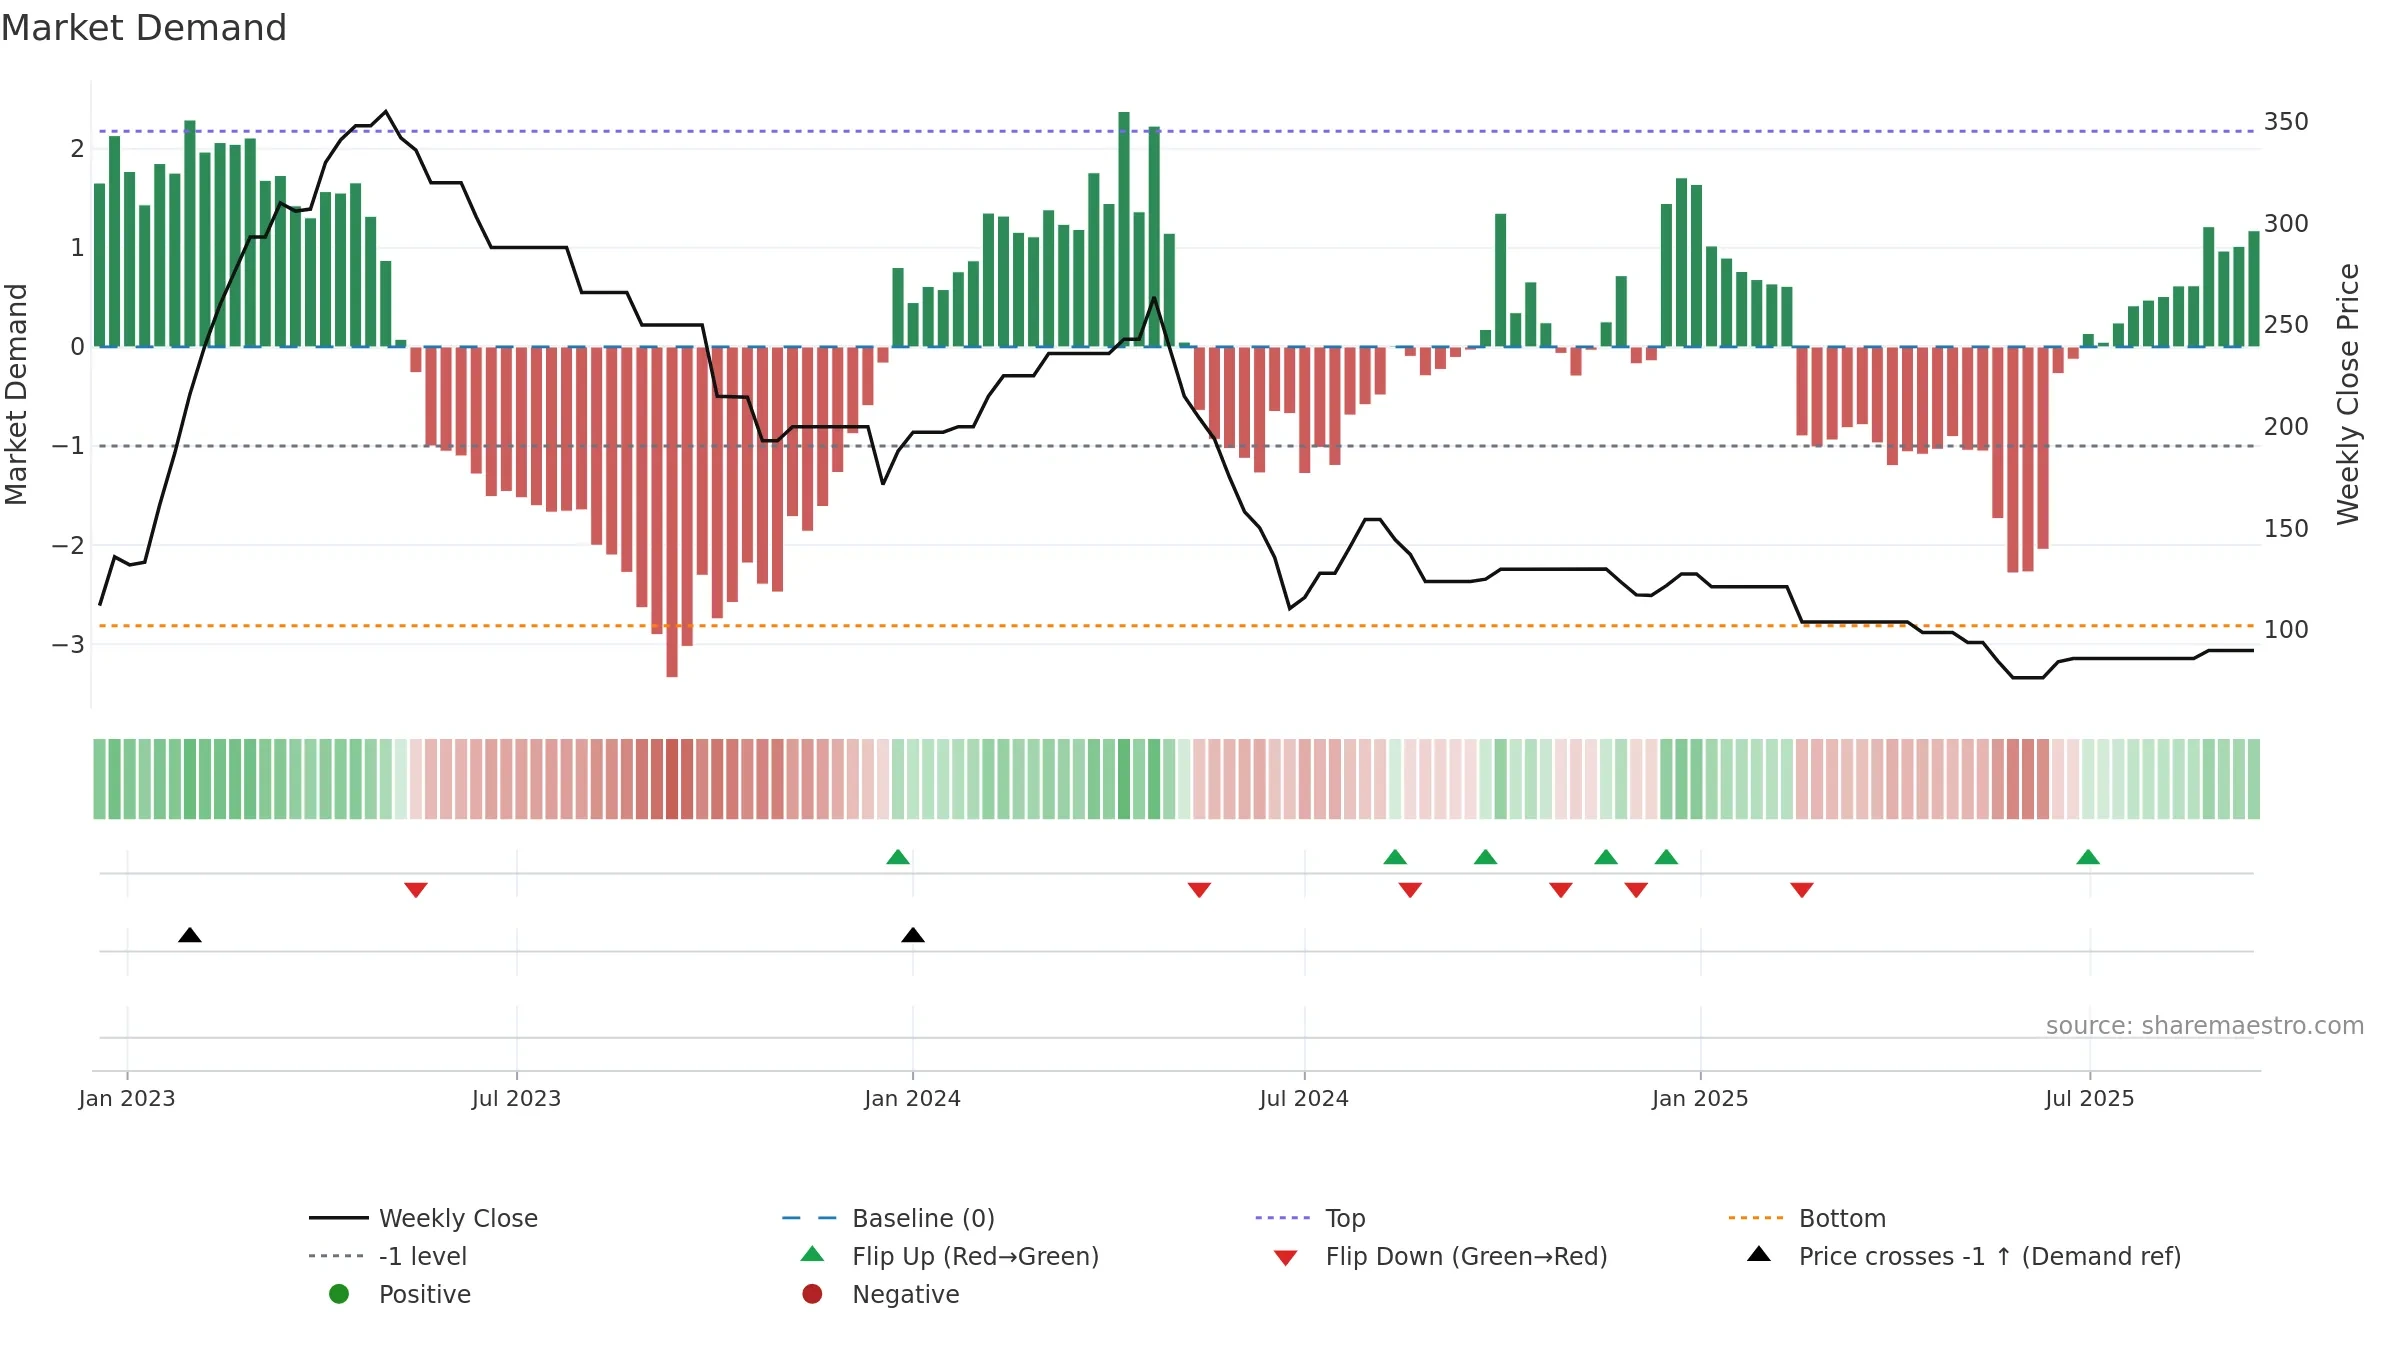
How to read this — Price slope is upward, indicating persistent buying over the window. Low weekly volatility favours steadier follow-through. Volume or price is flat; confirmation from liquidity is limited. Distance to baseline is narrowing — reverting closer to its fair-value track. Price holds above key averages, indicating constructive participation.
Up-slope supports buying interest; pullbacks may be contained if activity stays firm.
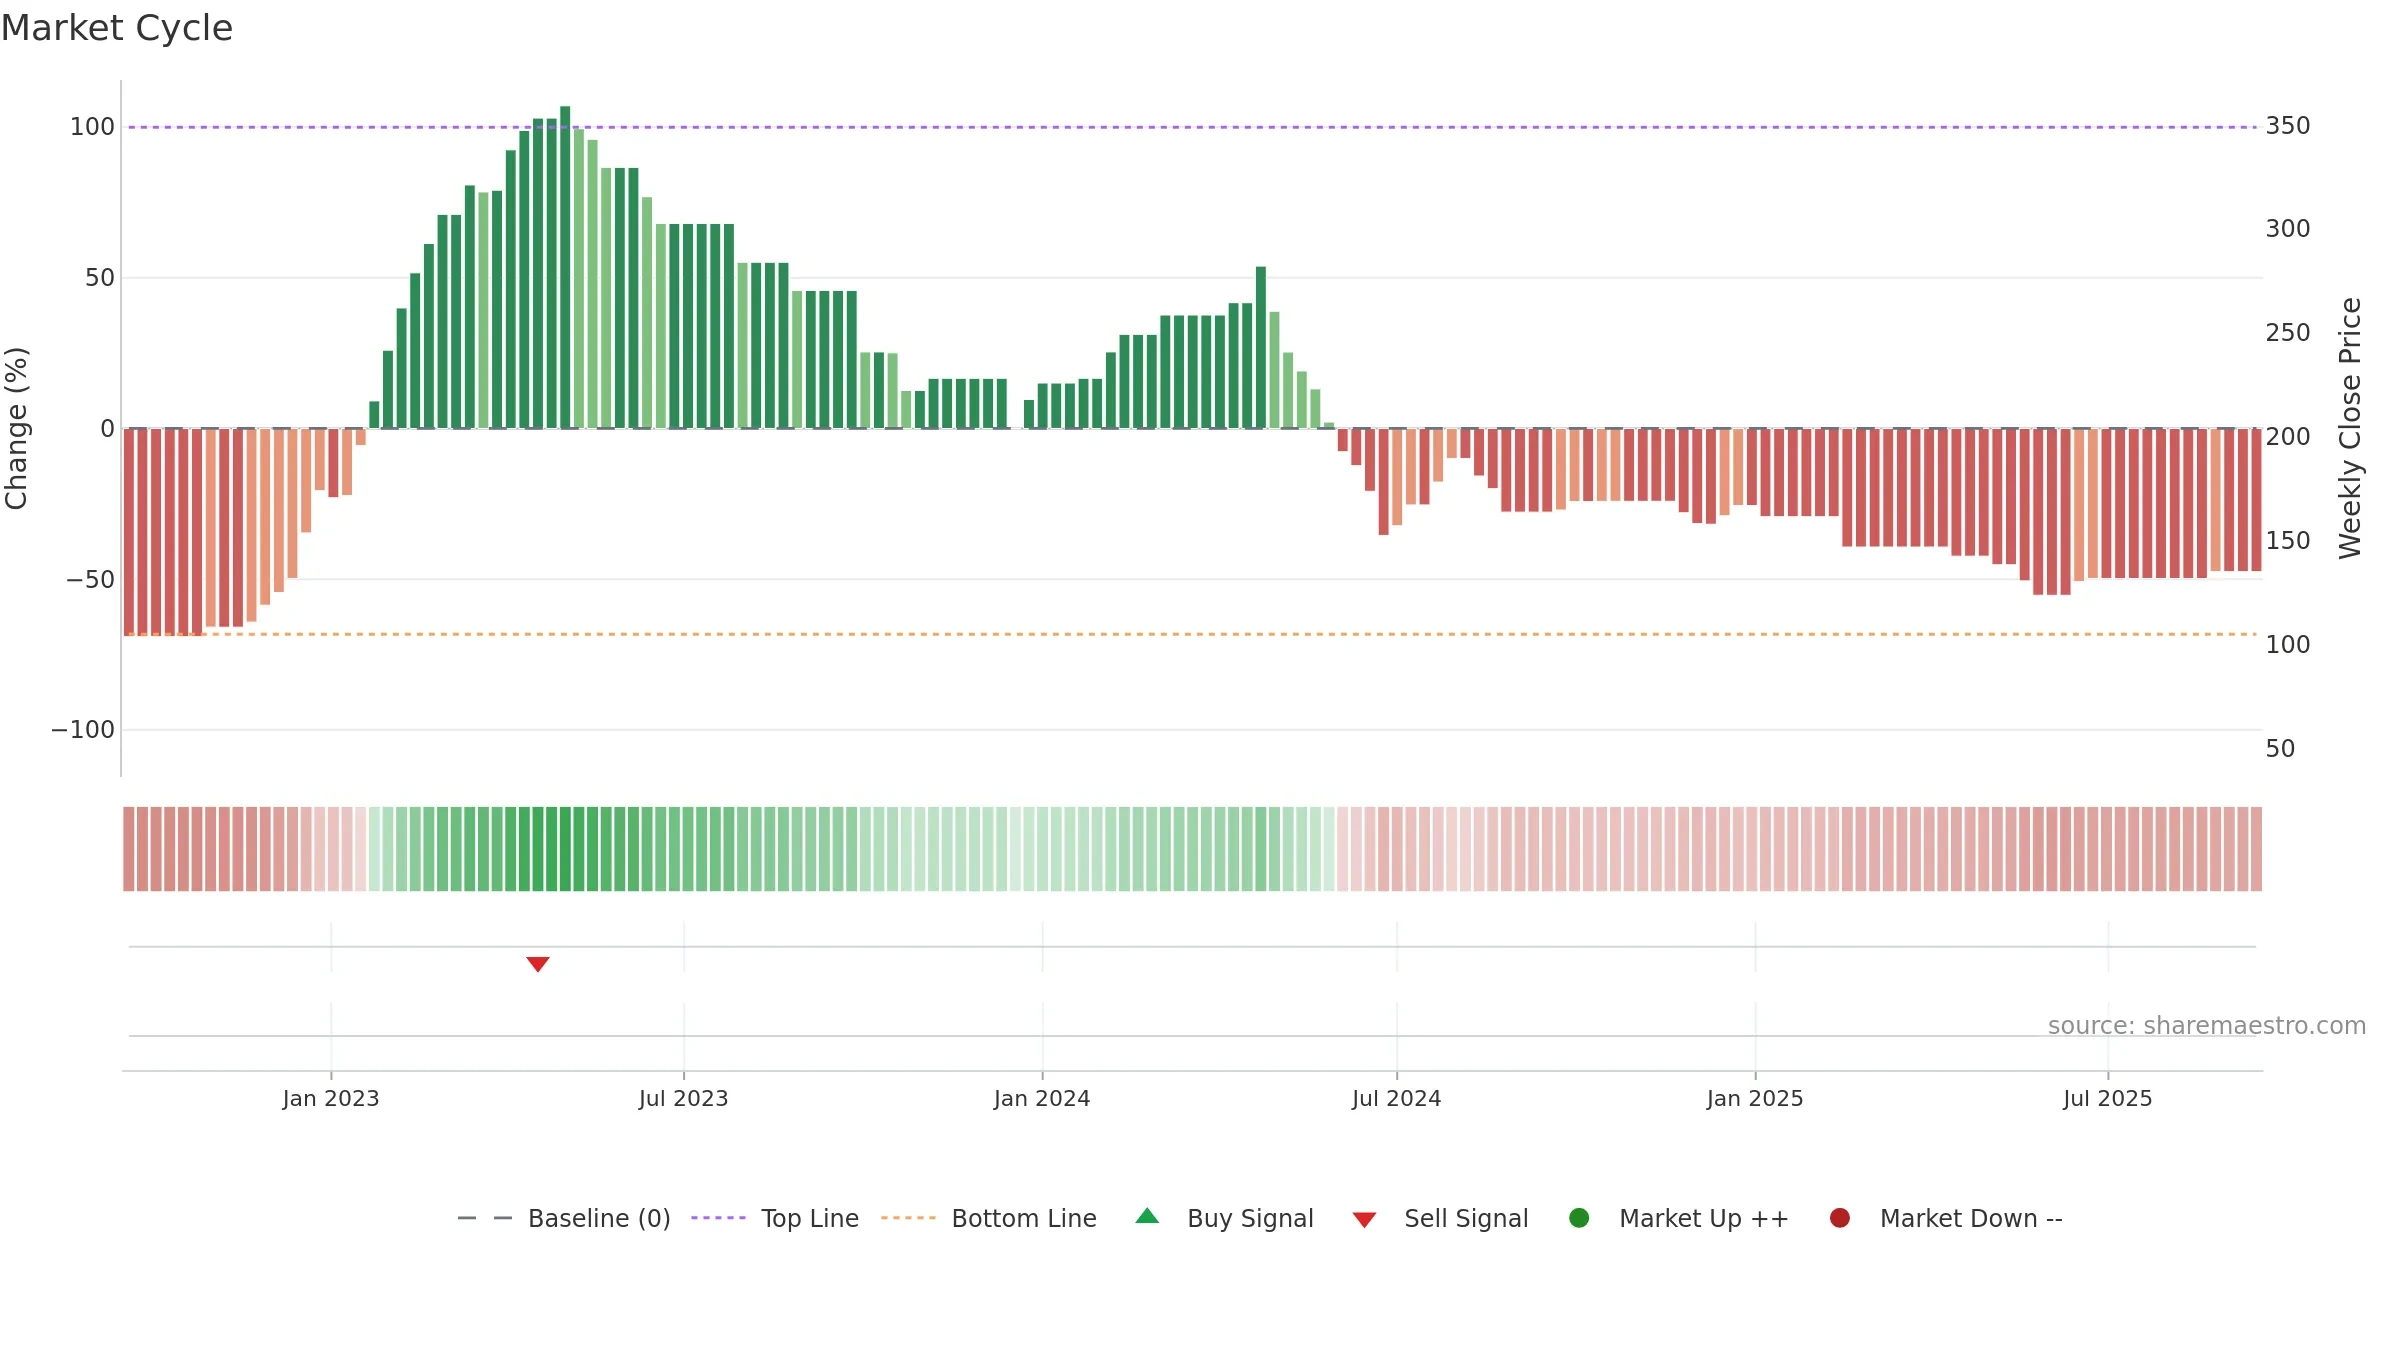
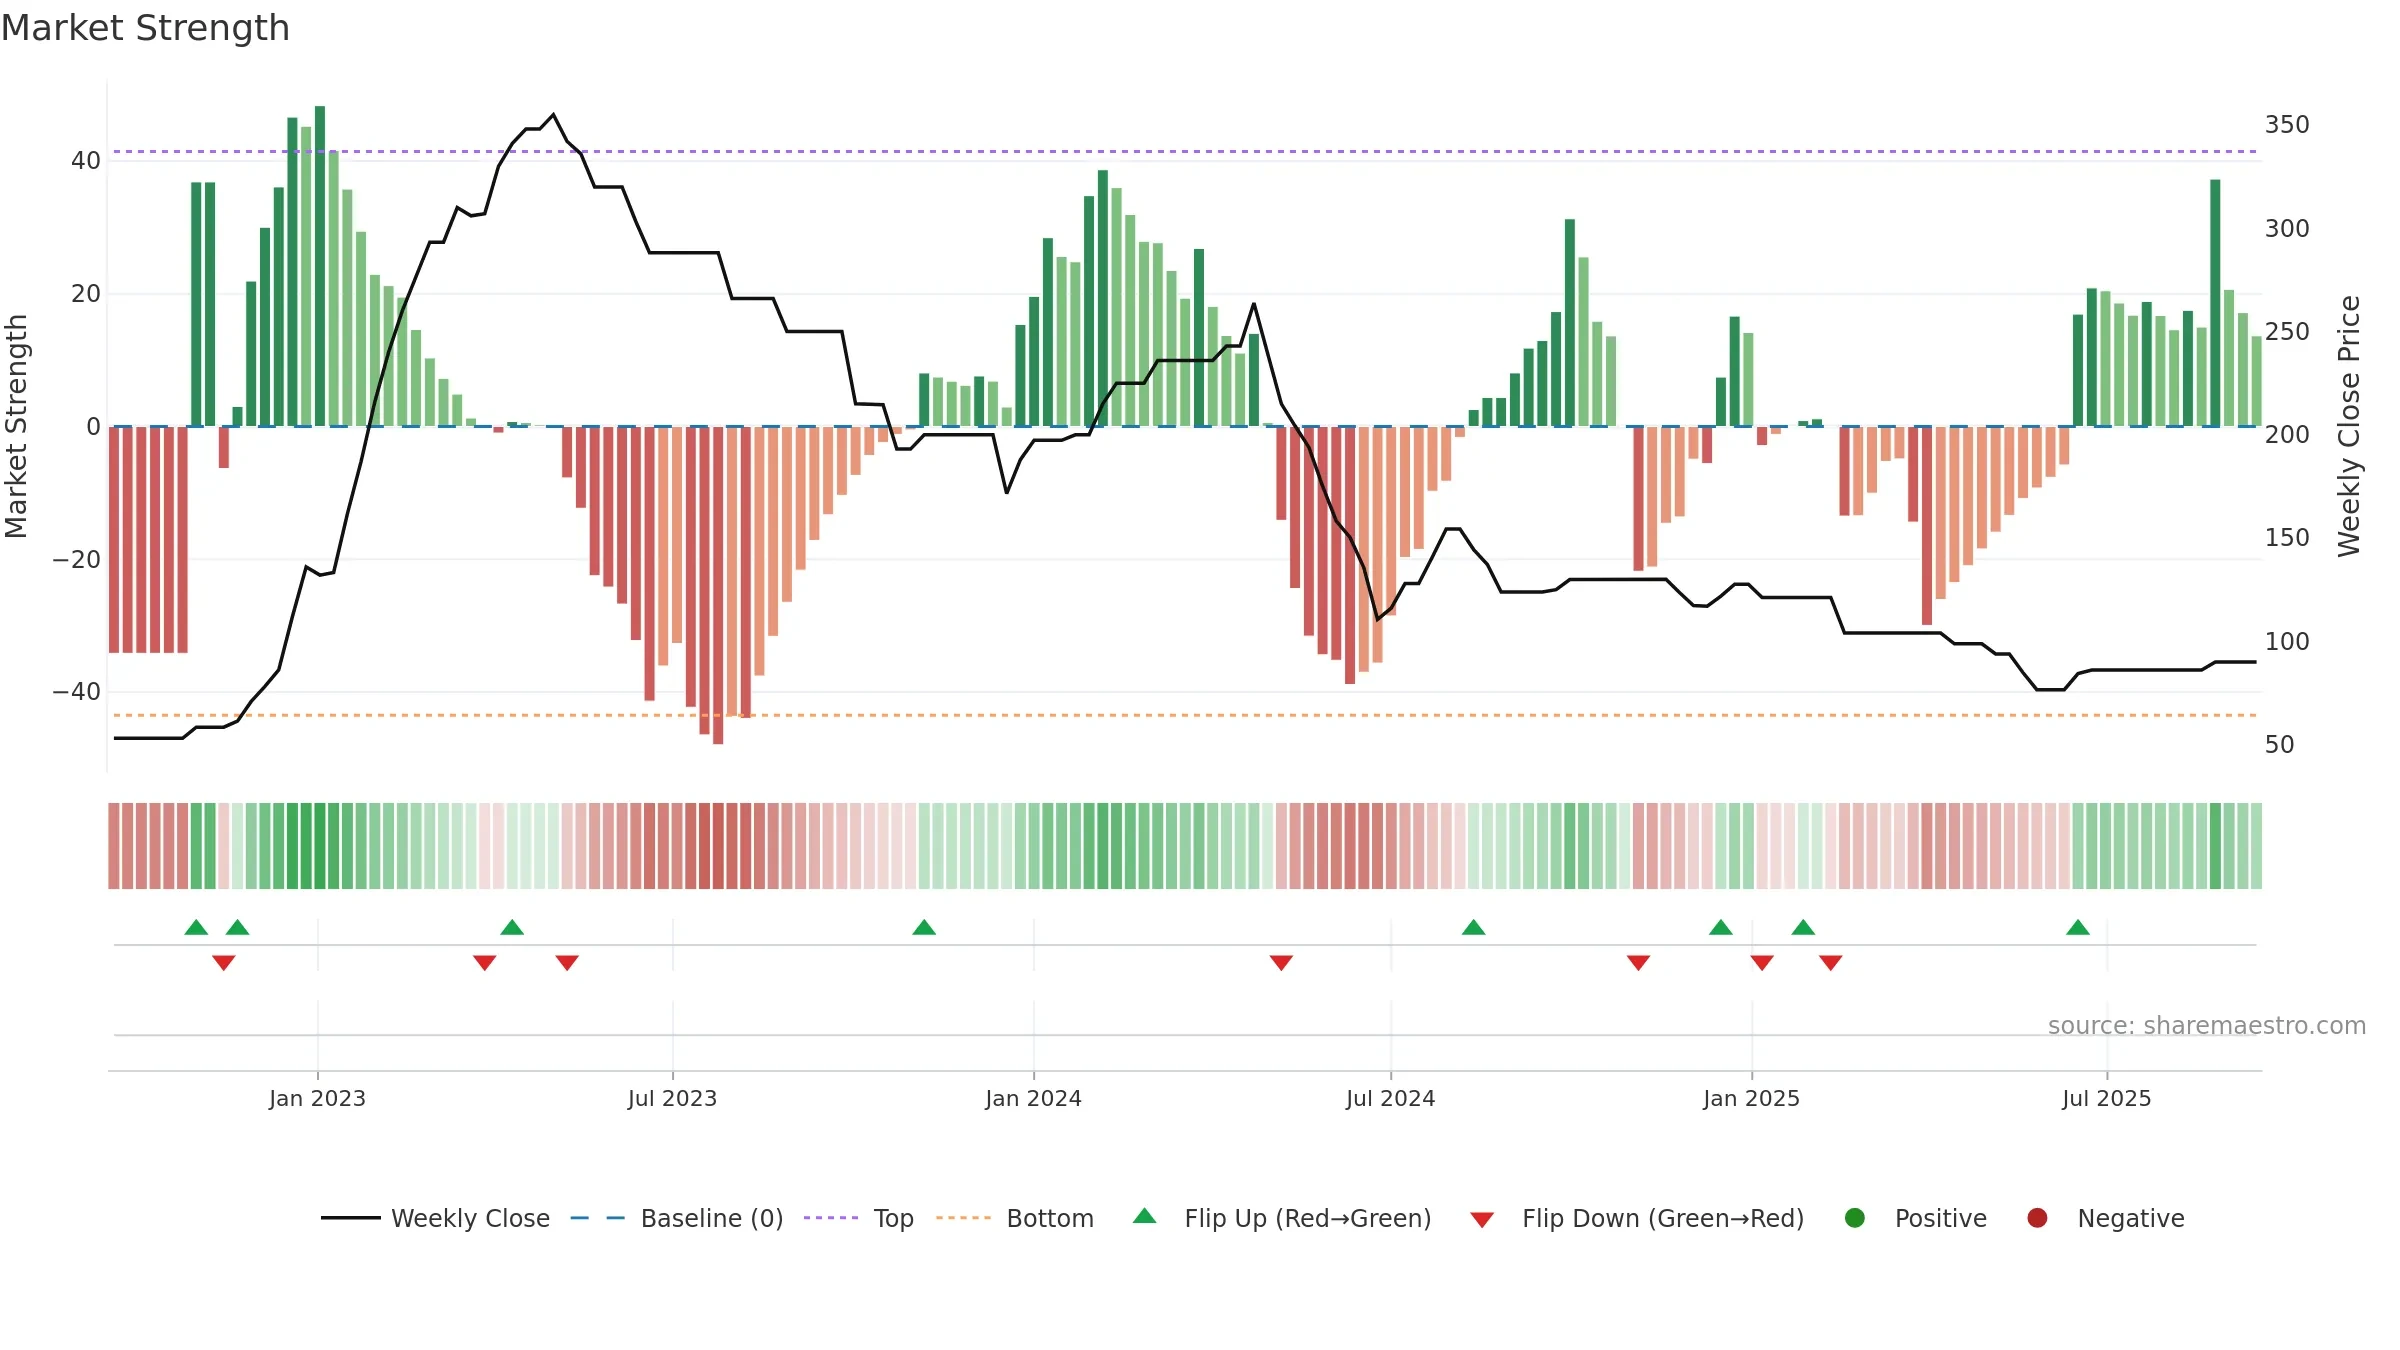
Gauge maps the trend signal to a 0–100 scale.
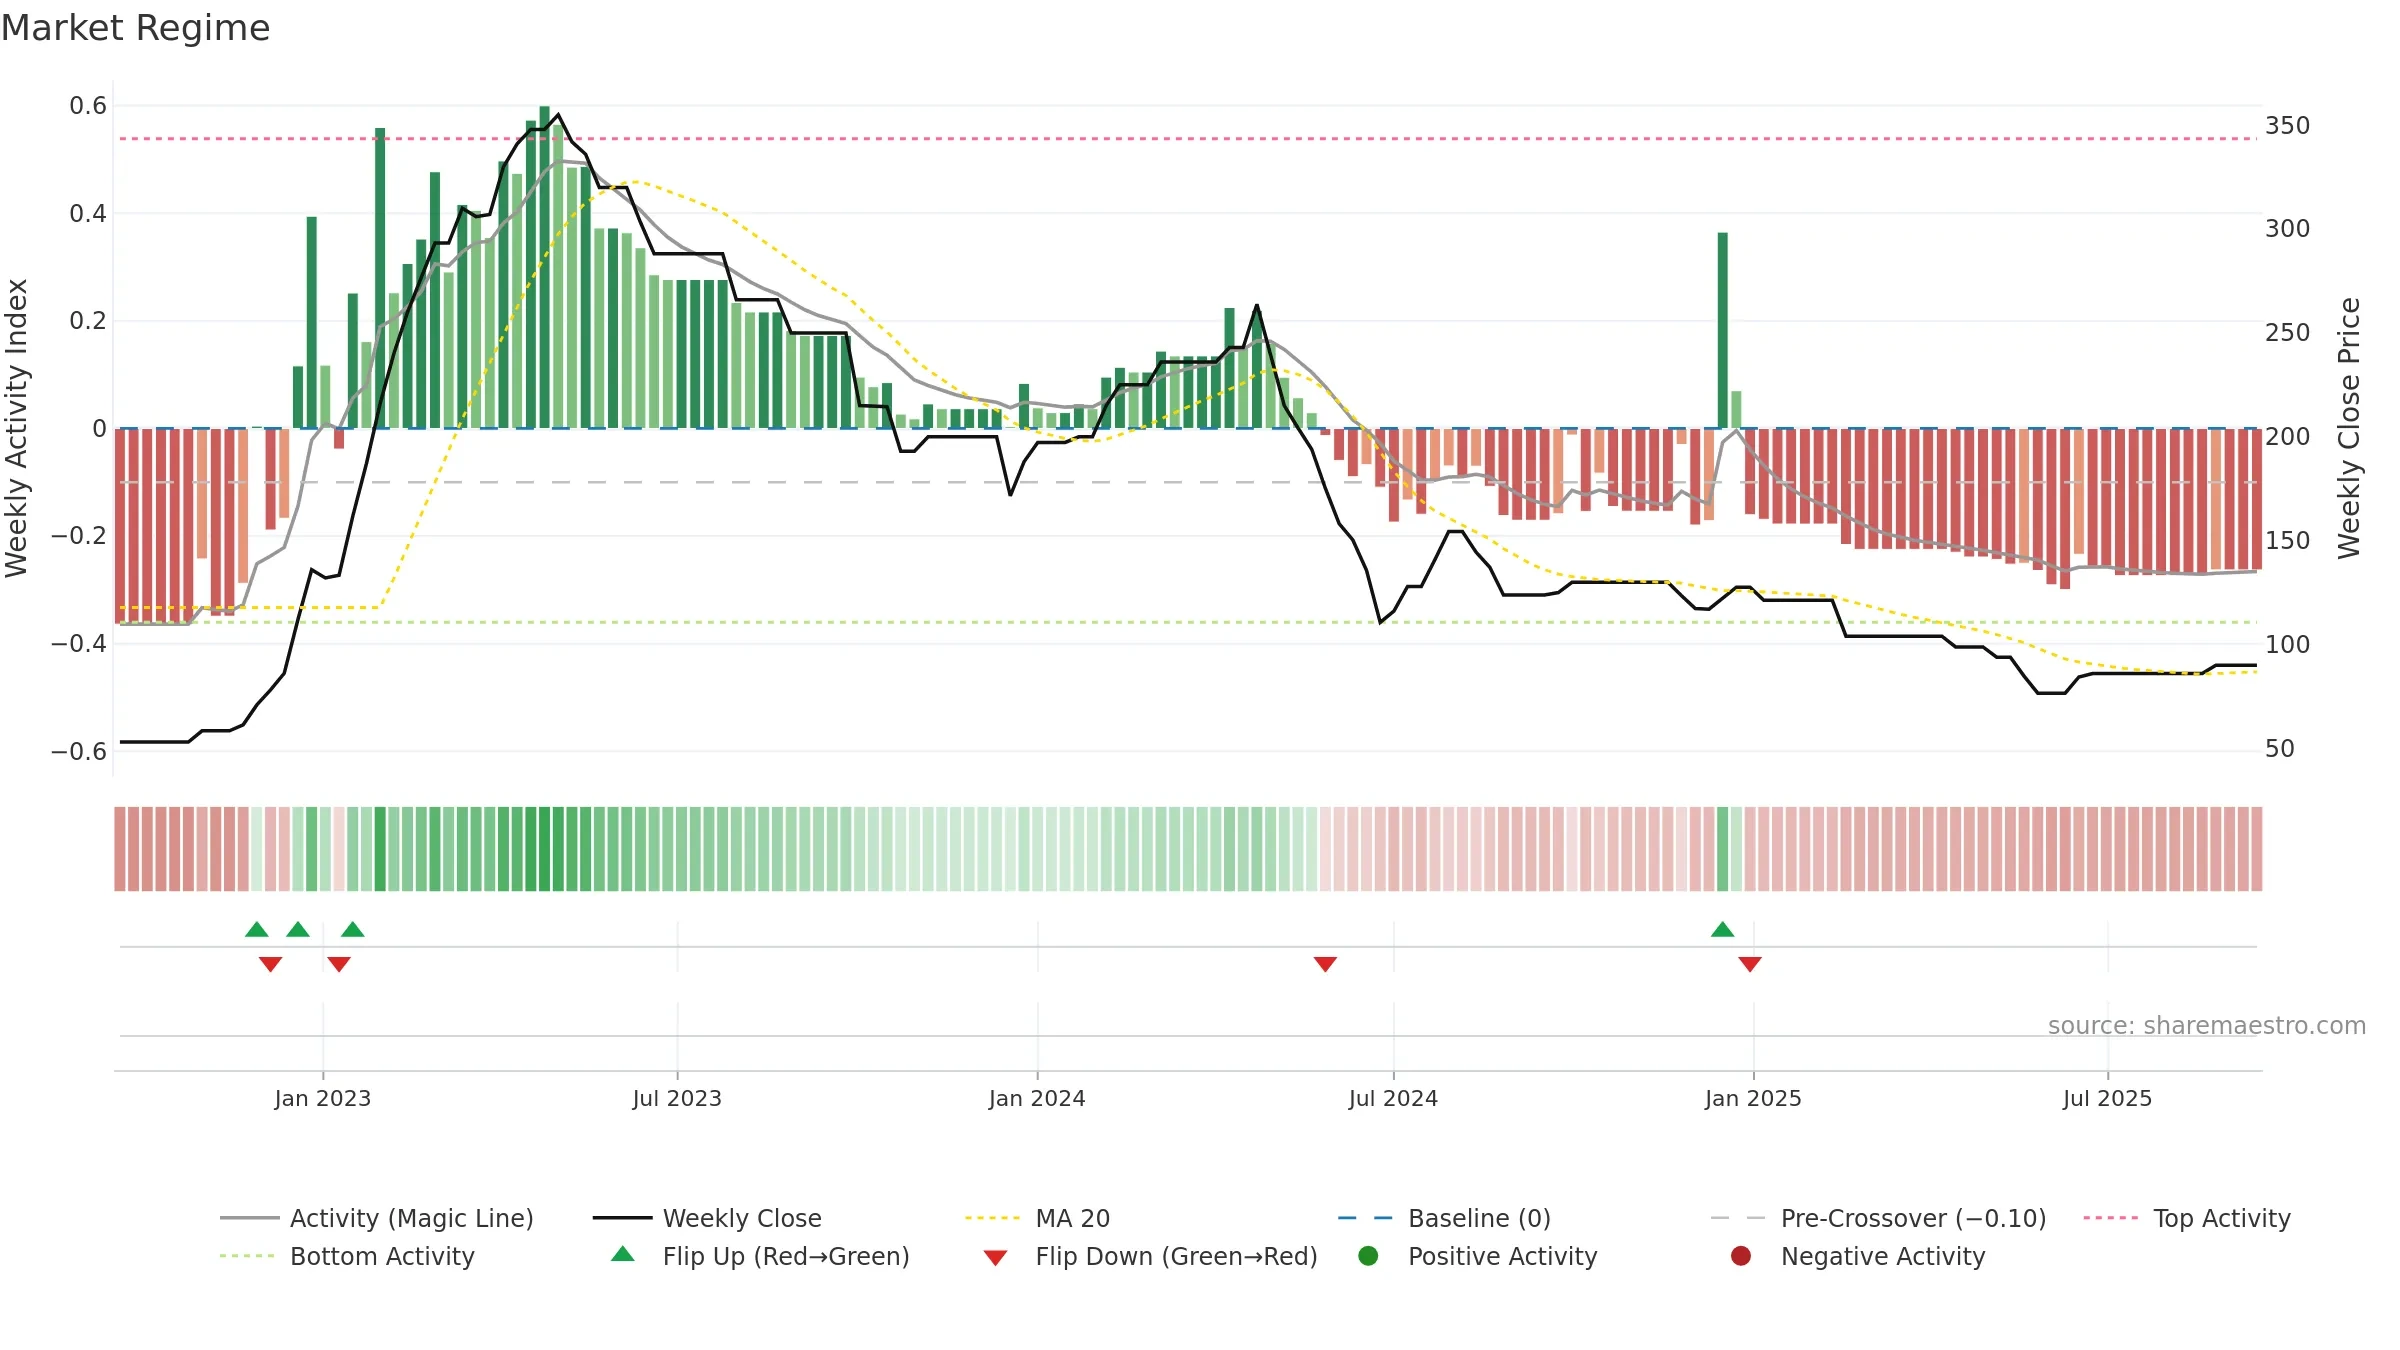
How to read this — Range-bound conditions; conviction is limited until a break or acceleration emerges.
Wait for a directional break or improving acceleration.
Conclusion
Positive setup. ★★★★★ confidence. Price window: 4. Trend: Range / Neutral; gauge 11. In combination, liquidity confirmation is mixed.
- Price holds above 8w & 26w averages
- Low return volatility supports durability
- Buyers step in at depressed levels (accumulation)
Why: Price window 4.59% over 8w. Return volatility 0.00%. Liquidity flat with price. Trend state range / neutral. Low-regime (≤0.25) upticks 5/7 (71.0%) • Accumulating. Momentum neutral and rising.
Tip: Most metrics include a hover tooltip where they appear in the report.