DexCom, Inc.
DXCM NASDAQ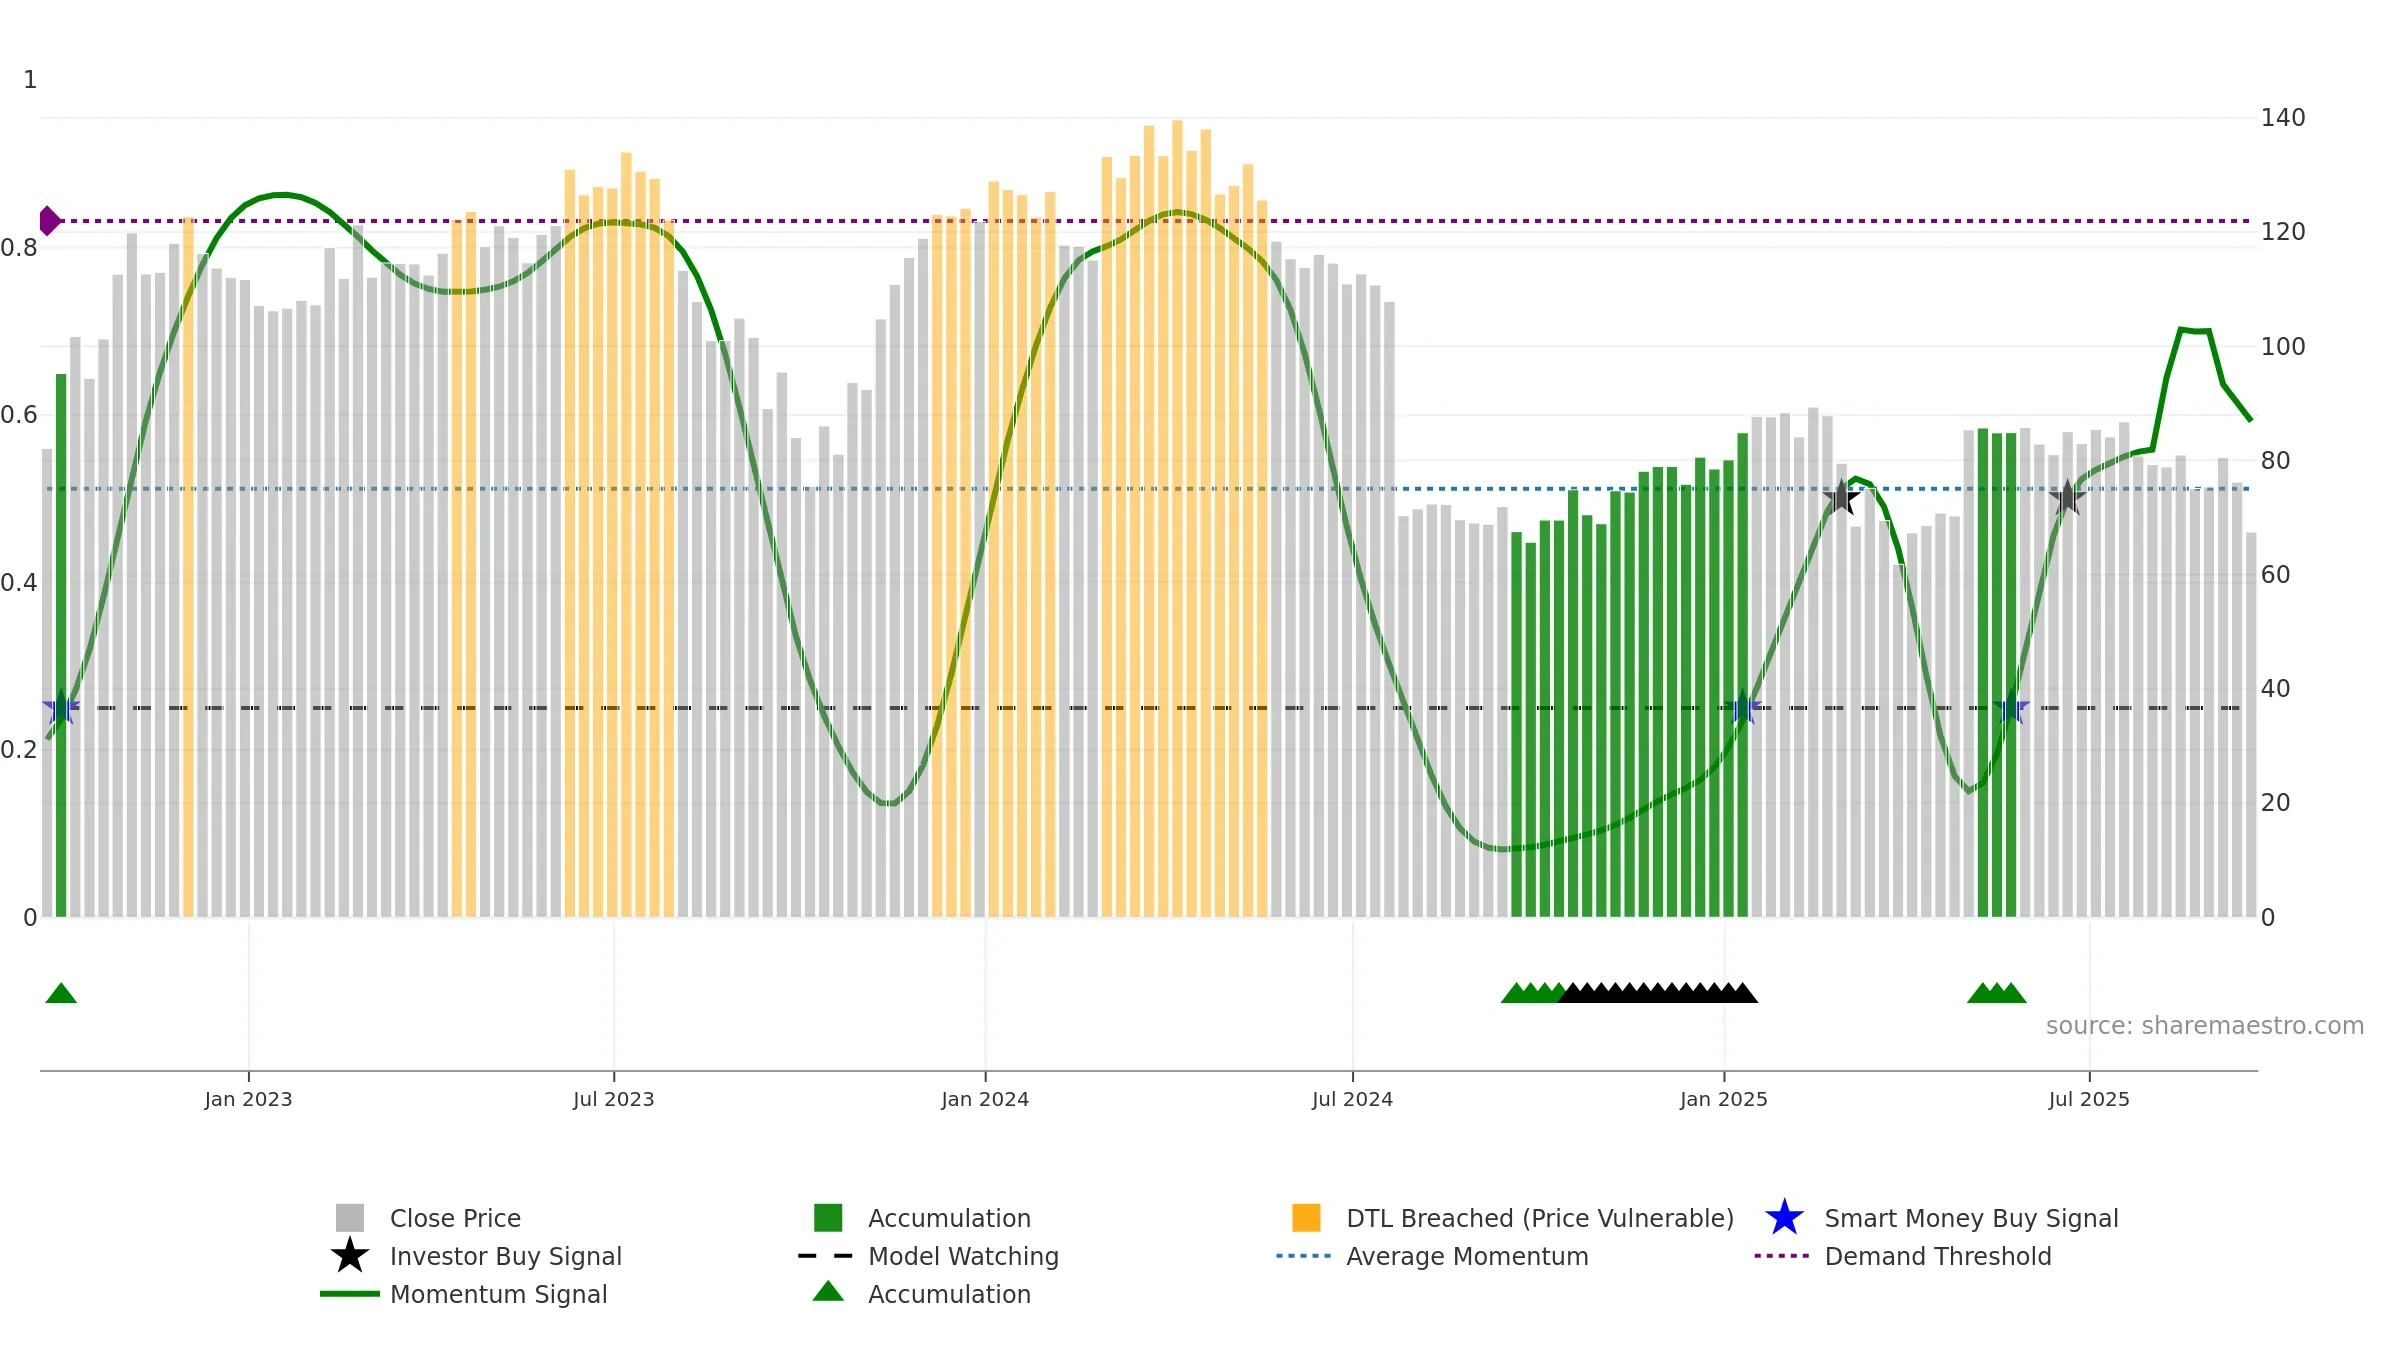
Weekly Report
DexCom, Inc. closed at 67.4500 (-10.07% WoW) . Data window ends Fri, 19 Sep 2025.
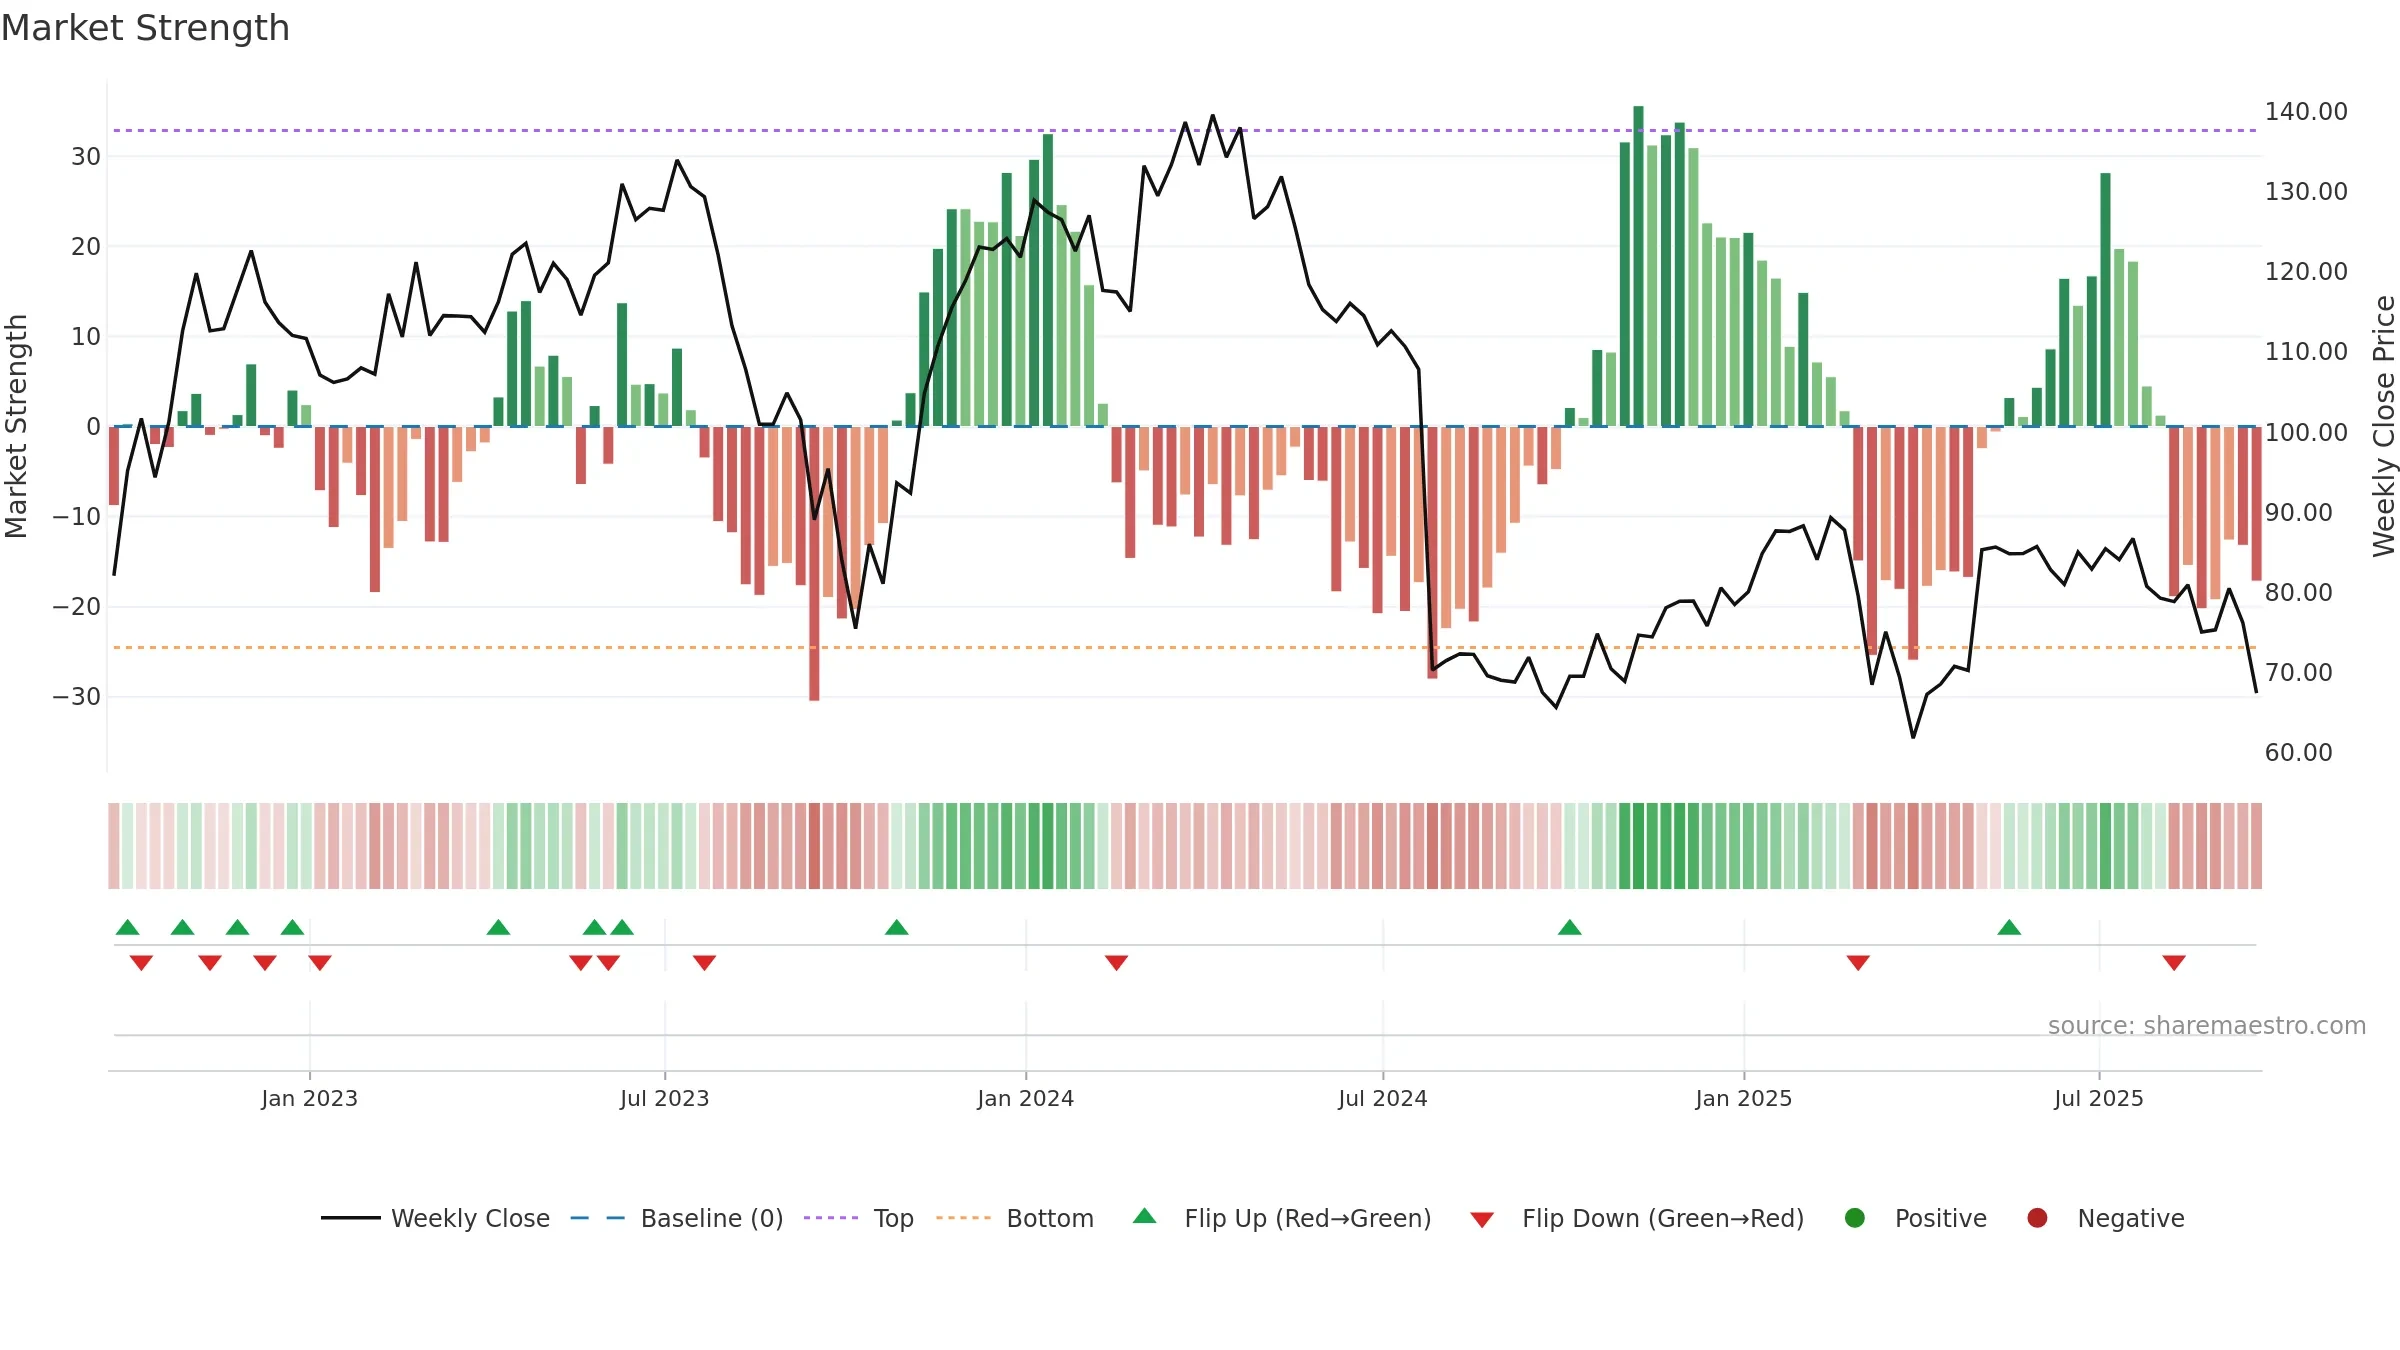
How to read this — Price slope is downward, indicating persistent supply pressure. Elevated weekly volatility increases whipsaw risk. Volume trend diverges from price — watch for fatigue or rotation. Returns are negatively correlated with volume — strength may come on lighter activity. Price is extended below its baseline; rebounds can be sharp if demand improves. Distance to baseline is narrowing — reverting closer to its fair-value track. Price sits below key averages, keeping pressure on the tape.
Down-slope argues for patience; rallies can fade sooner unless participation improves. Because liquidity isn’t confirming, prefer evidence of fresh demand before chasing moves.
Gauge maps the trend signal to a 0–100 scale.
How to read this — Range-bound conditions; conviction is limited until a break or acceleration emerges.
Wait for a directional break or improving acceleration.
Conclusion
Negative setup. ★★☆☆☆ confidence. Price window: -14. Trend: Range / Neutral; gauge 59. In combination, liquidity diverges from price.
- Momentum is weak/falling
- Price is not above key averages
- Liquidity diverges from price
- High return volatility raises whipsaw risk
Why: Price window -14.92% over 8w. Close is -16.68% below the prior-window high. Return volatility 4.26%. Volume trend rising. Liquidity divergence with price. Trend state range / neutral. Momentum neutral and falling.
Tip: Most metrics include a hover tooltip where they appear in the report.