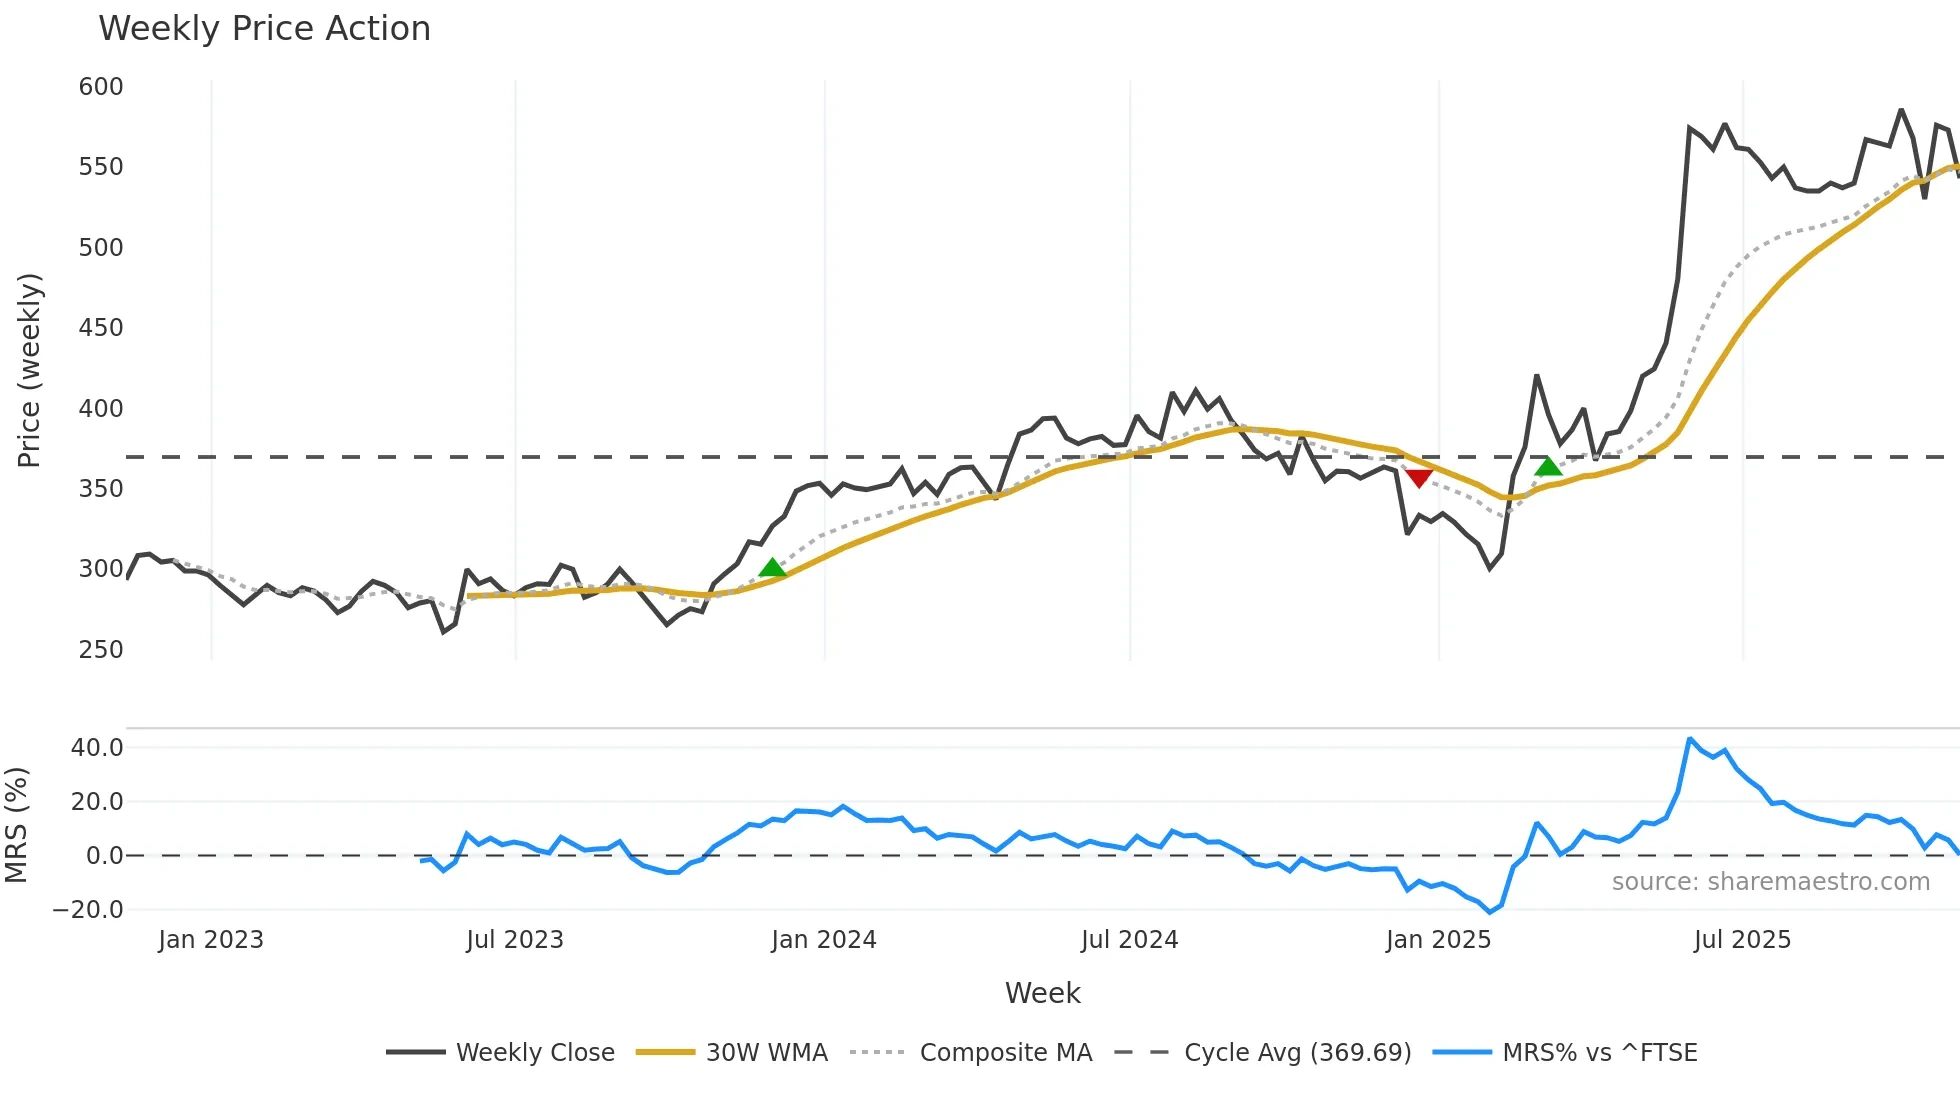
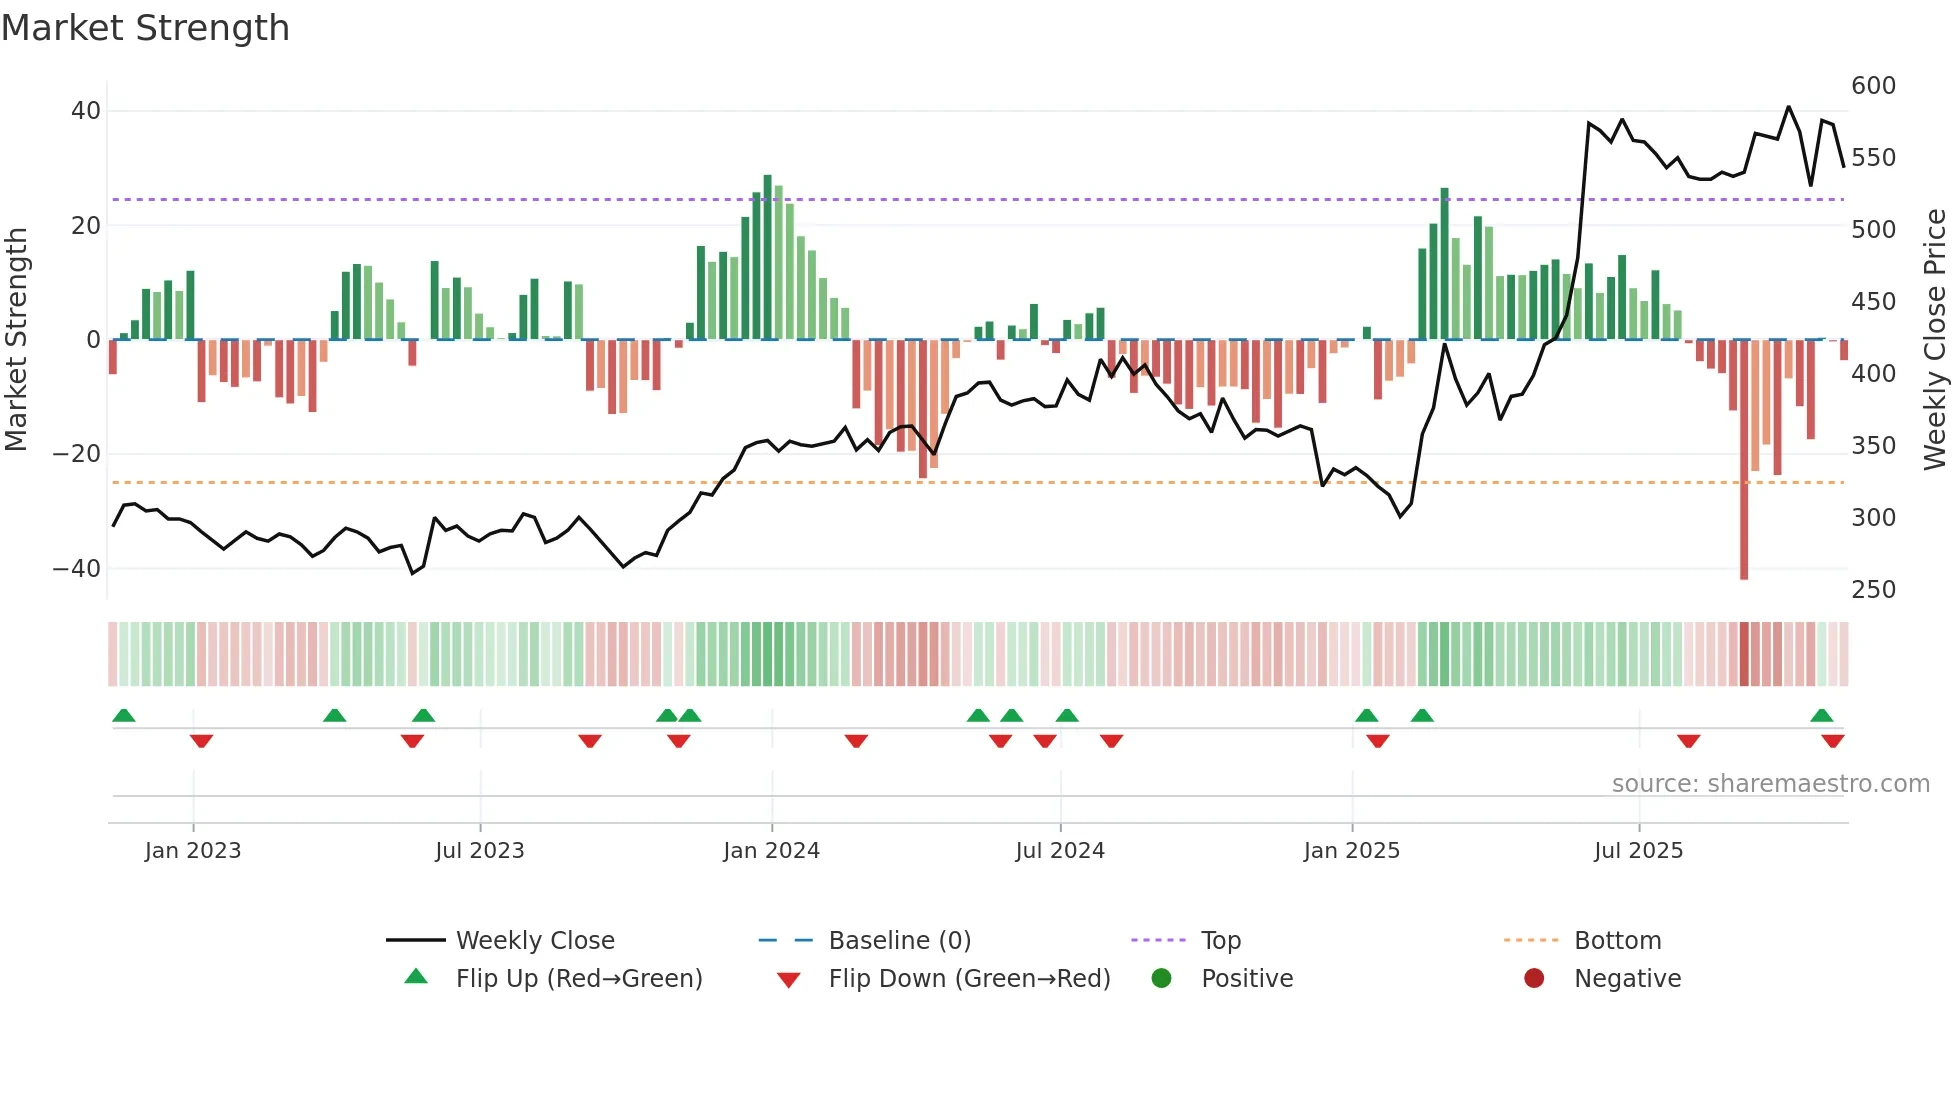
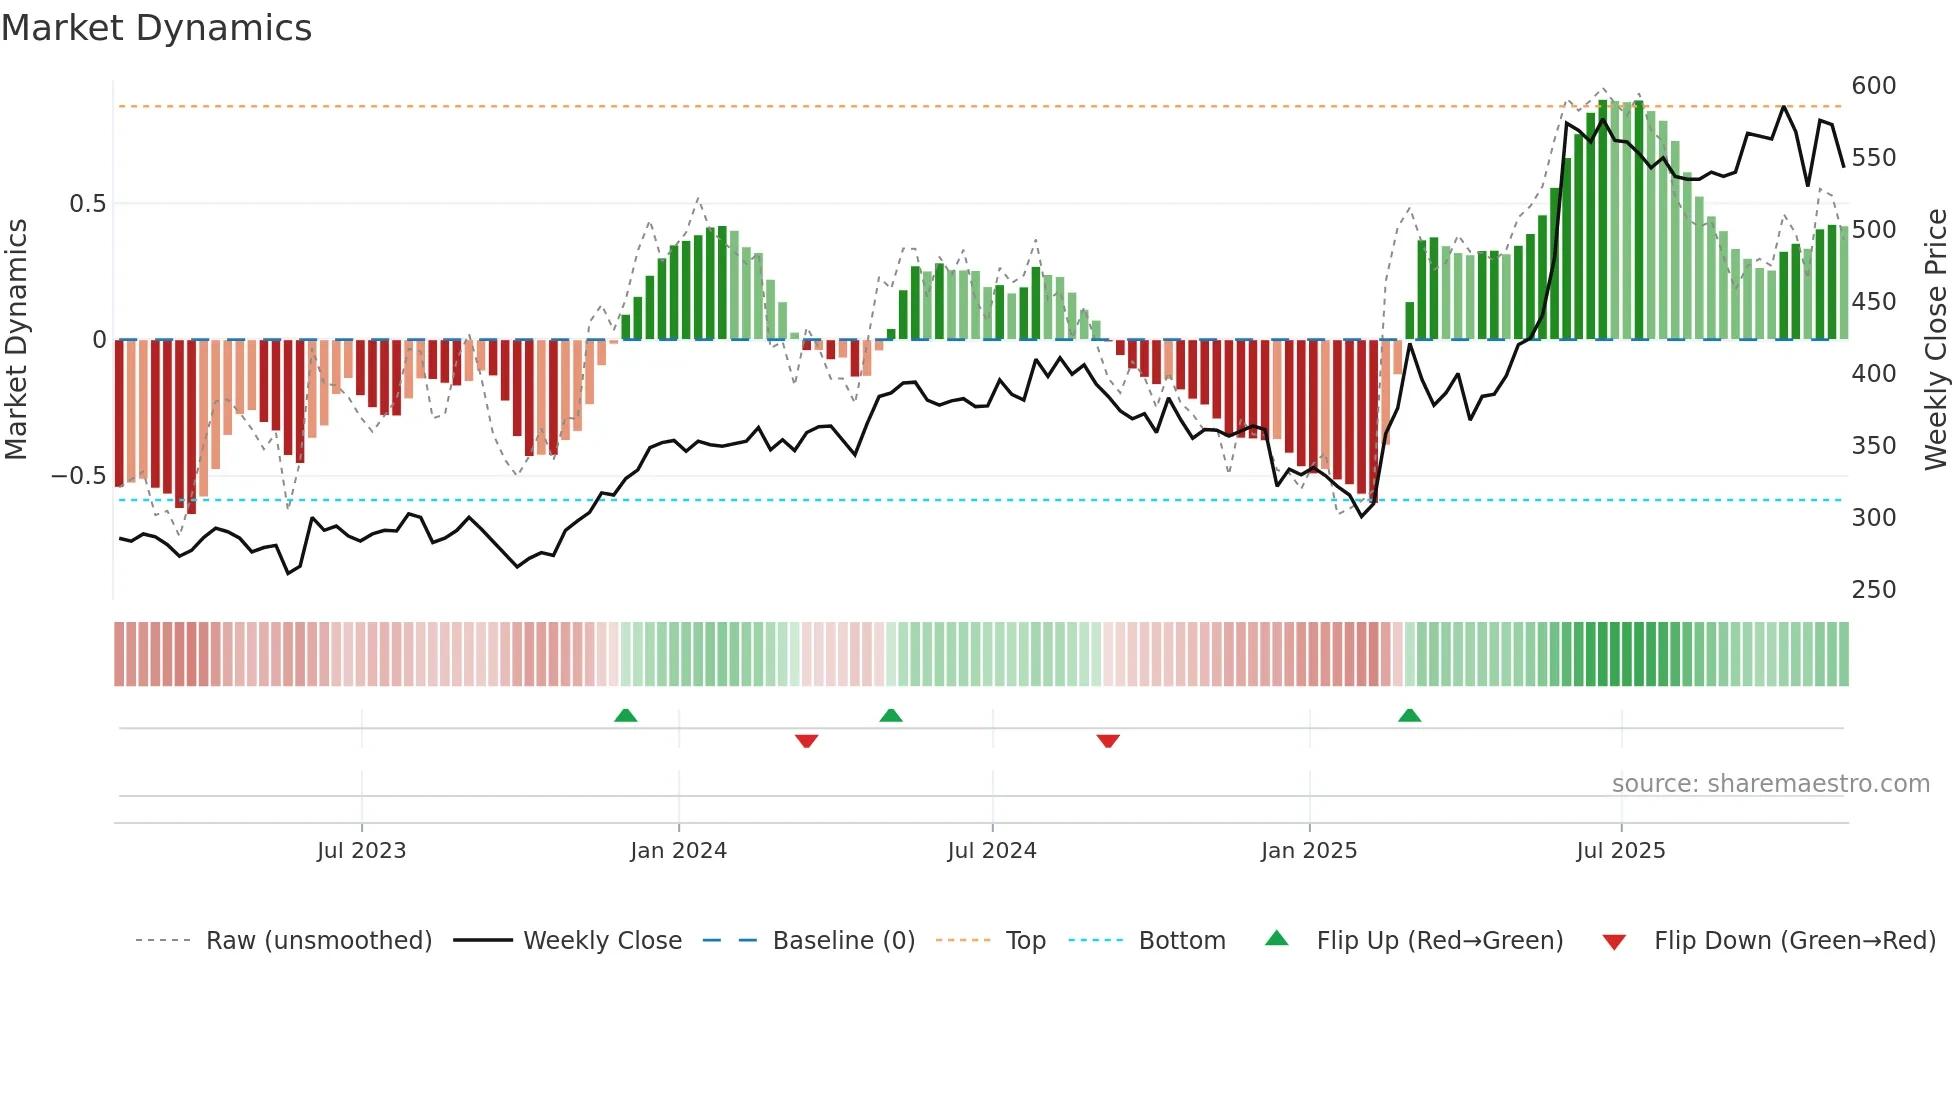
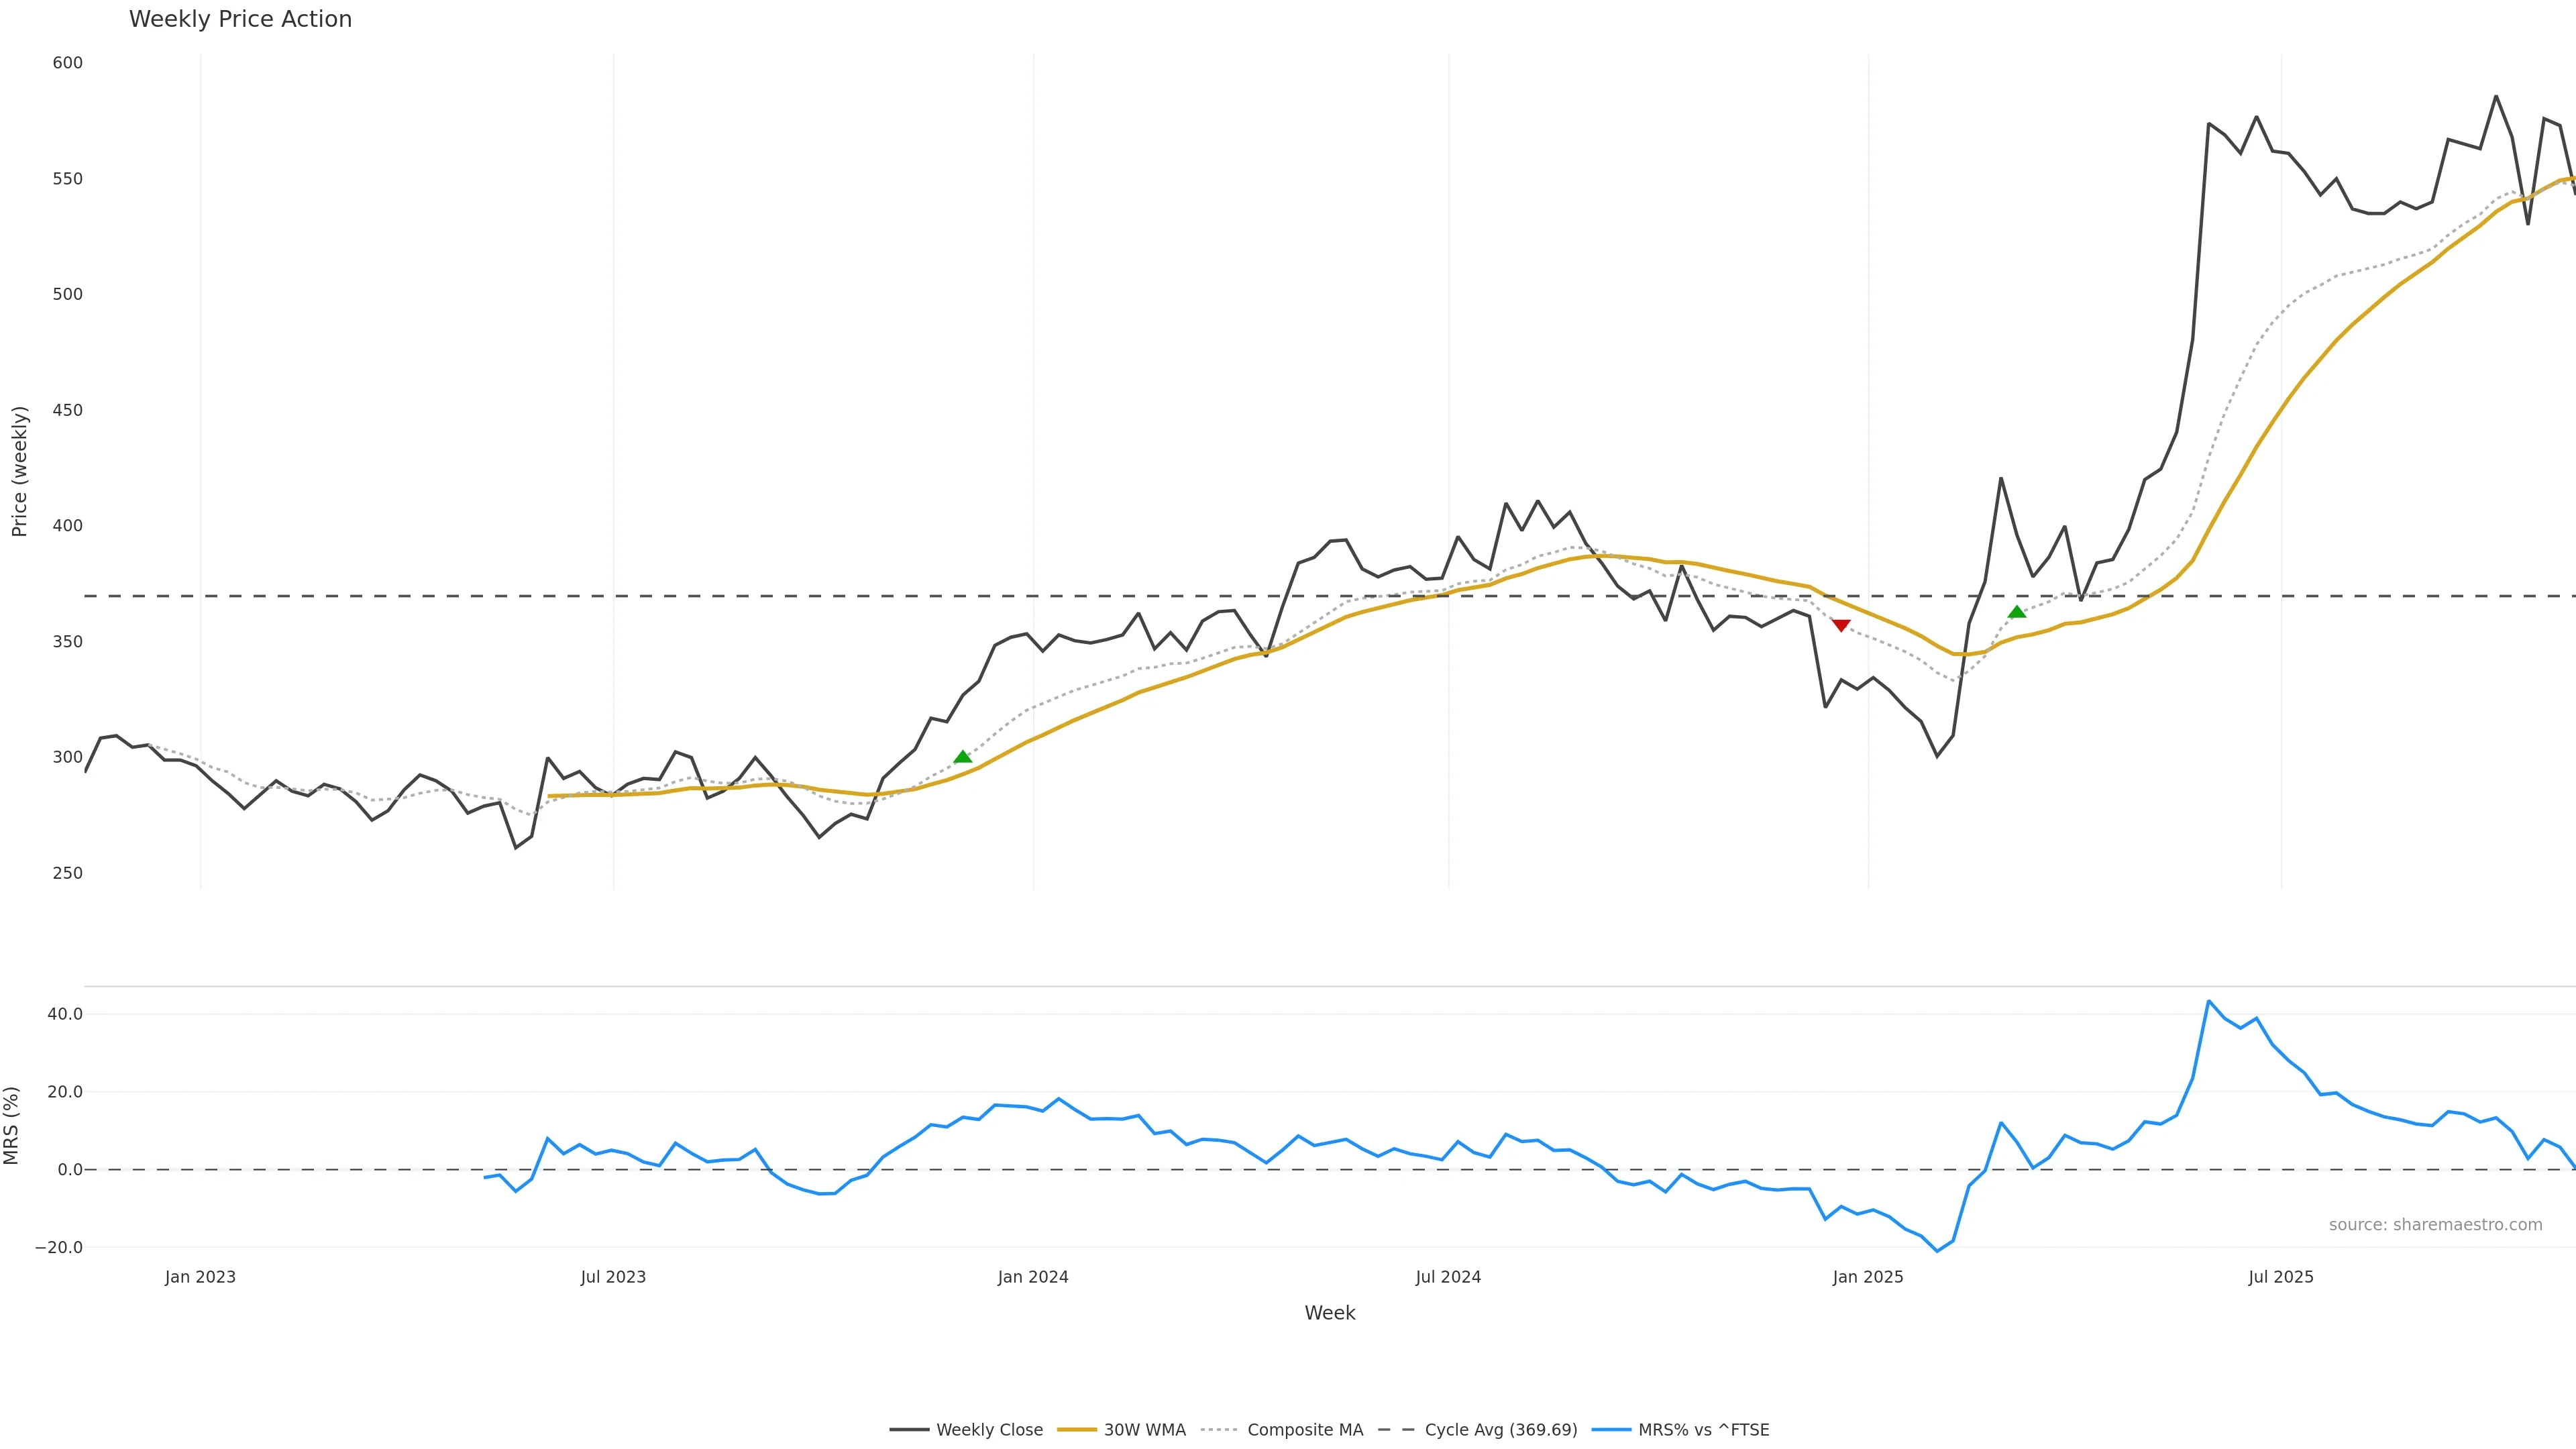
Convergence / Divergence (SI vs Price)
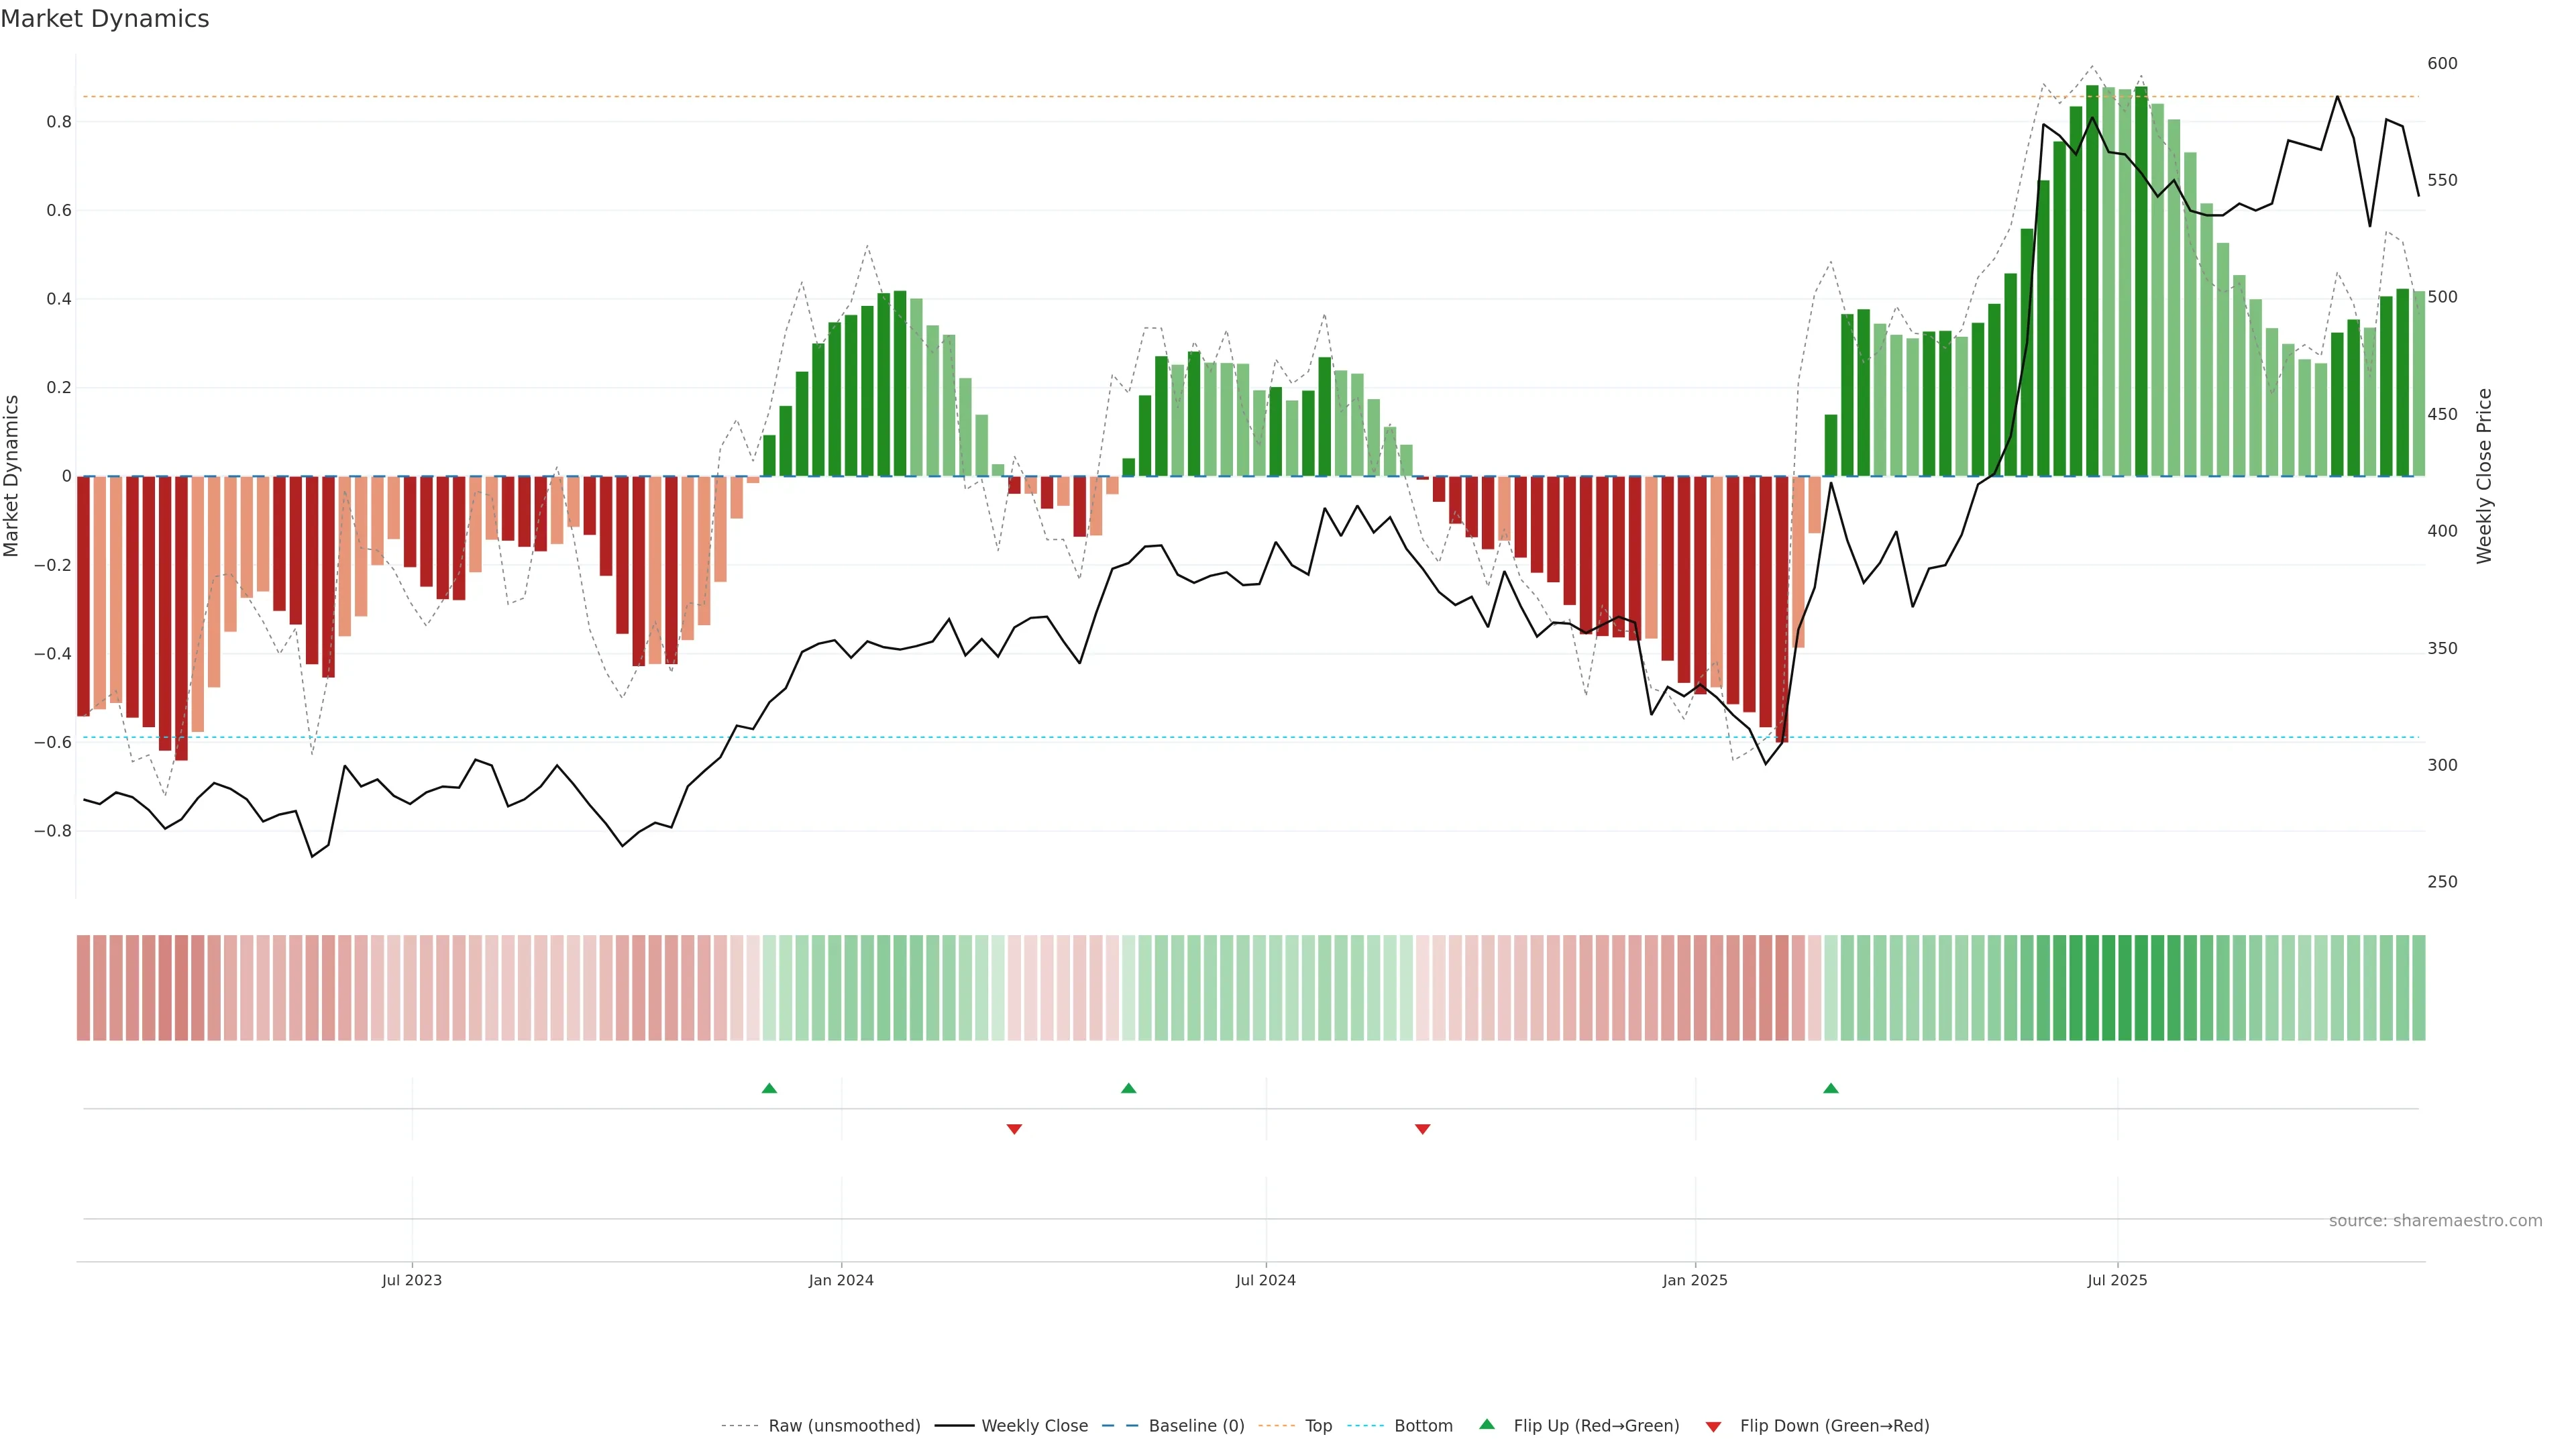
Price and Dynamics disagree (tug-of-war). — Wait for resolution or use smaller sizing.
Score -0.2
+0 / -1
Price and Dynamics disagree (tug-of-war).
Price and Dynamics disagree (tug-of-war). Wait for resolution or use smaller sizing. In essence this reflects alignment between price and strength/intent with a bearish tilt.
pol -0.2
conf 0.5
mild · medium
What it means
Price and Dynamics disagree (tug-of-war). Wait for resolution or use smaller sizing. In essence this reflects alignment between price and strength/intent with a bearish tilt.
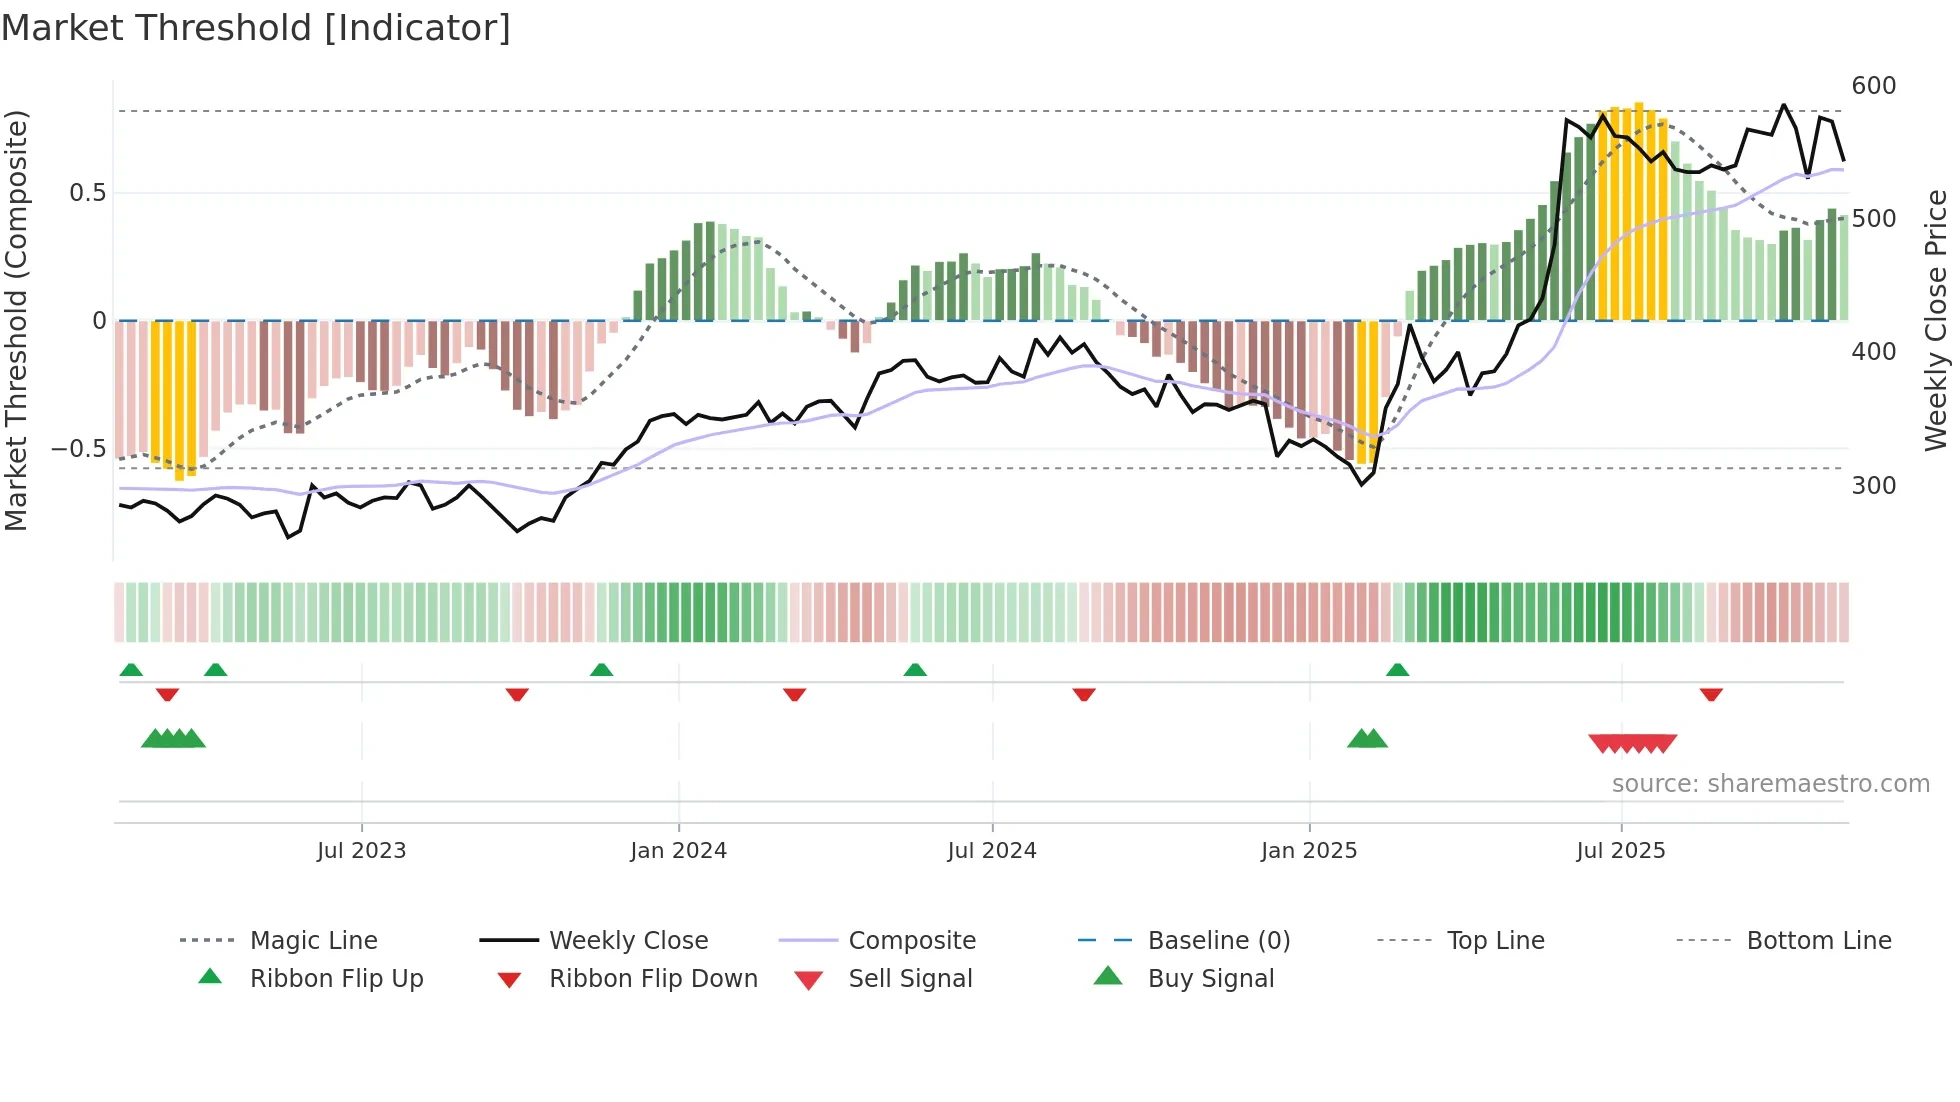
Implications
Raises risk of failed breakouts; strength must prove itself on closes. (pol -0.20, conf 0.50 → mild/medium)
No additional observations.