Trajan Group Holdings Limited
TRJ ASX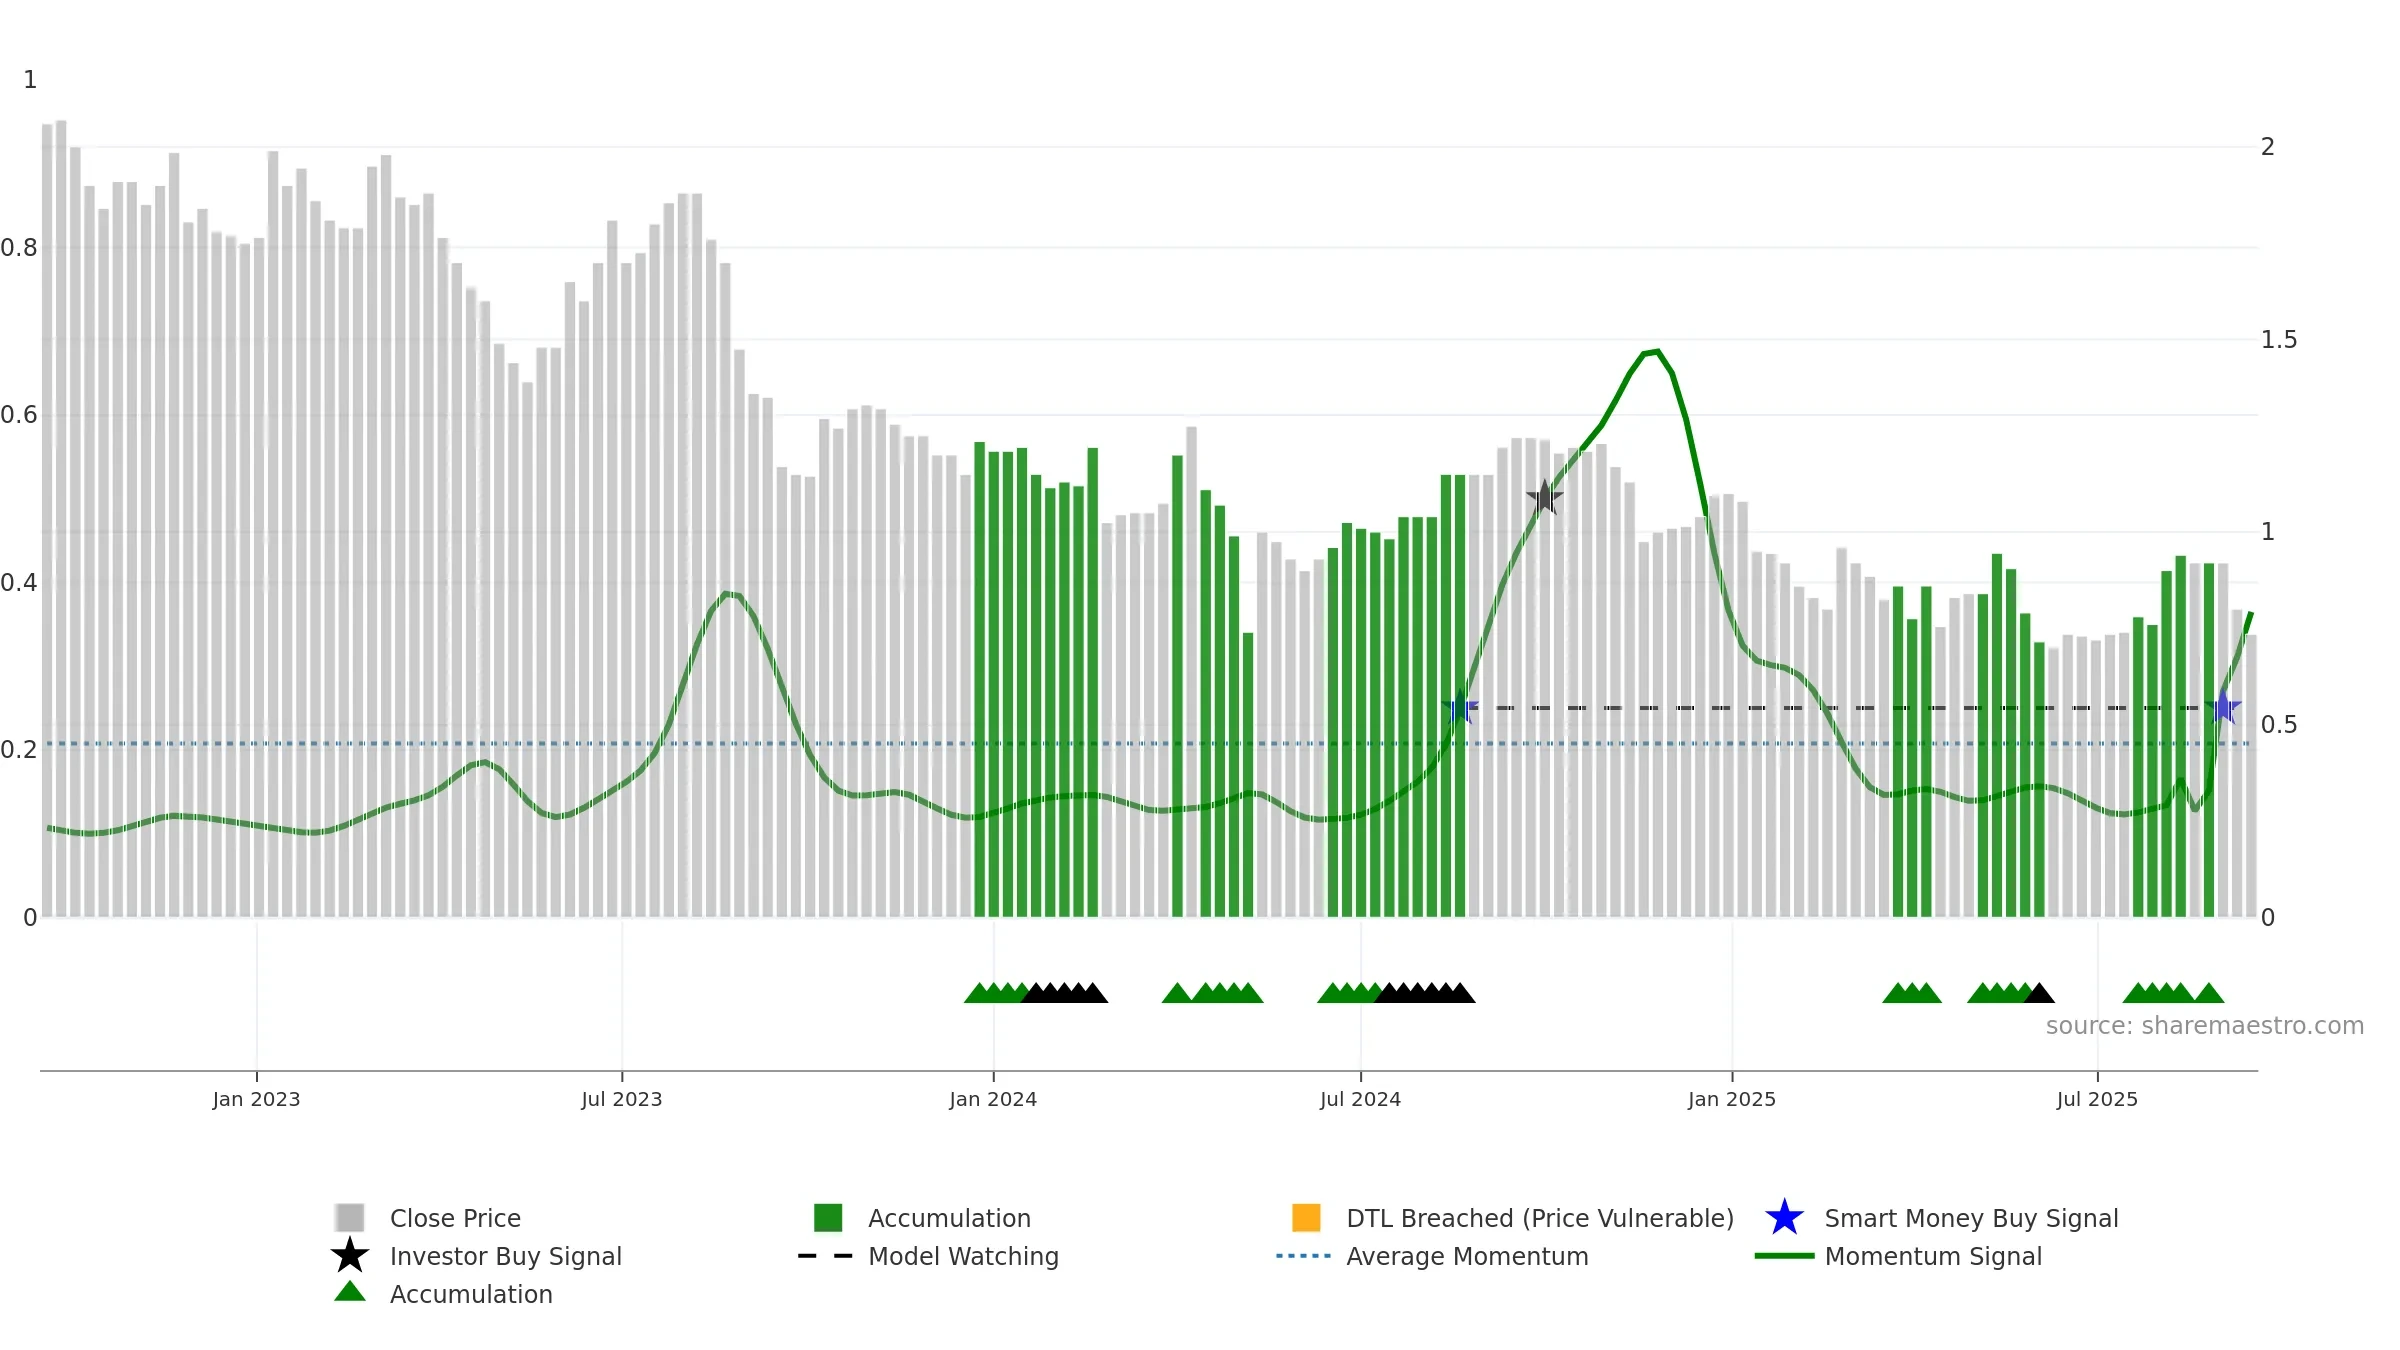
Weekly Report
Trajan Group Holdings Limited closed at 0.7350 (-2.00% WoW) . Data window ends Mon, 15 Sep 2025.
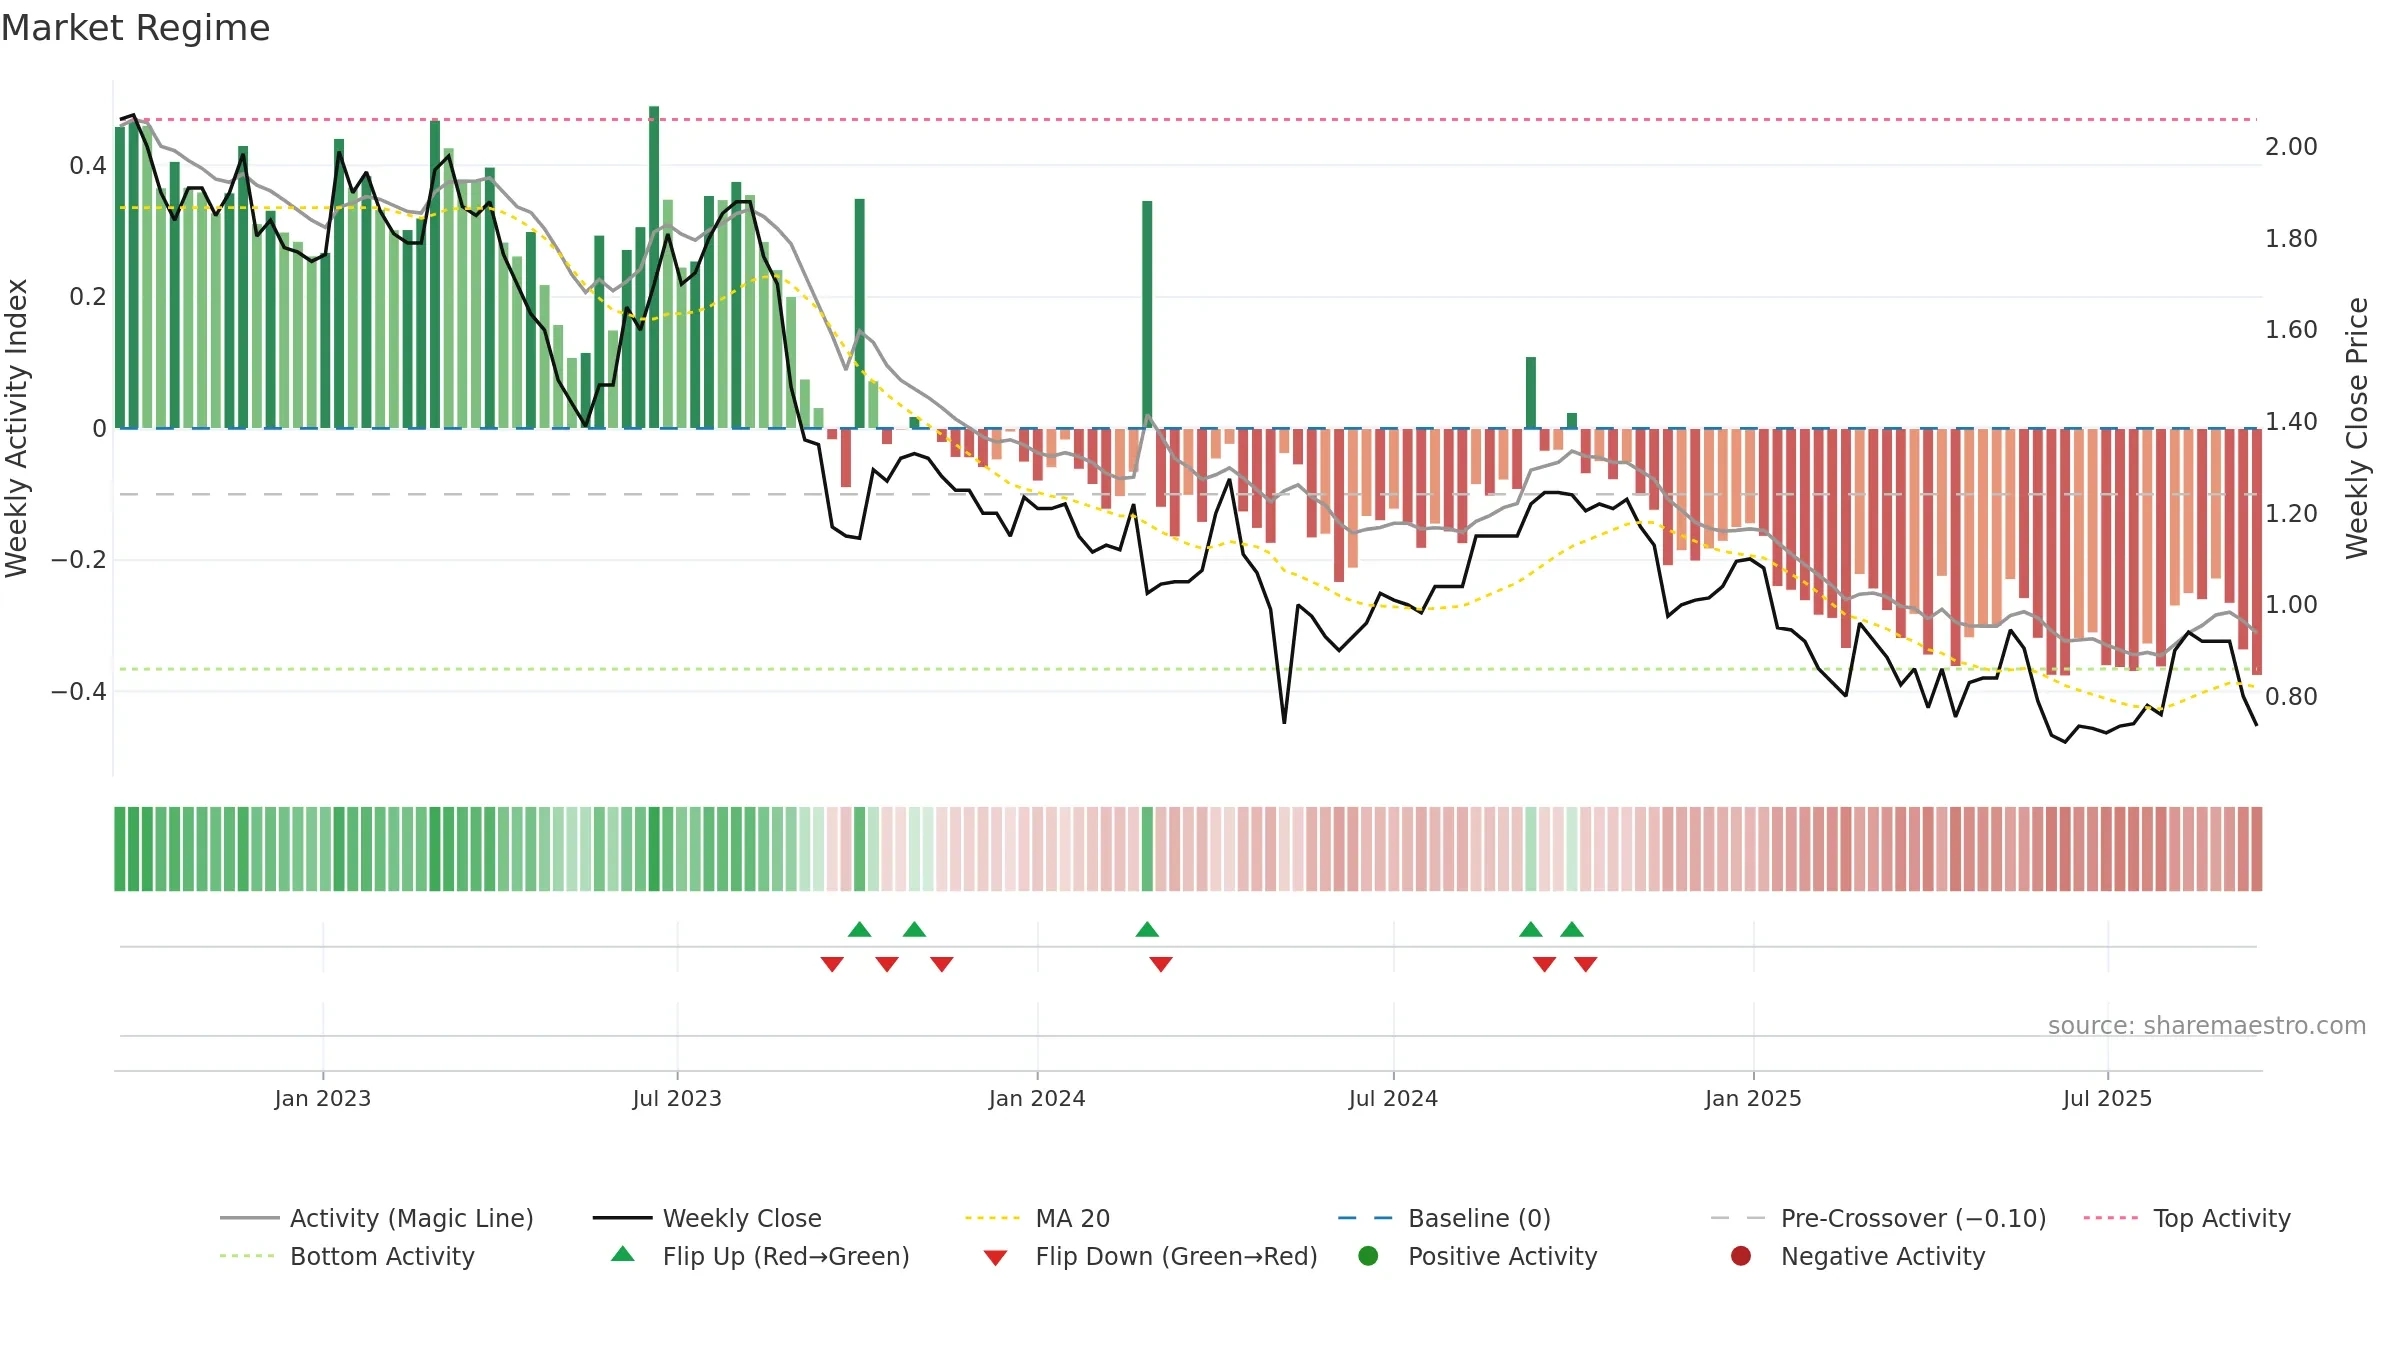
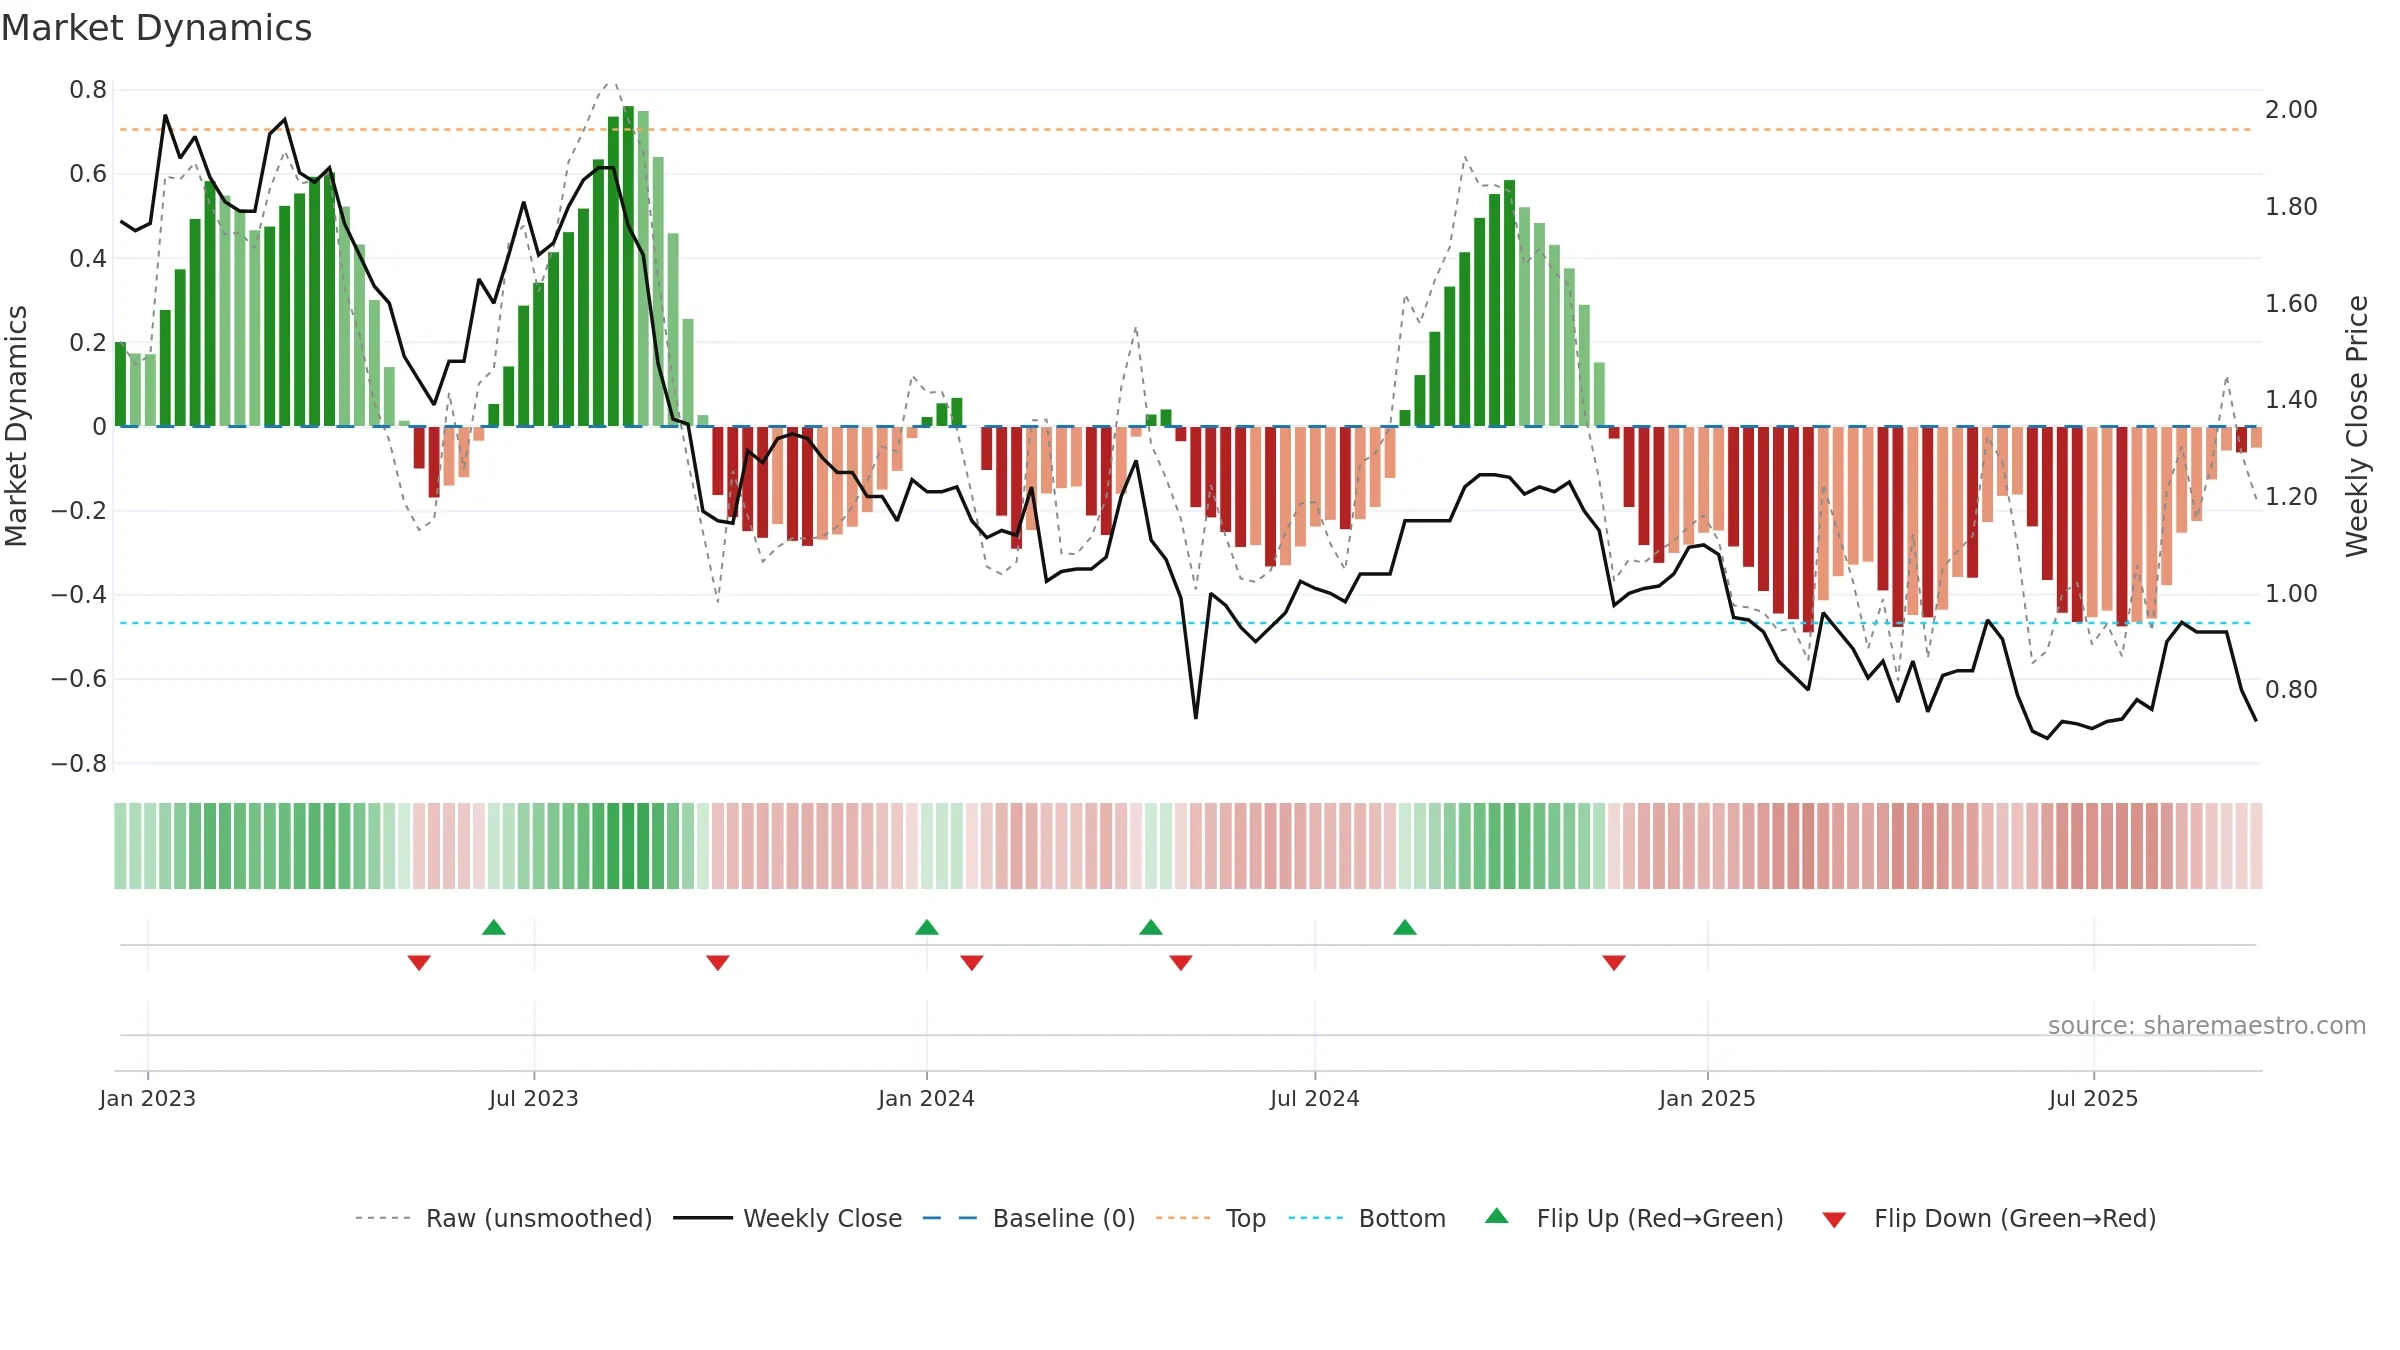
How to read this — Price slope is downward, indicating persistent supply pressure. Elevated weekly volatility increases whipsaw risk. Volume trend diverges from price — watch for fatigue or rotation. Fresh short-term downside crossover weakens near-term tone. Price sits below key averages, keeping pressure on the tape.
Down-slope argues for patience; rallies can fade sooner unless participation improves. Because liquidity isn’t confirming, prefer evidence of fresh demand before chasing moves.
Gauge maps the trend signal to a 0–100 scale.
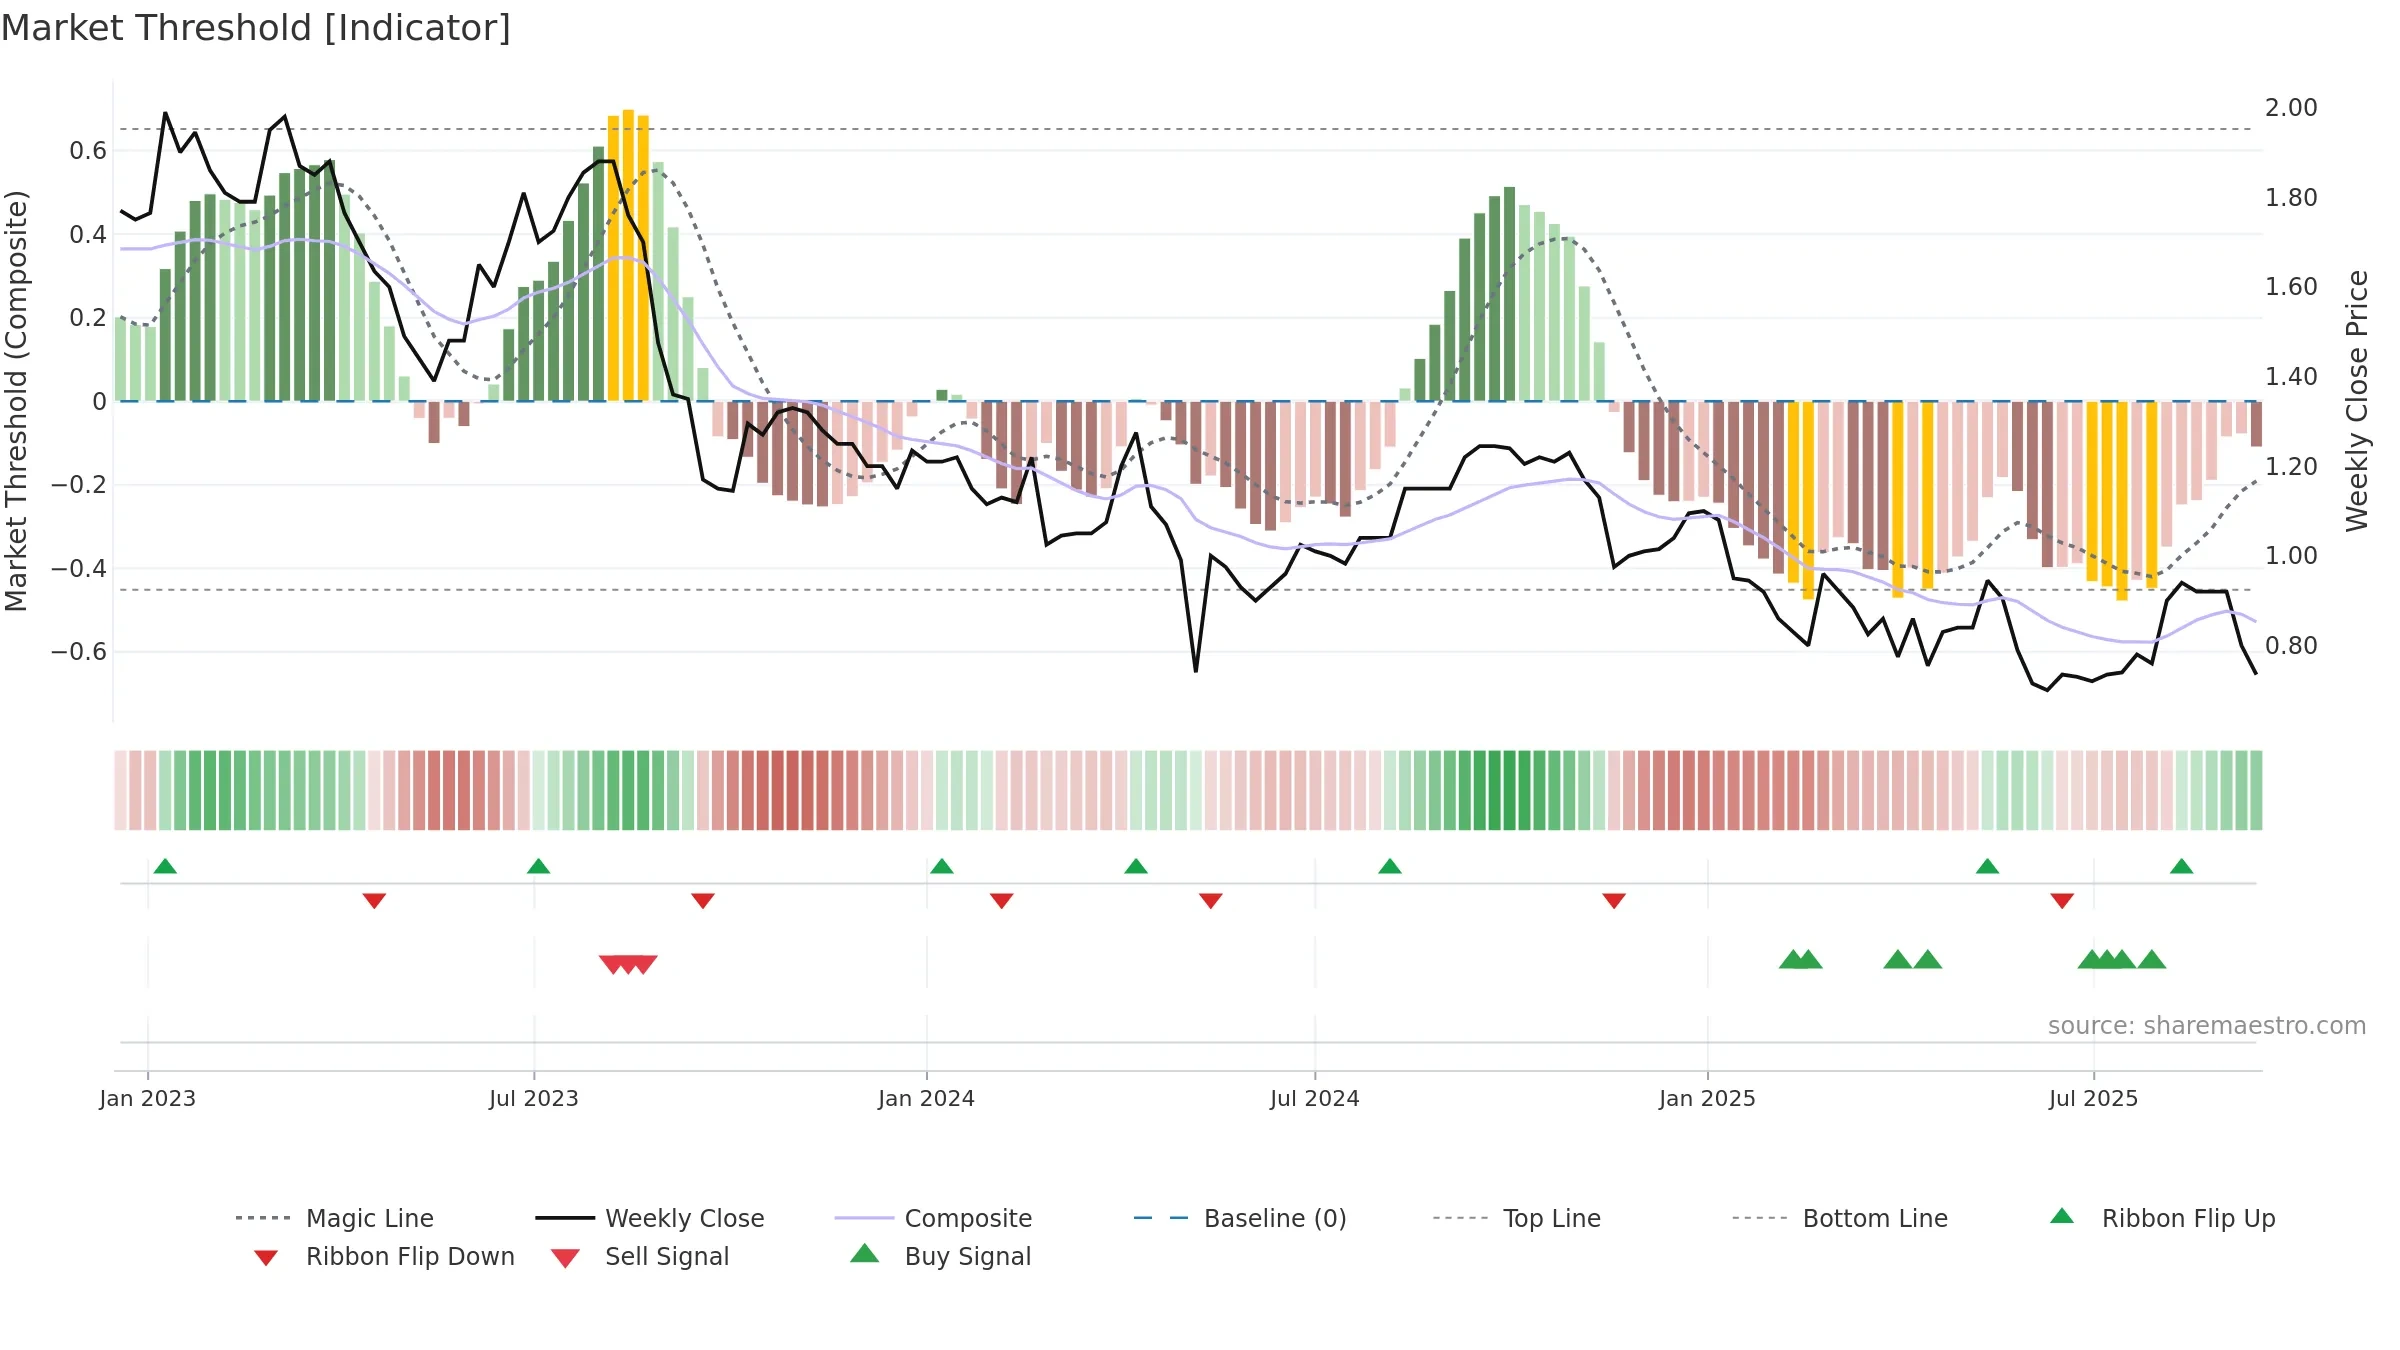
How to read this — Bearish backdrop but short-term momentum is improving; confirmation still needed.
Early improvement — look for a reclaim of 0.50→0.60 to validate.
Price is below fair value; potential upside if momentum constructive.
Conclusion
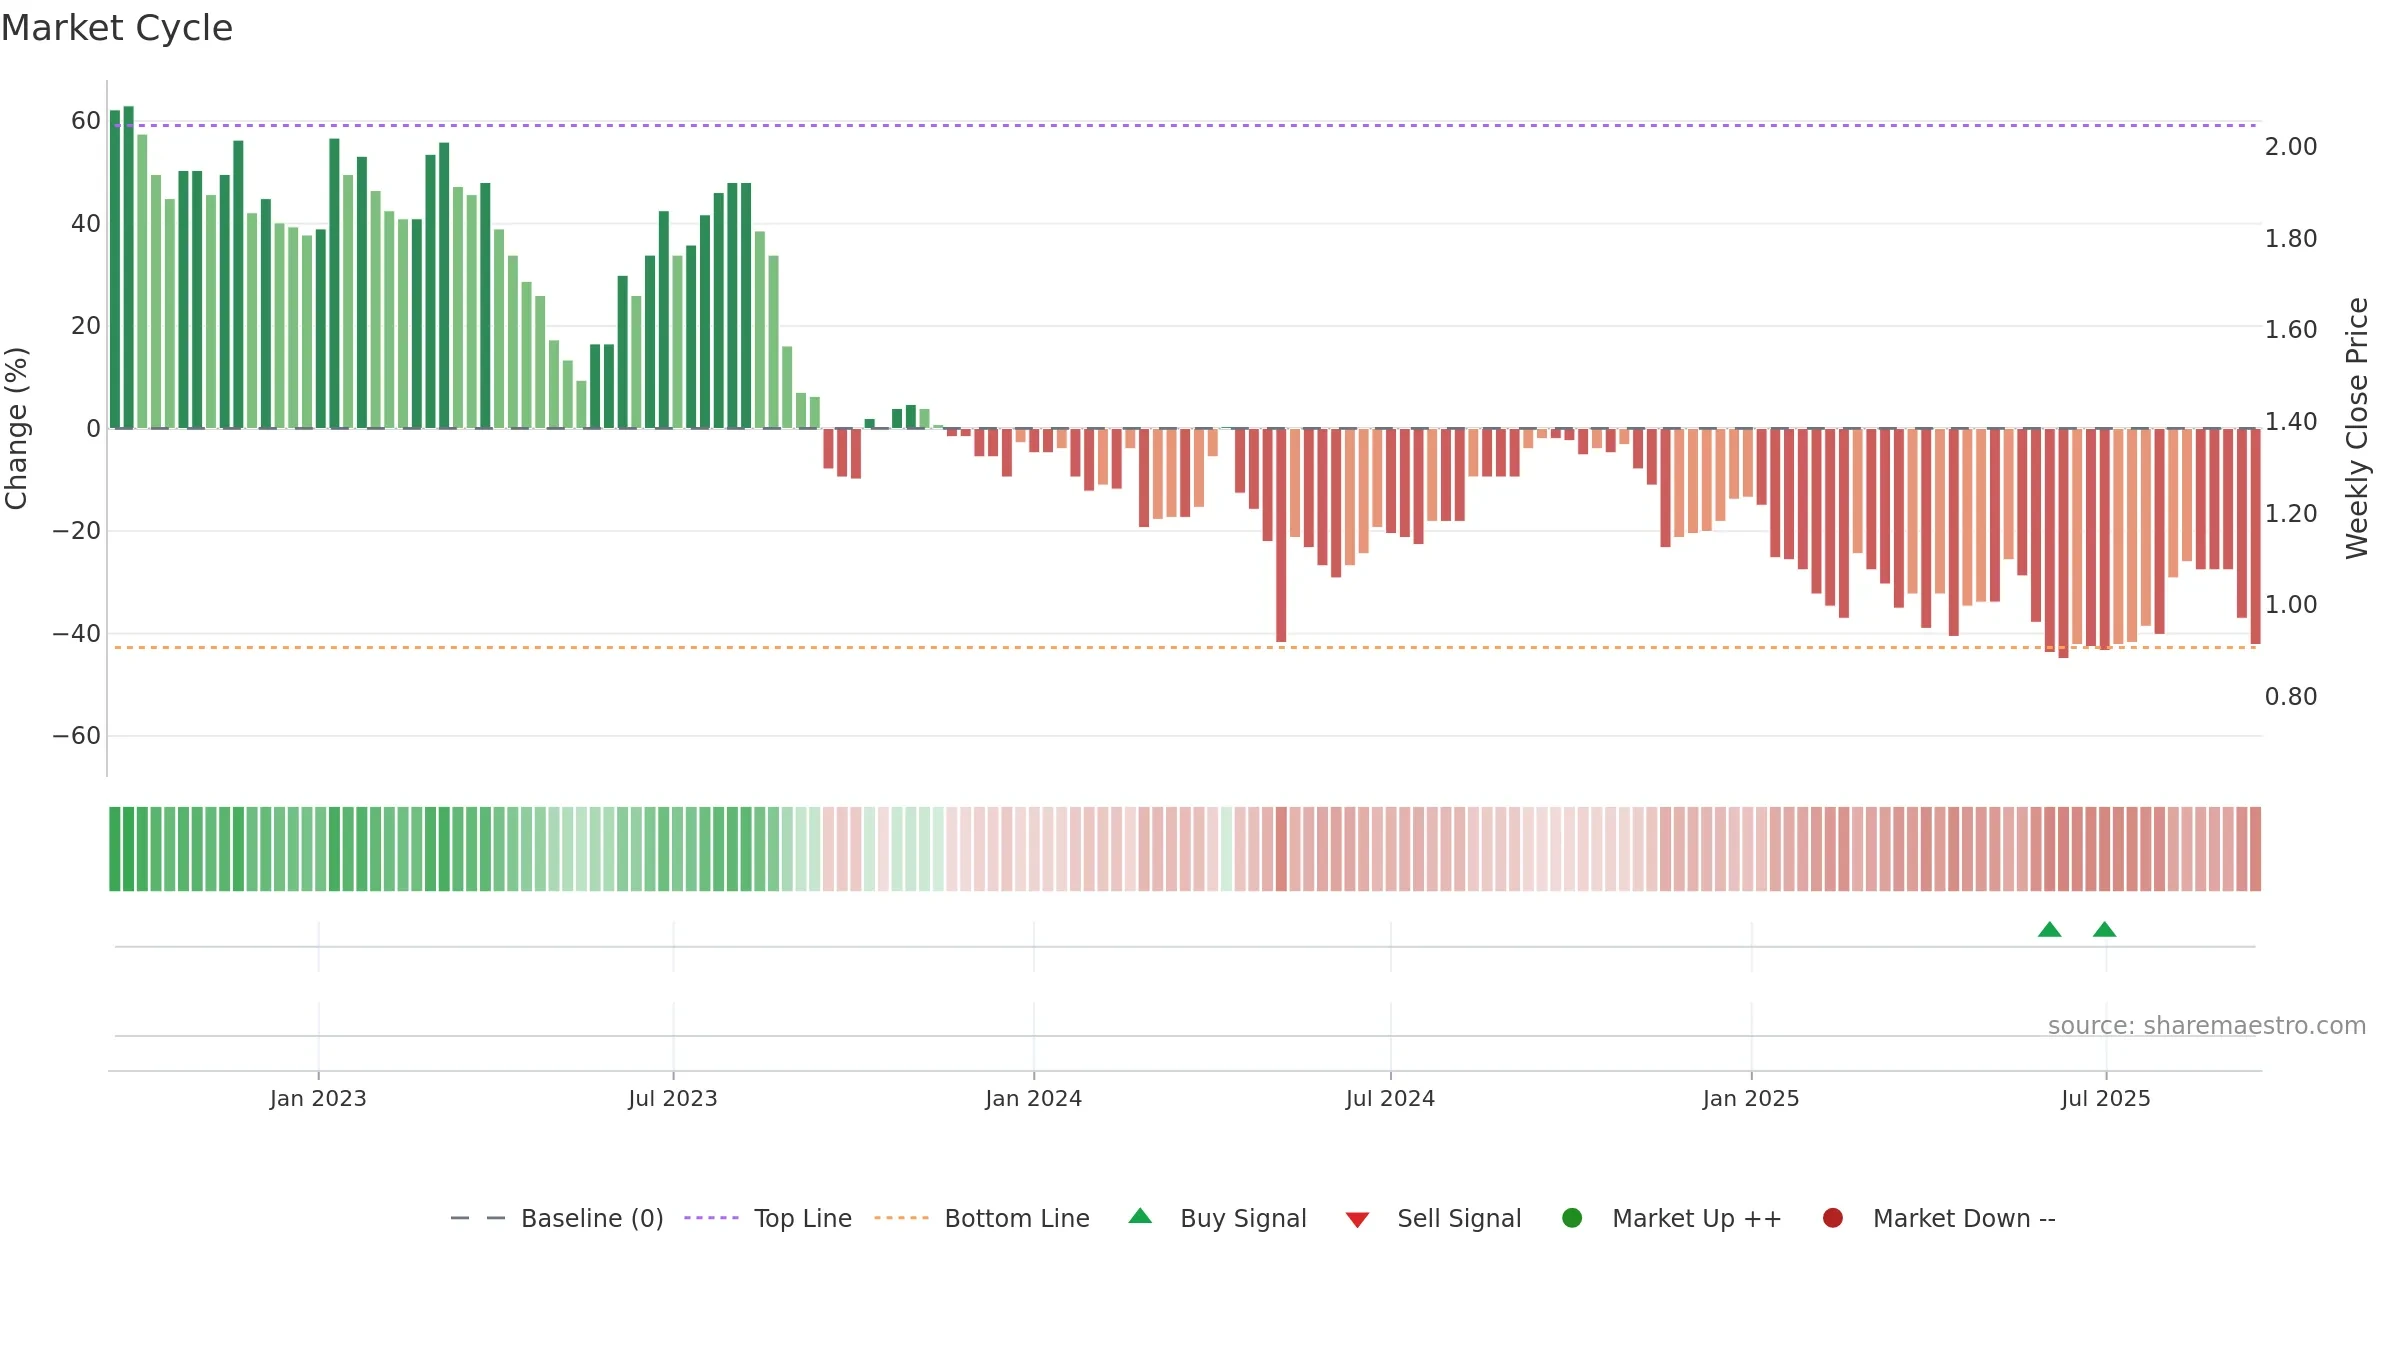
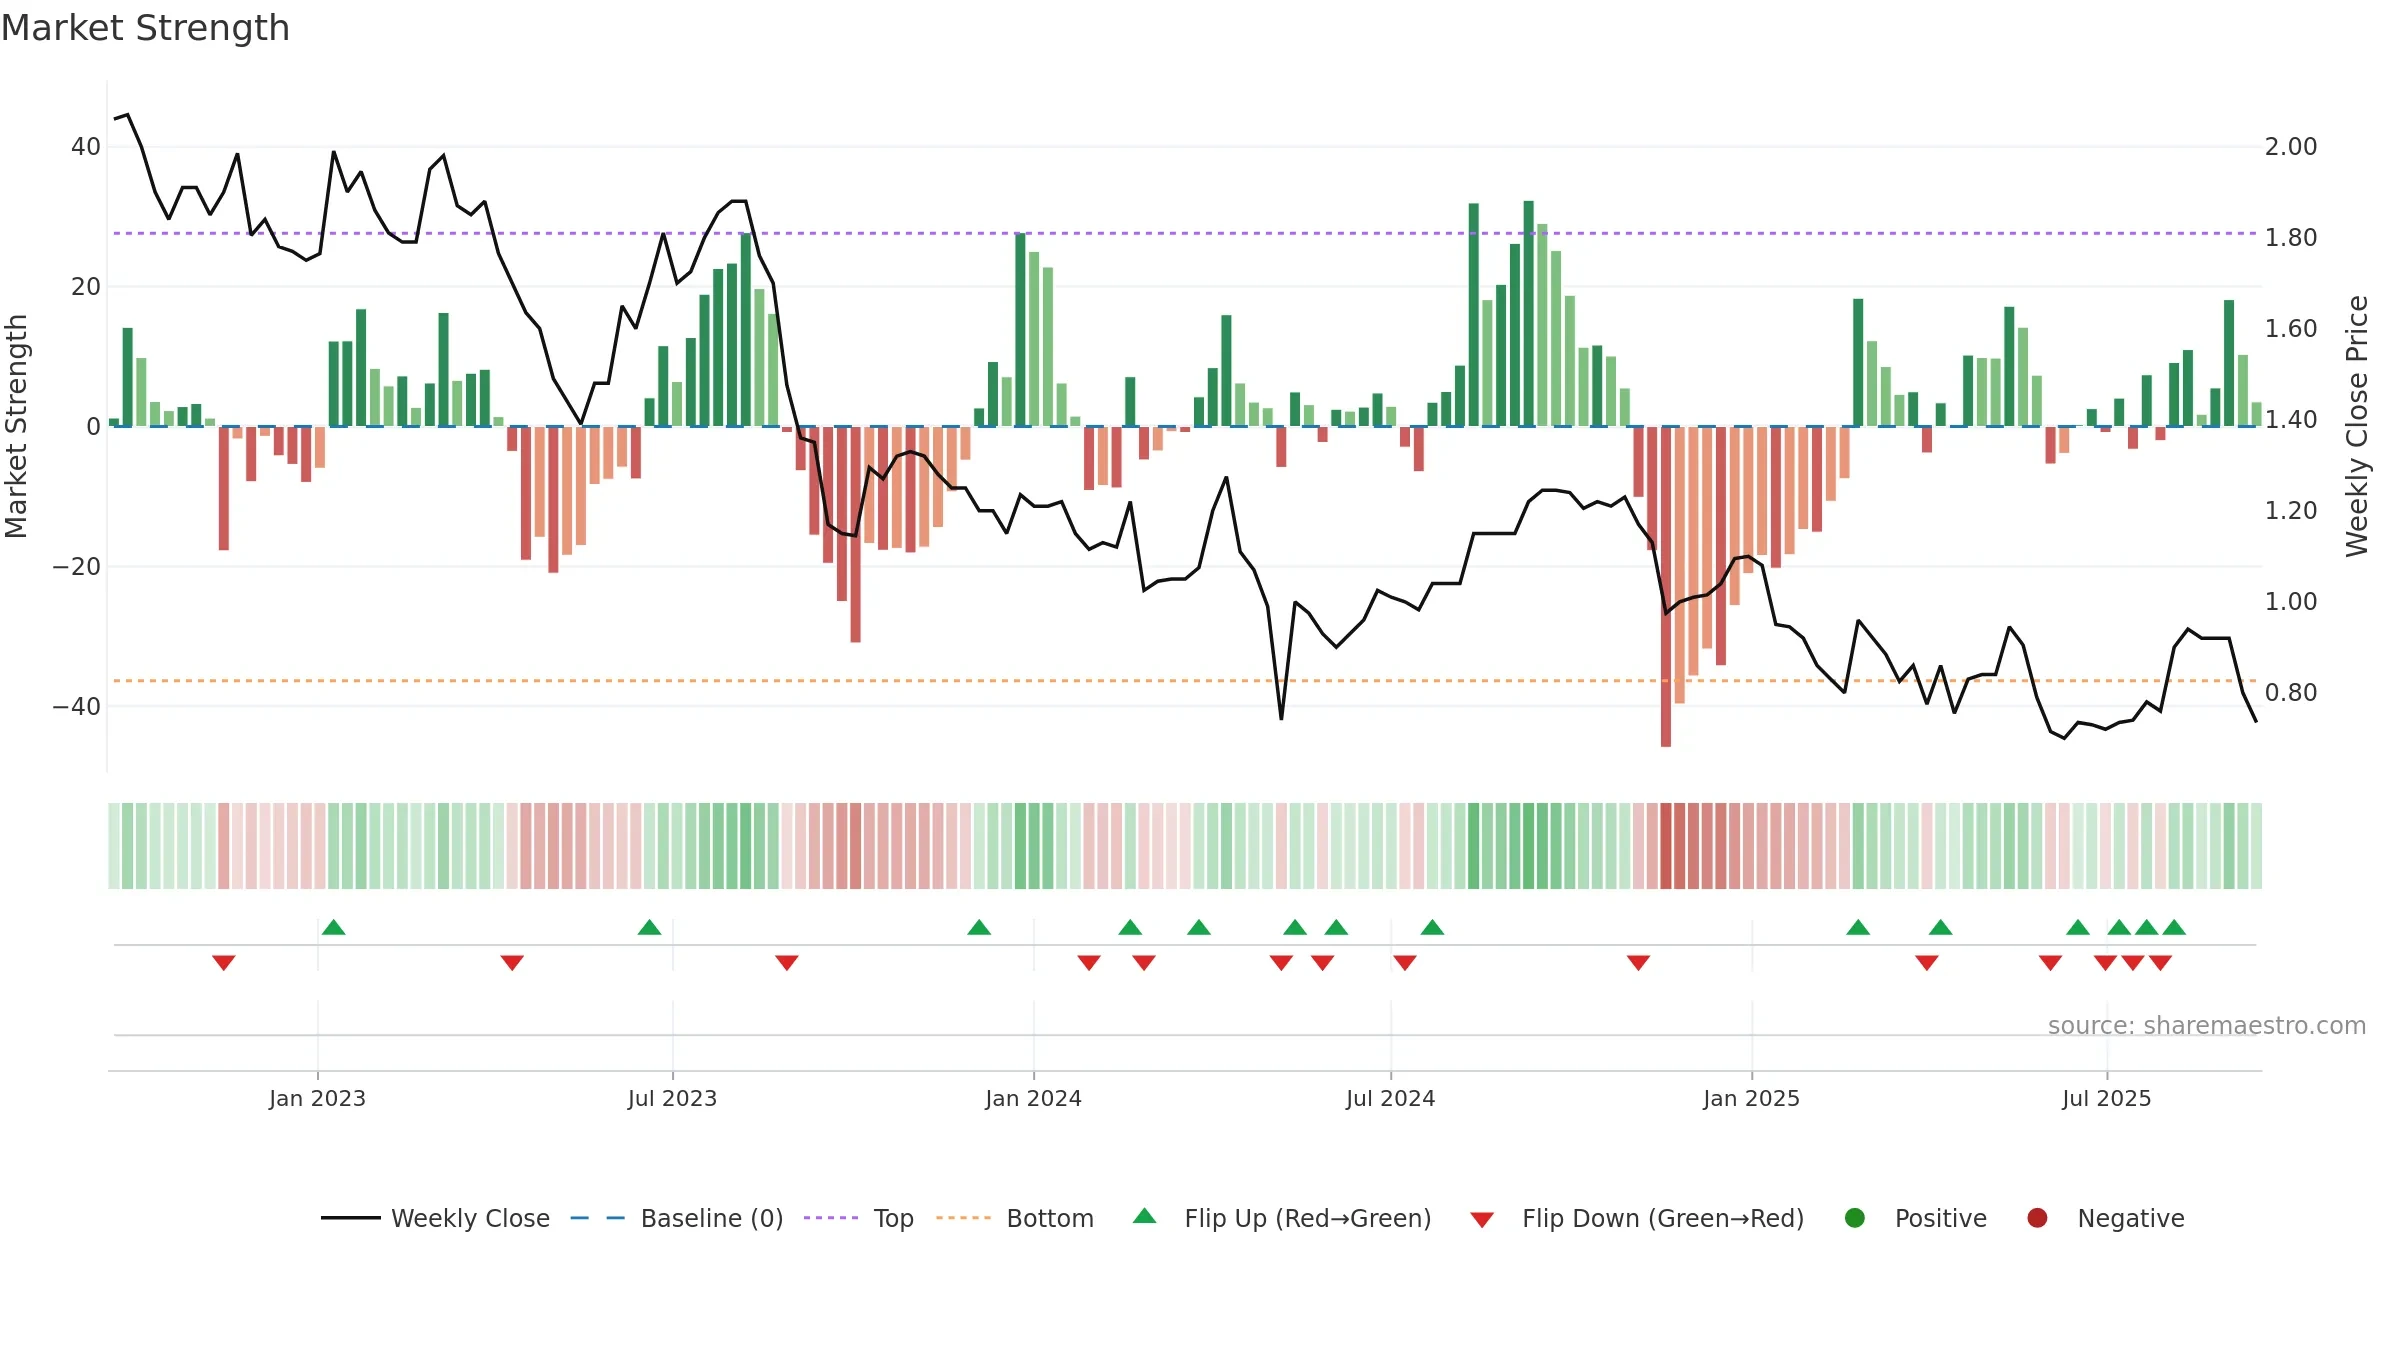
Negative setup. ★★☆☆☆ confidence. Price window: -3. Trend: Bottoming Attempt; gauge 36. In combination, liquidity diverges from price.
- Early improvement from bearish zone (bottoming attempt)
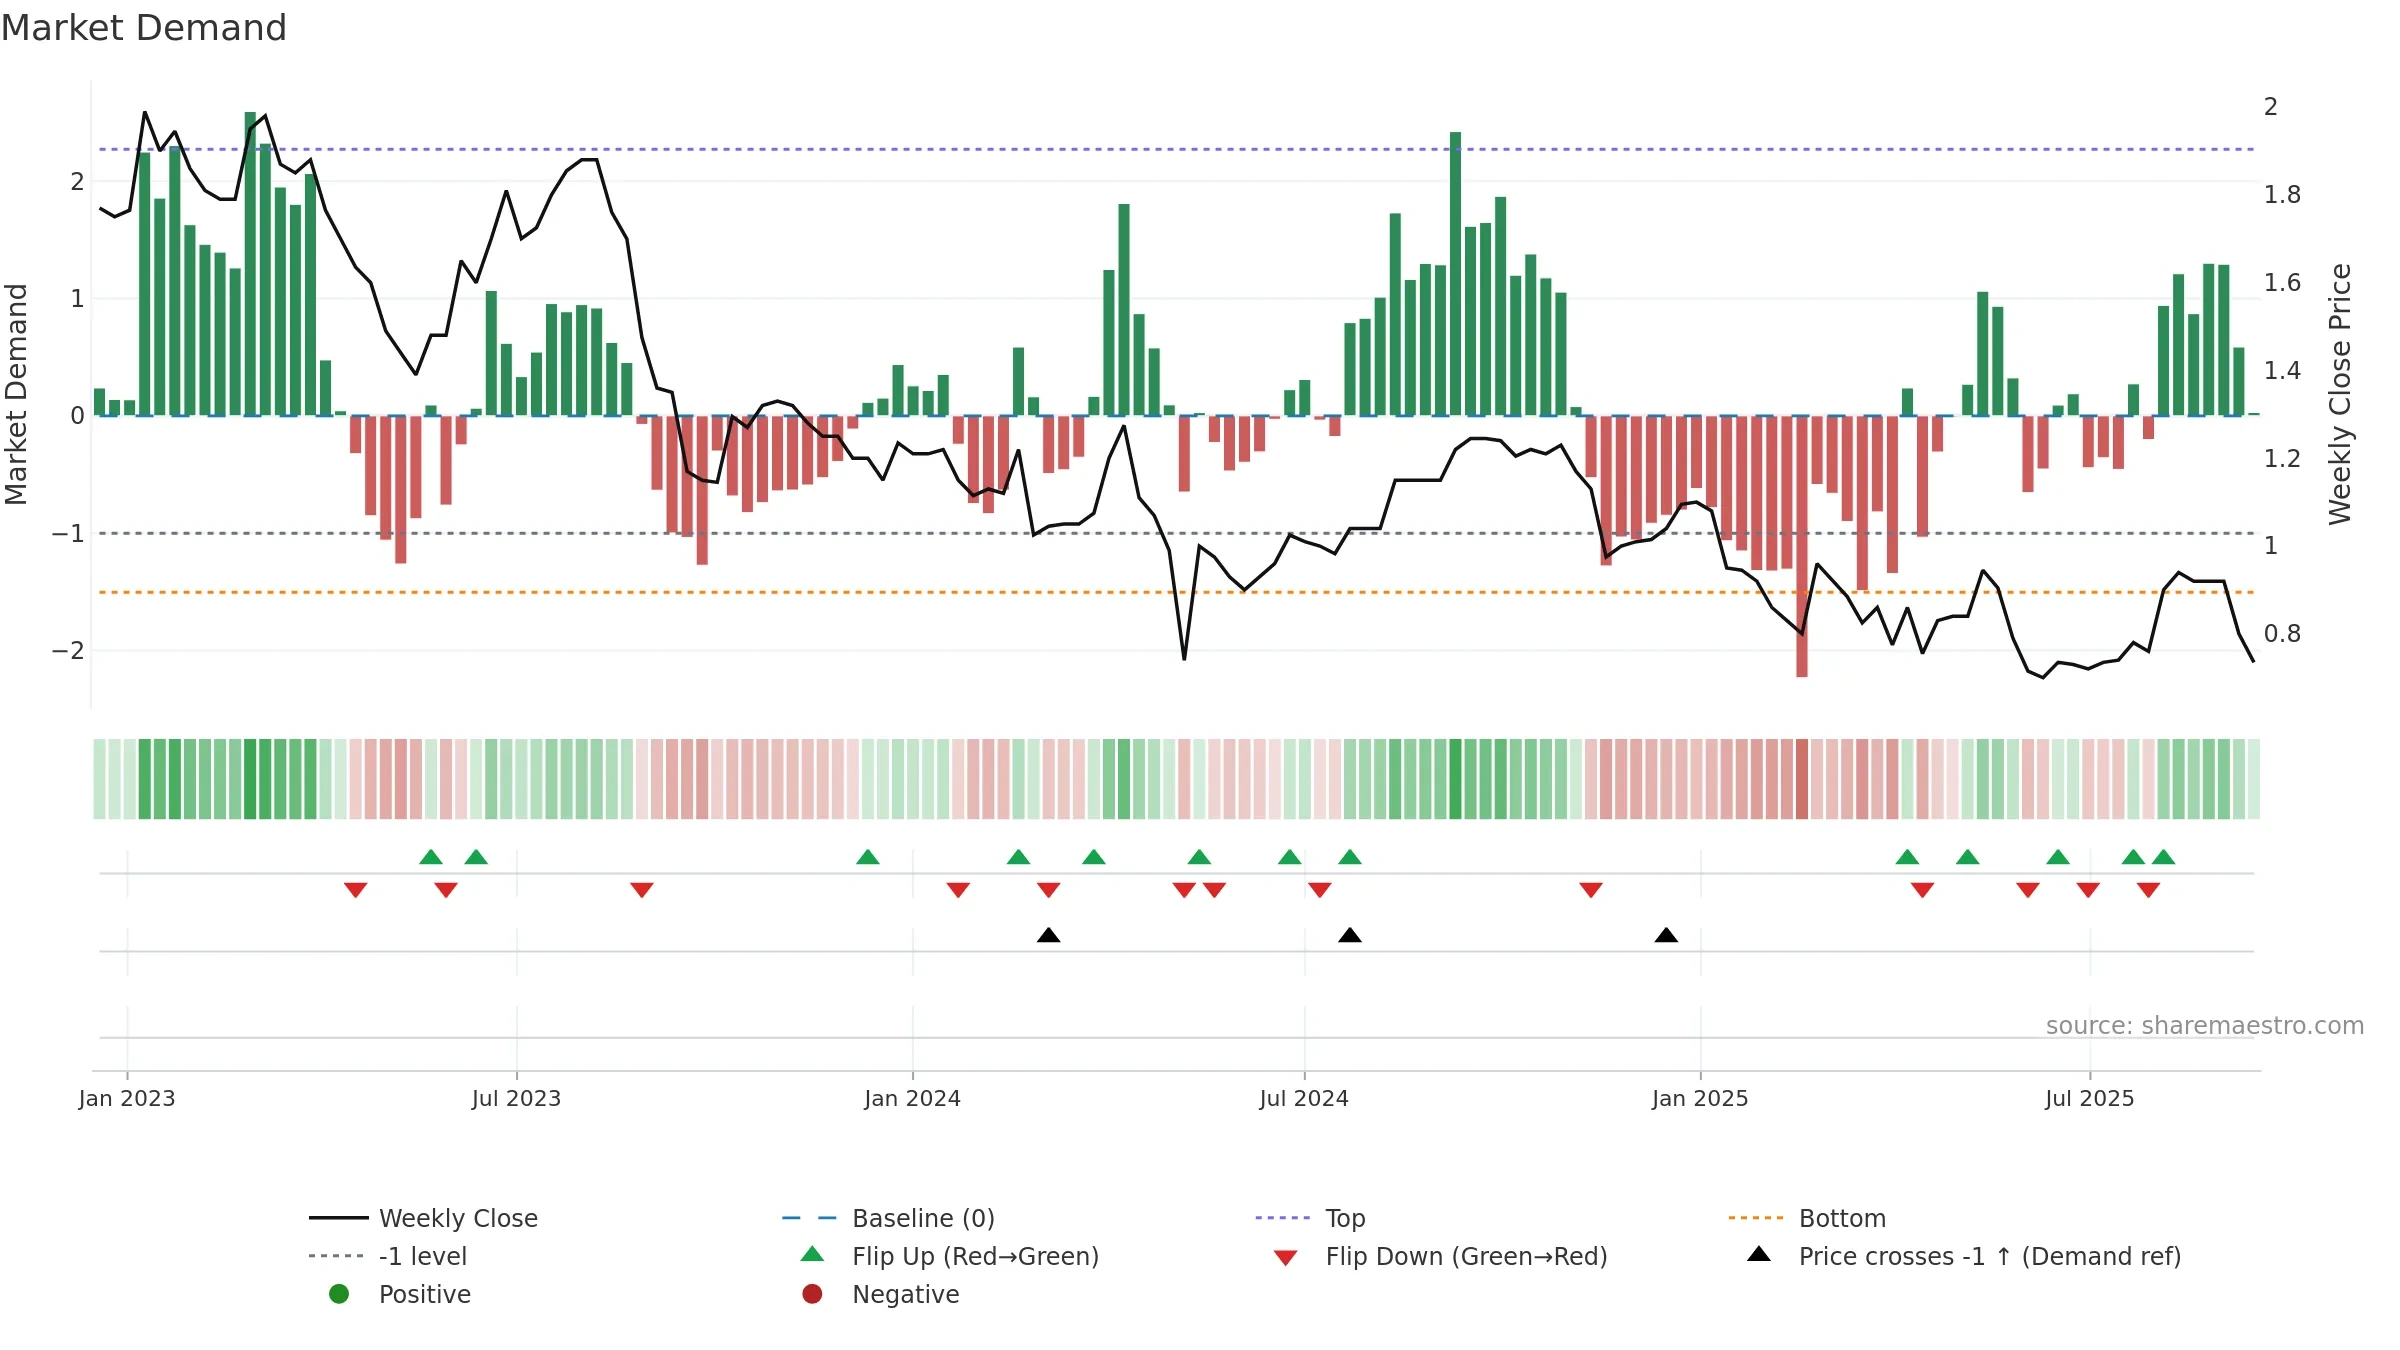
- Buyers step in at depressed levels (accumulation)
- Price is not above key averages
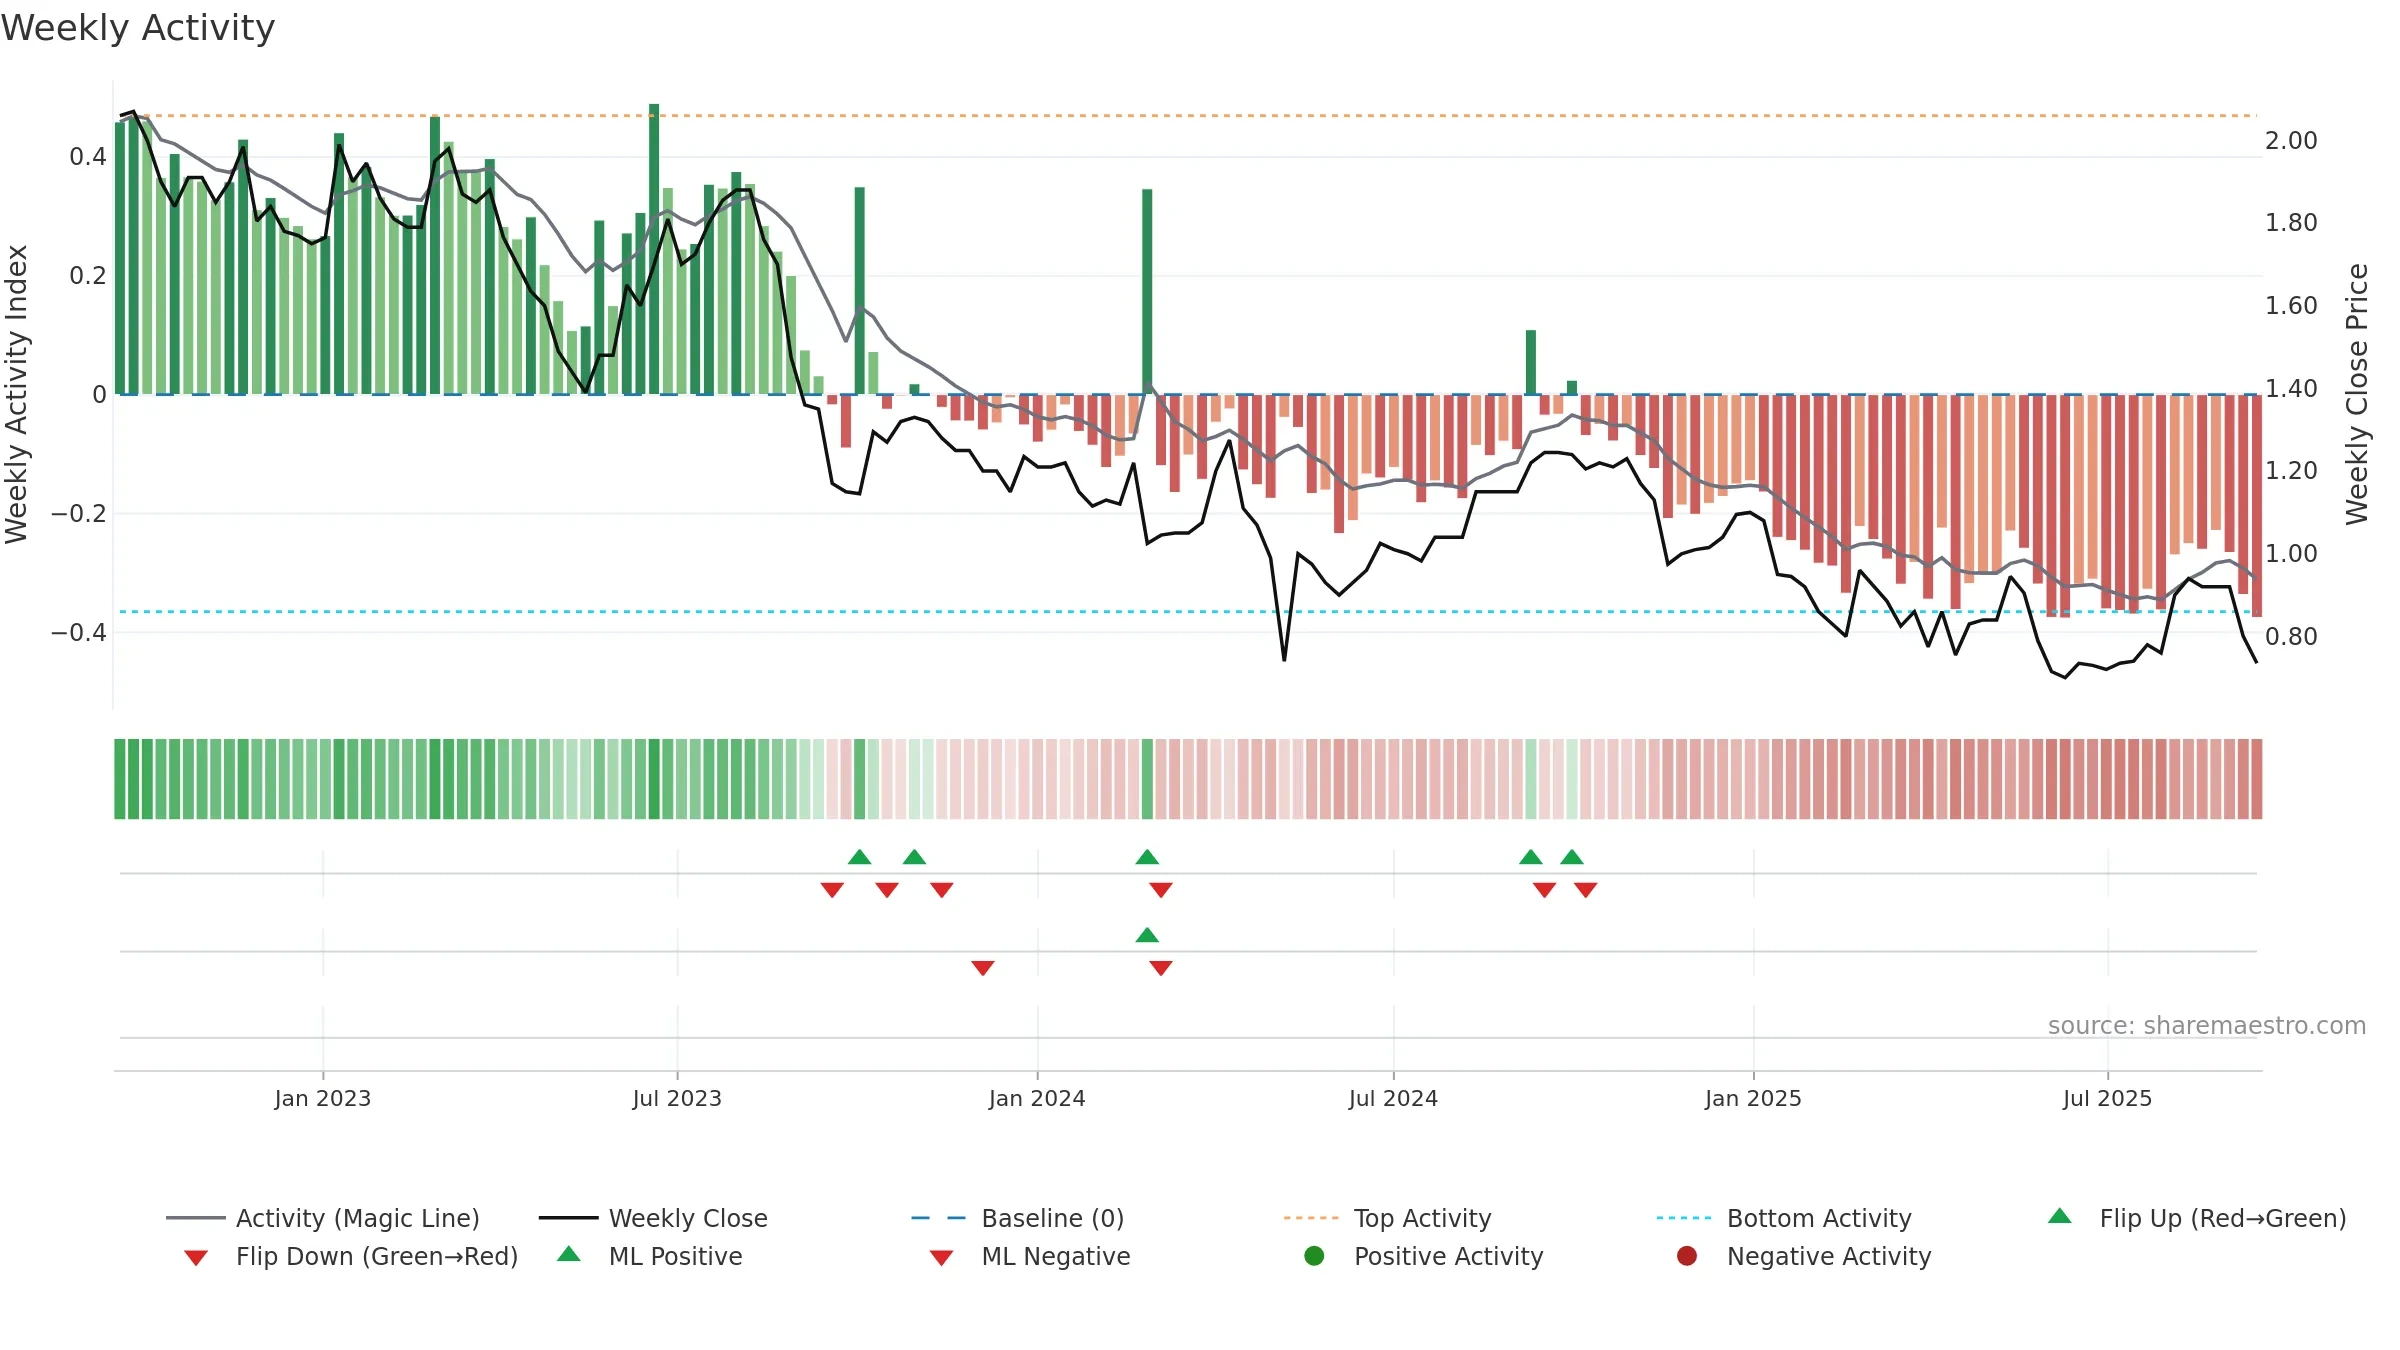
- Liquidity diverges from price
- High return volatility raises whipsaw risk
- Negative multi-week performance
Why: Price window -3.29% over 8w. Close is -21.81% below the prior-window high. Return volatility 6.50%. Volume trend rising. Liquidity divergence with price. Trend state bottoming attempt. Low-regime (≤0.25) upticks 4/5 (80.0%) • Accumulating. 4–8w crossover bearish. Momentum neutral and rising. Valuation supportive skew.
Tip: Most metrics include a hover tooltip where they appear in the report.