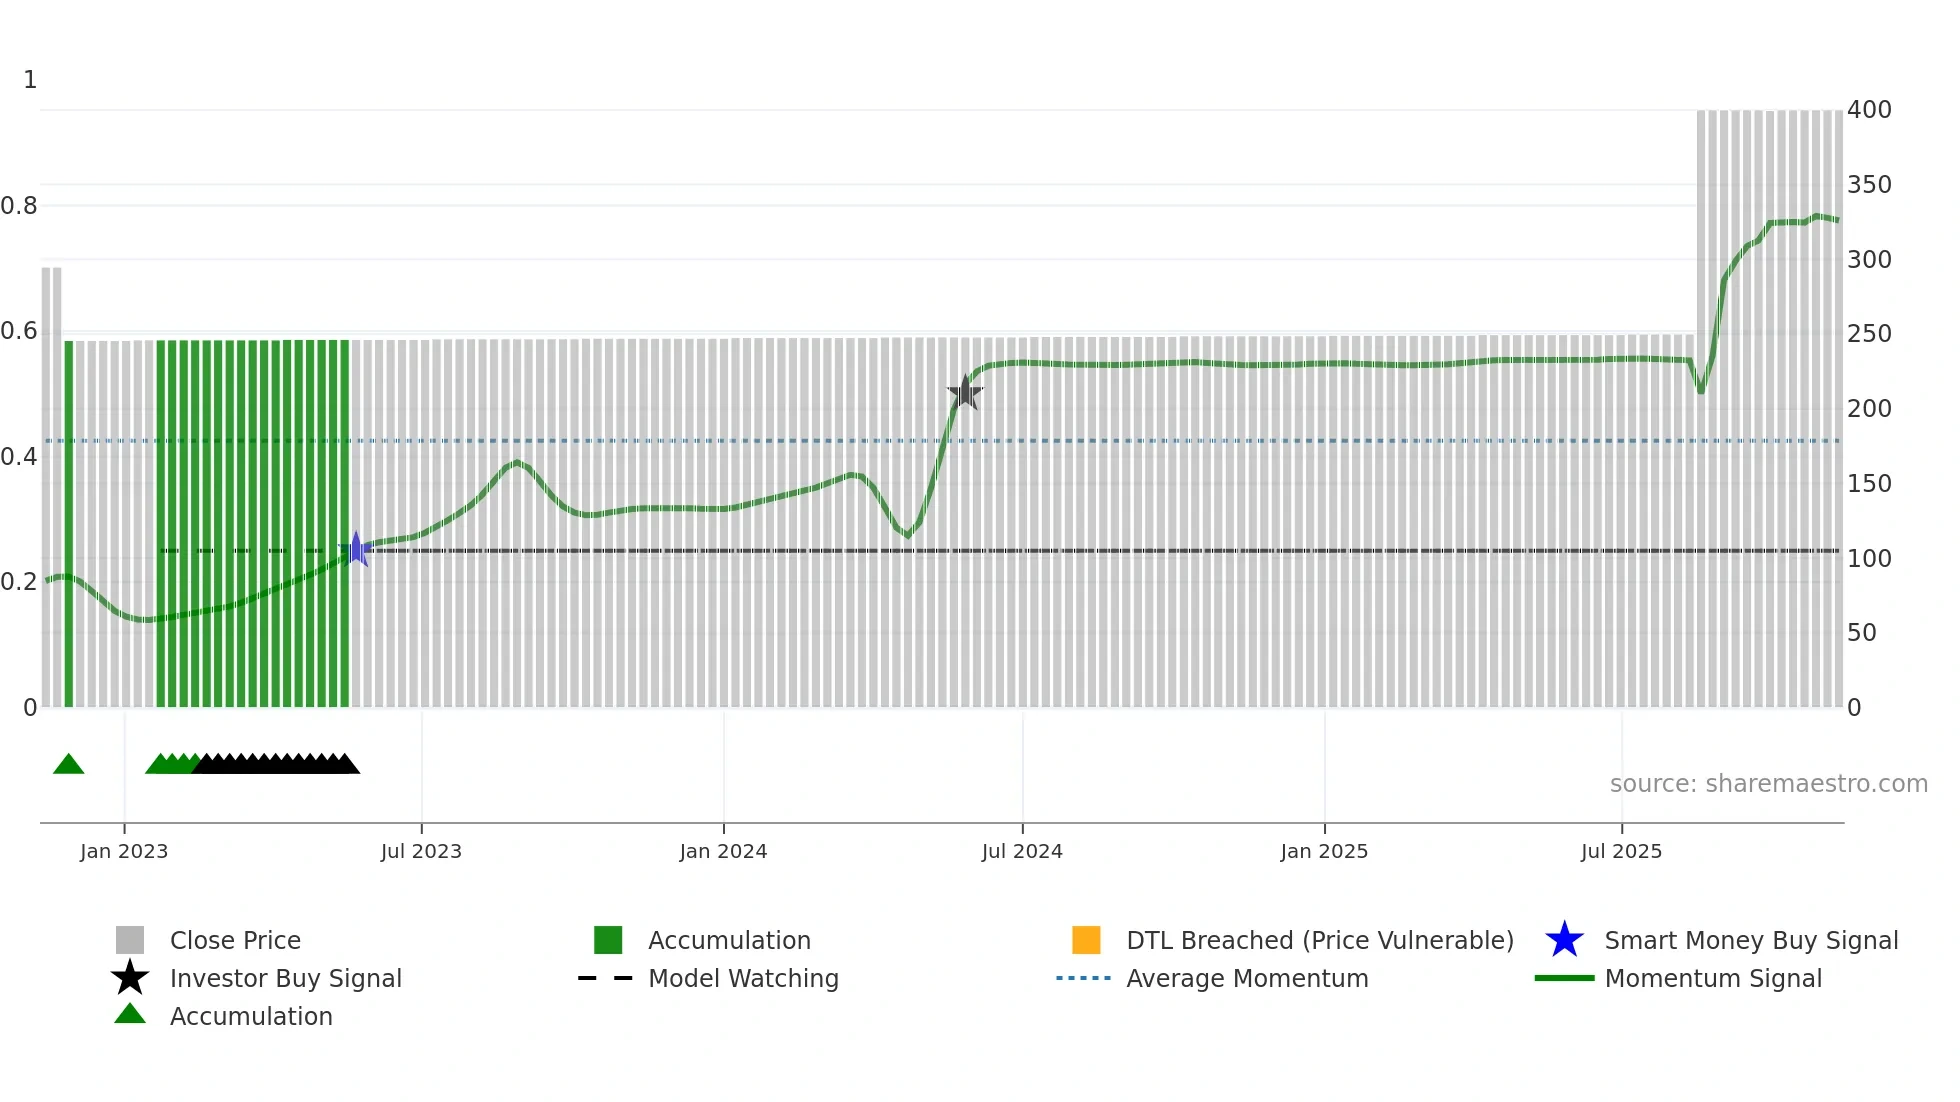
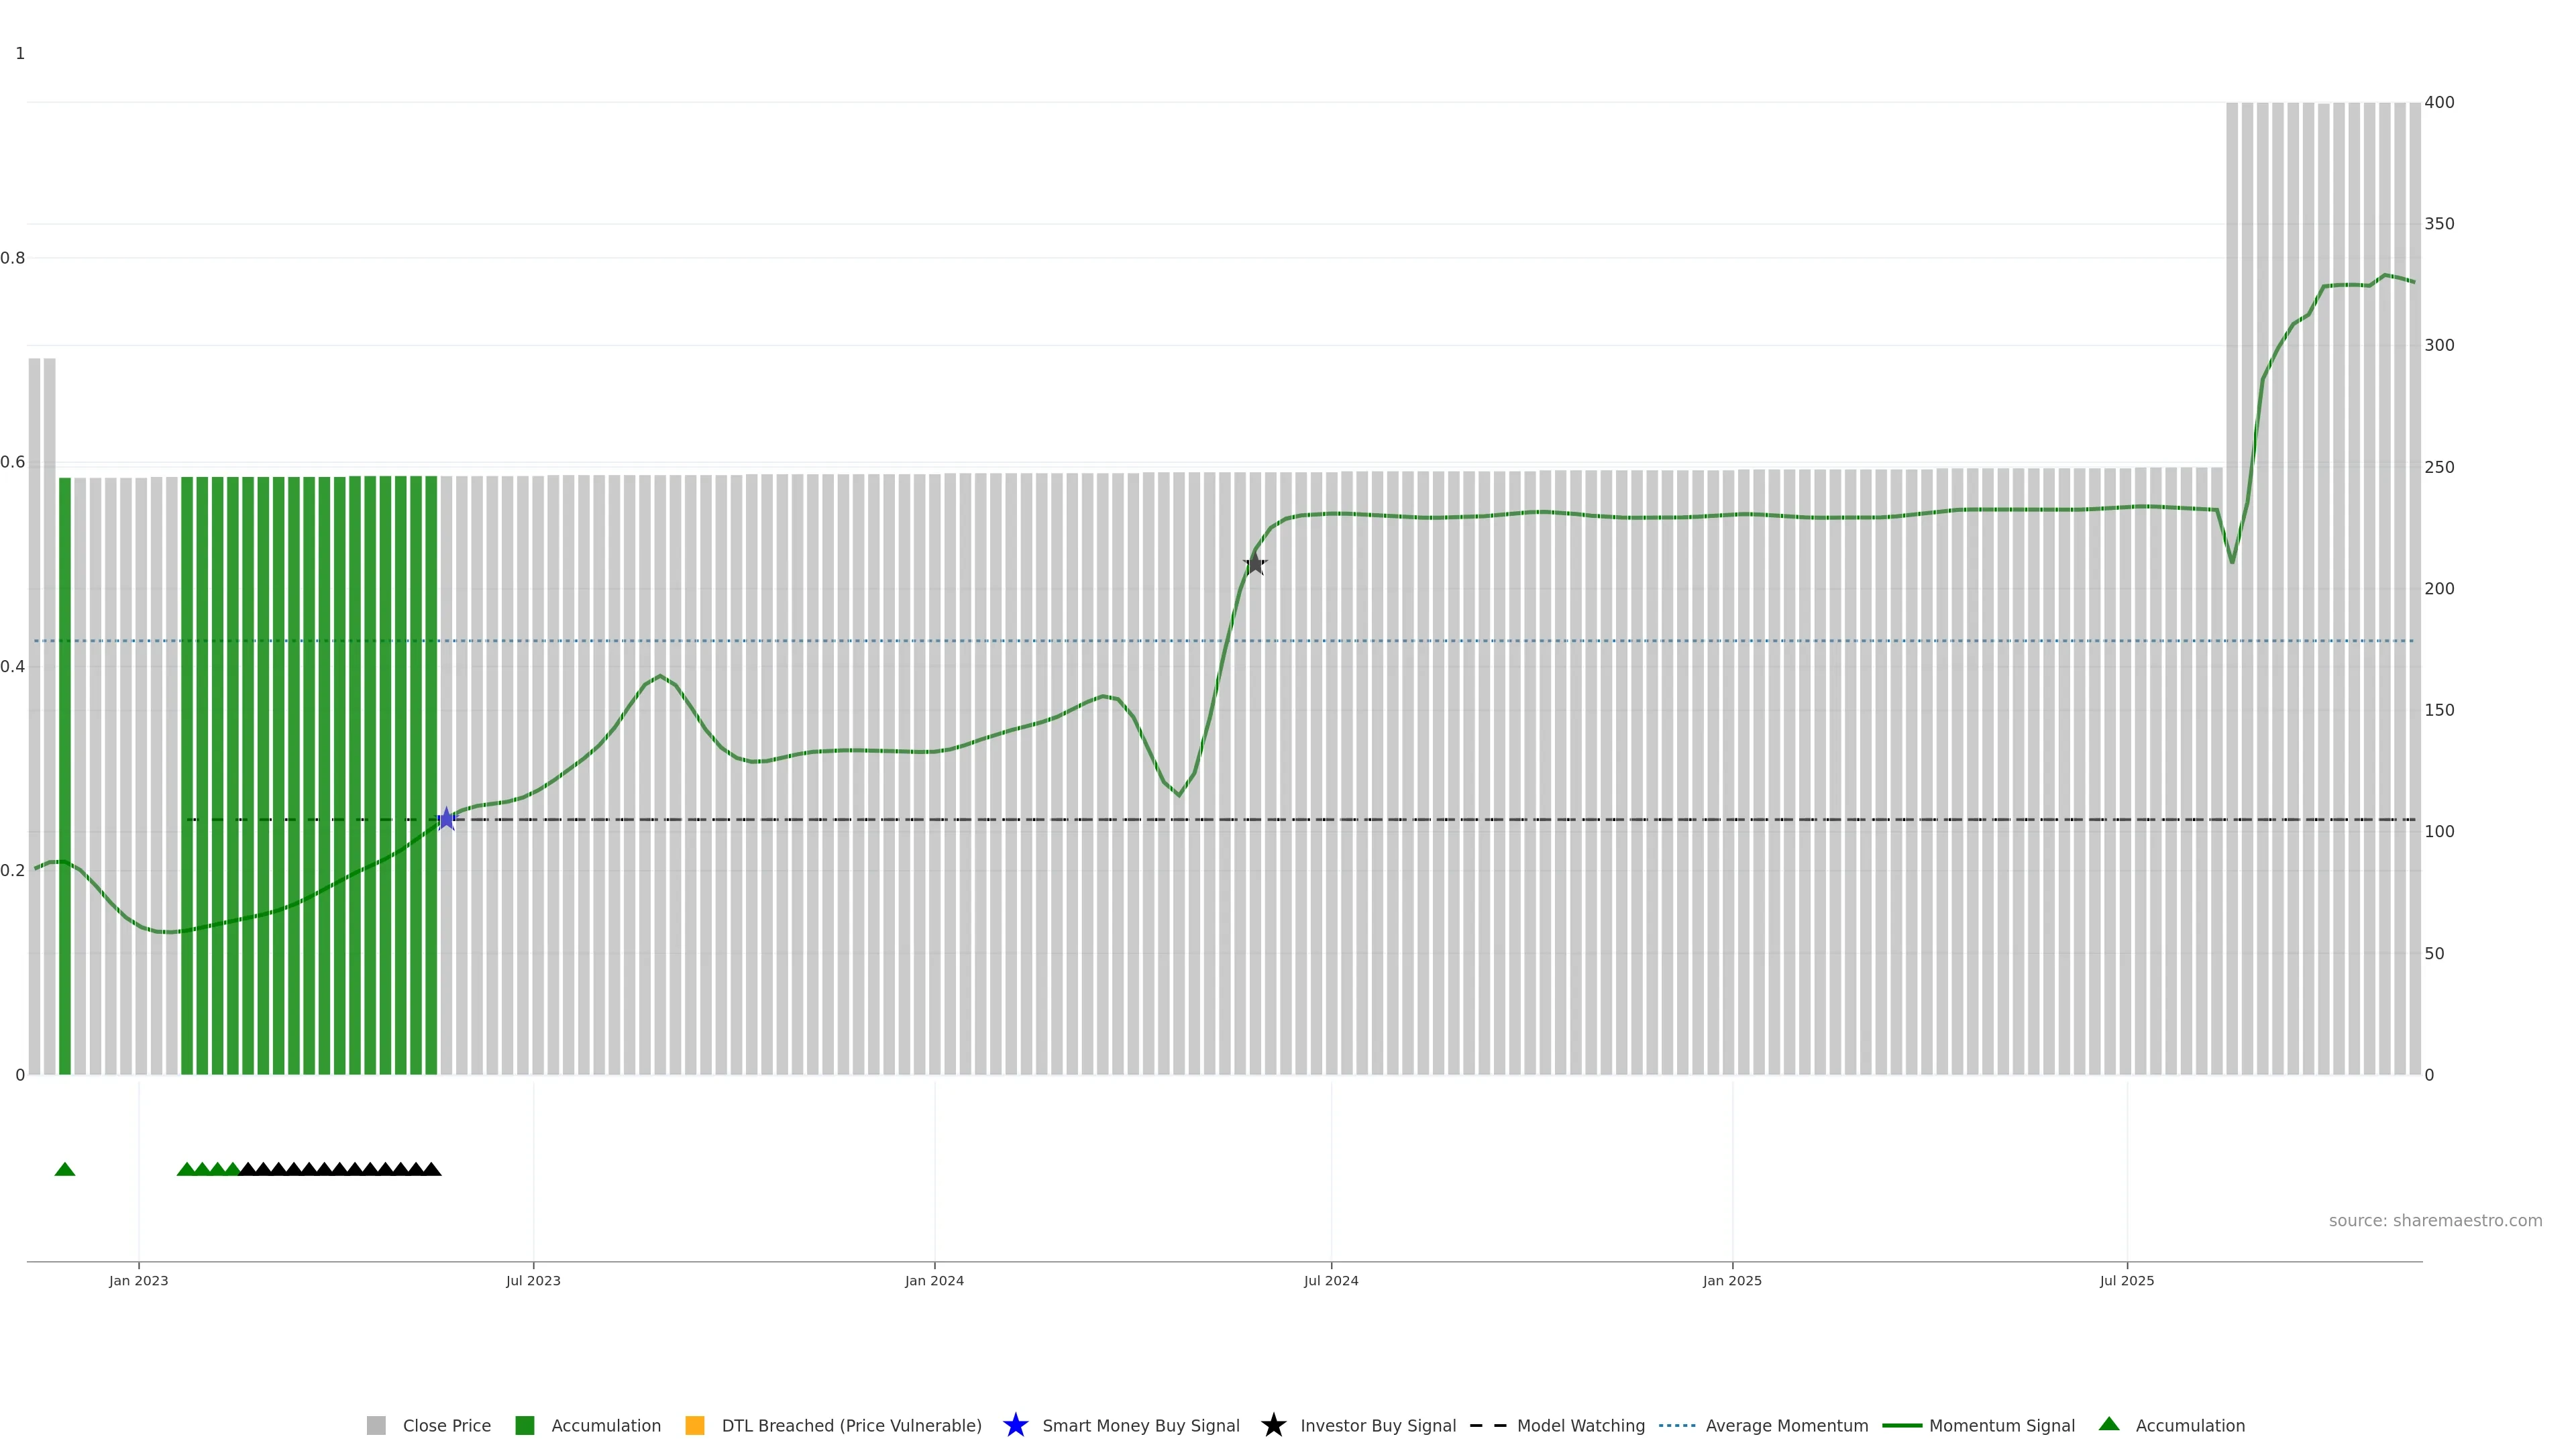
Market Regime (Activity)
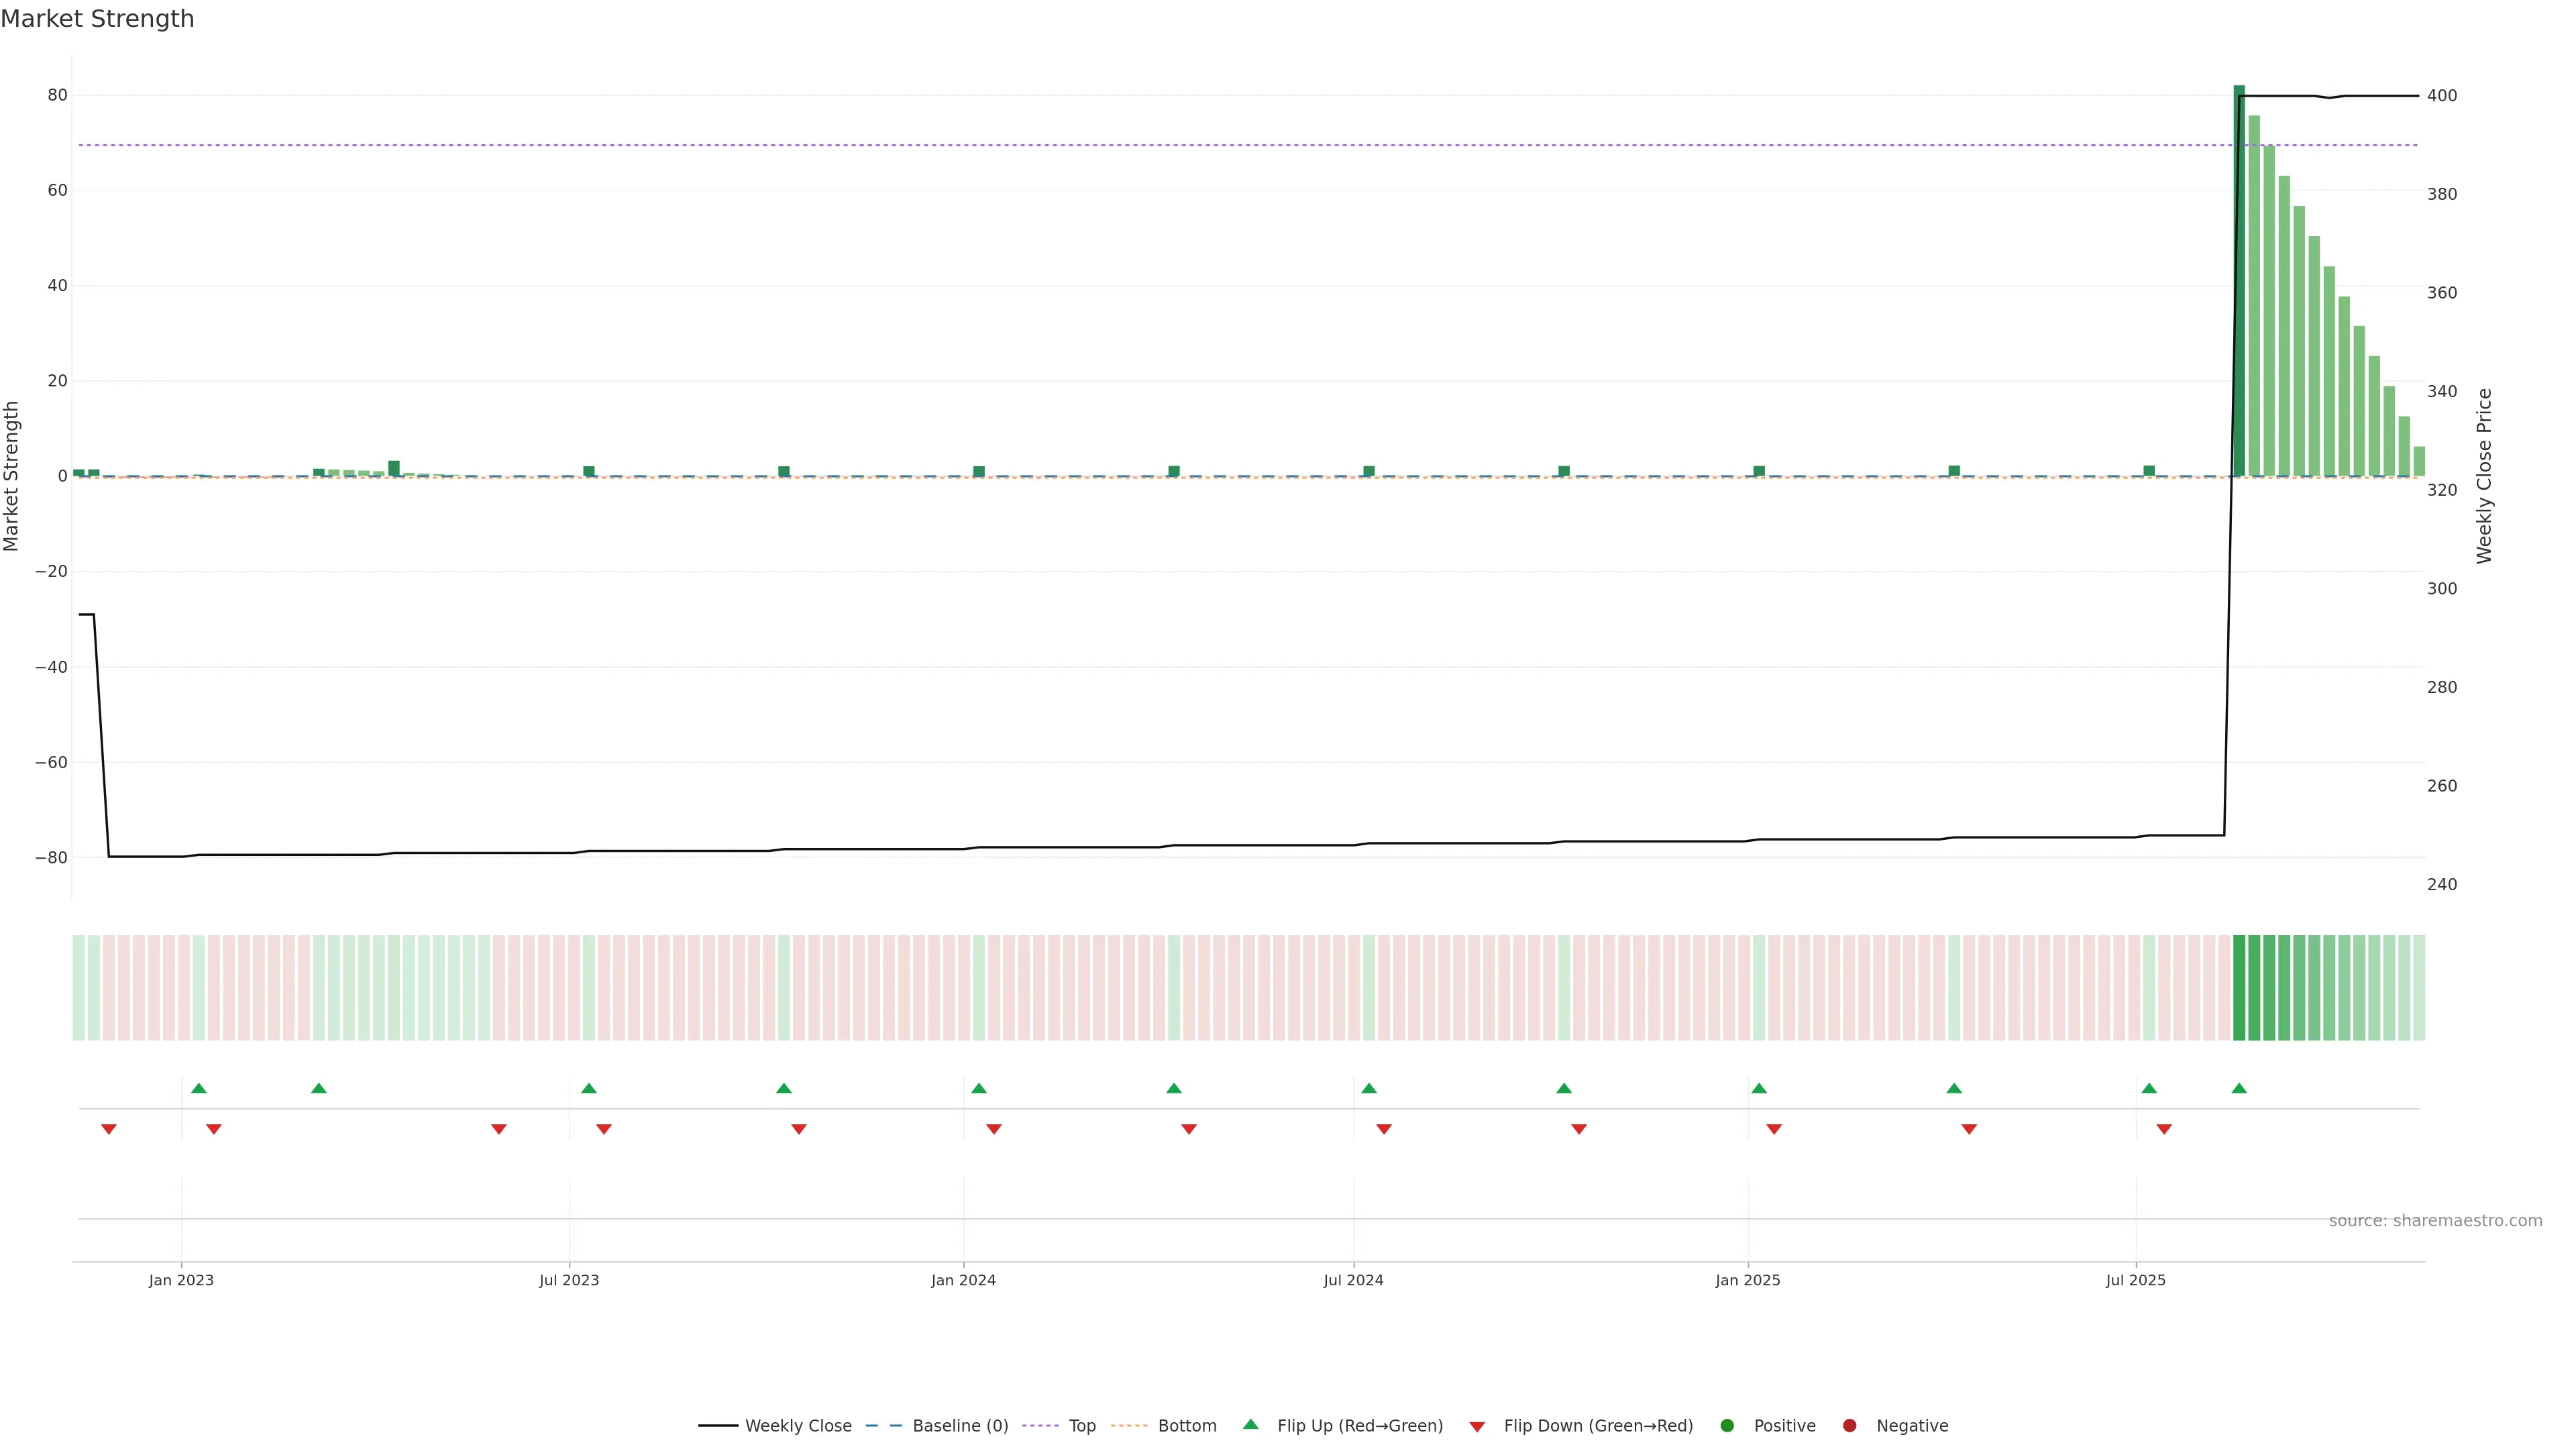
Market activity regime is constructive and improving. — Constructive regimes increase odds of follow-through.
Score 0.5
+1 / -0
Level 0.493
Market activity regime is constructive and improving.
Market activity regime is constructive and improving. Constructive regimes increase odds of follow-through. In essence this reflects activity/volatility regime (constructive vs corrective) with a bullish tilt.
pol 0.5
conf 0.6
moderate · medium
What it means
Market activity regime is constructive and improving. Constructive regimes increase odds of follow-through. In essence this reflects activity/volatility regime (constructive vs corrective) with a bullish tilt.
Implications
Improves odds for follow-through if pullbacks hold higher lows. (pol 0.50, conf 0.60 → moderate/medium)
No additional observations.