Bodhi Tree Multimedia Limited
BTML NSE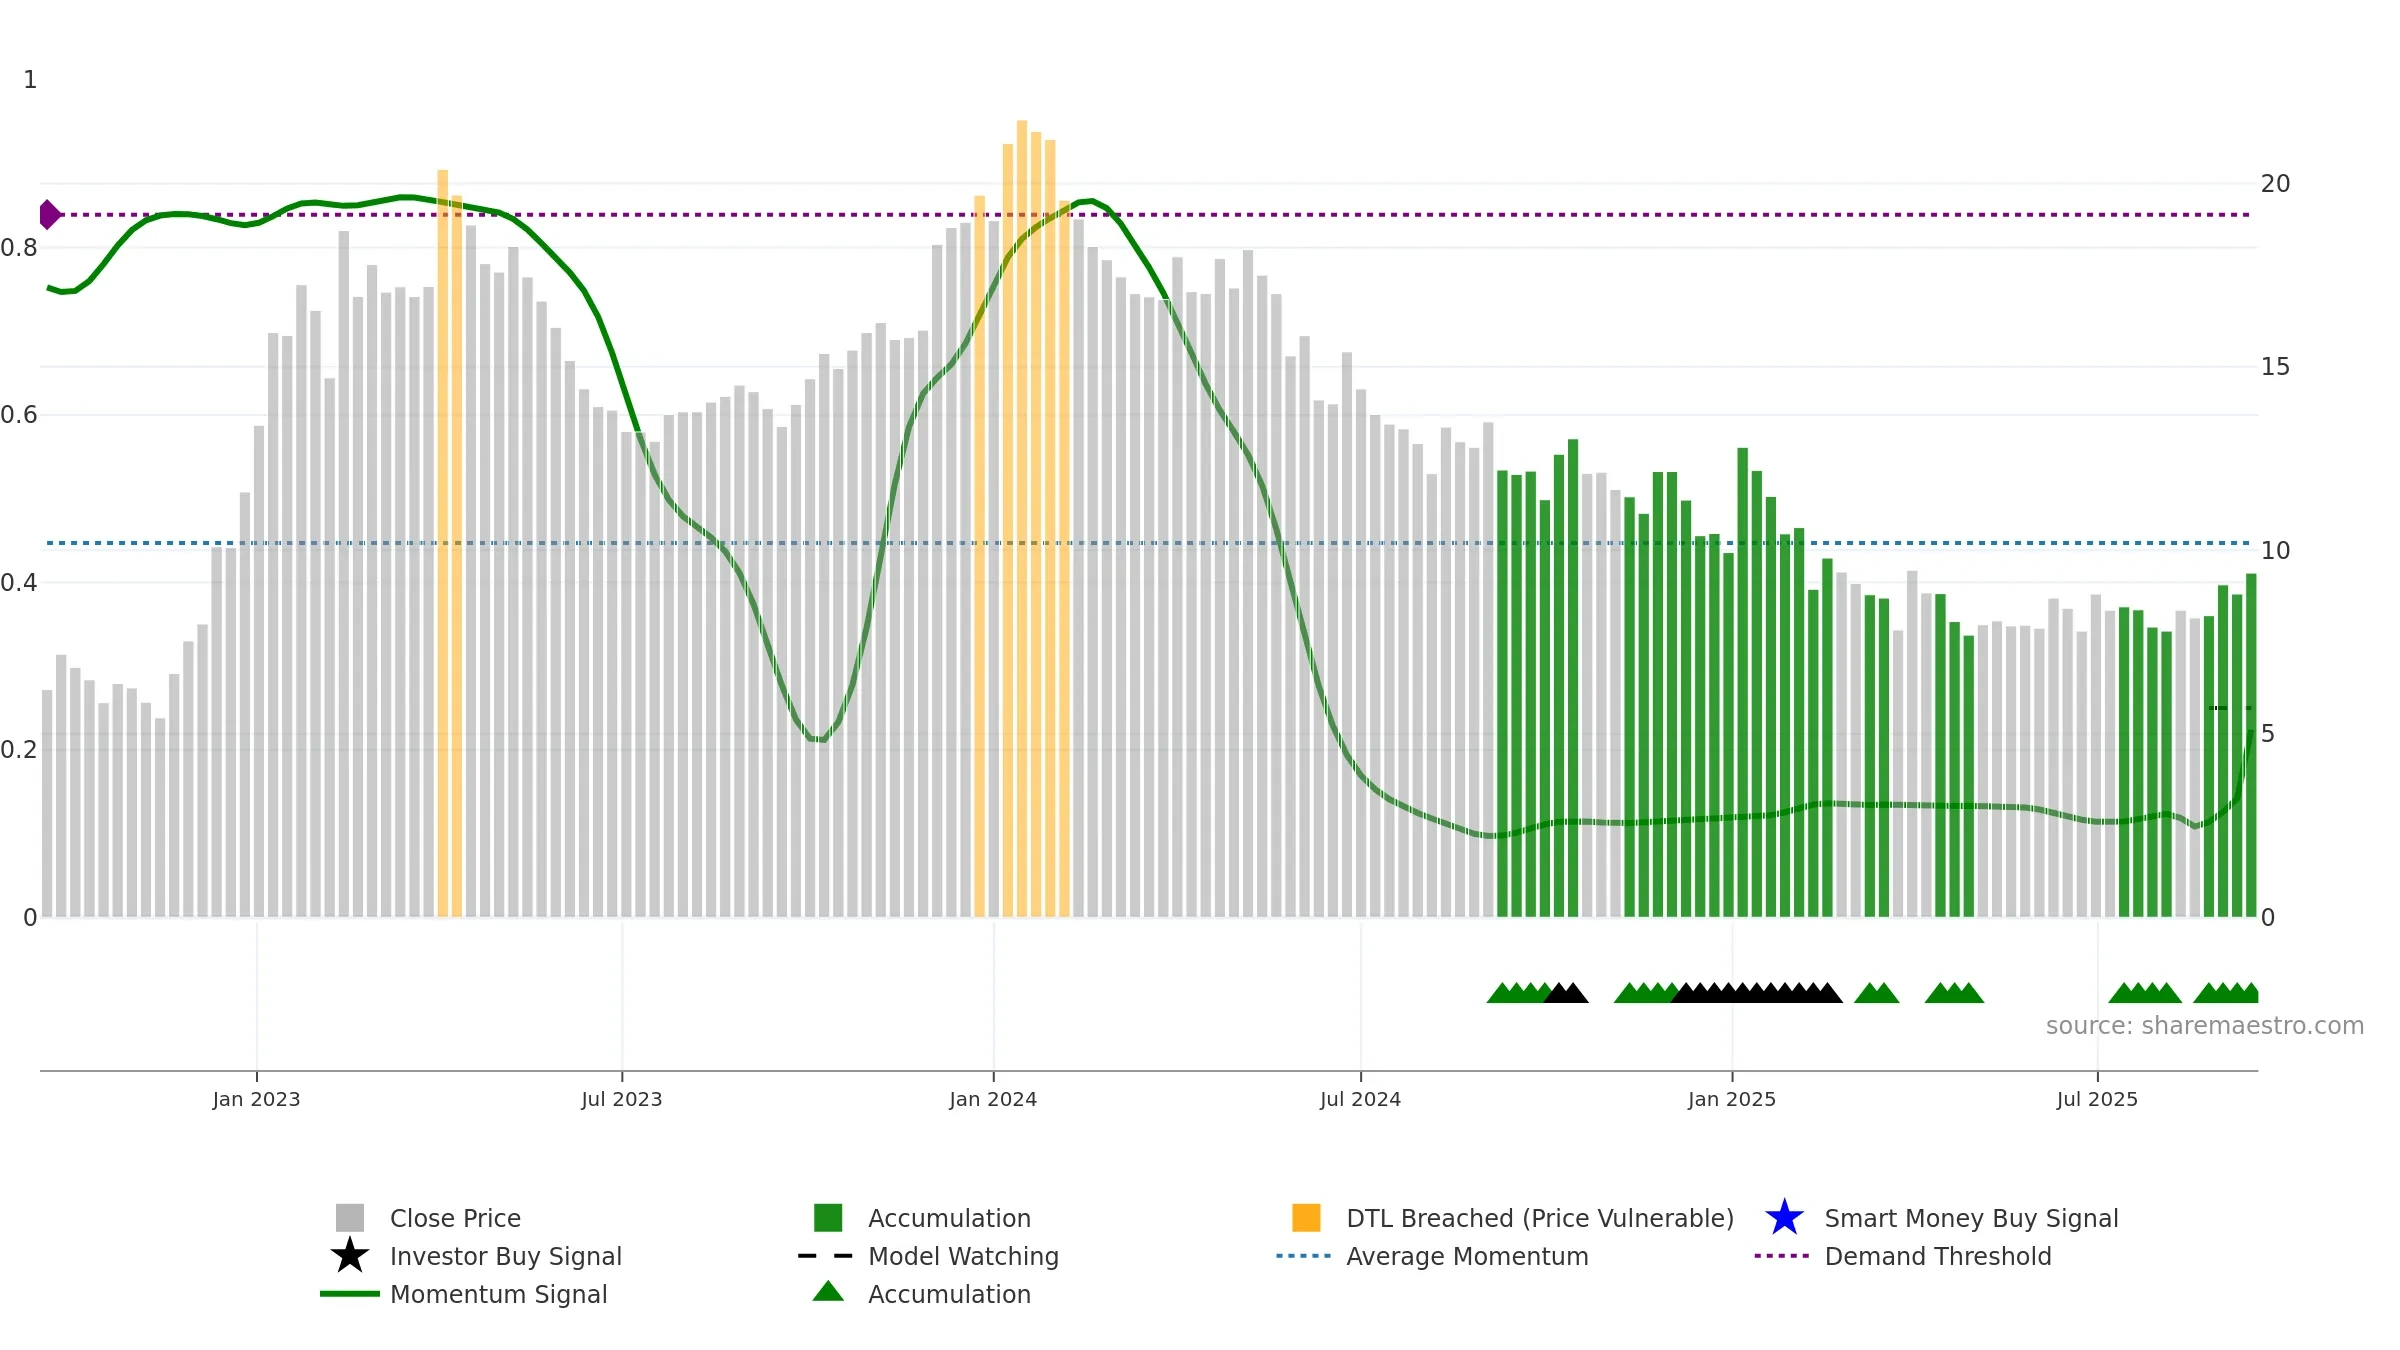
Weekly Report
Bodhi Tree Multimedia Limited closed at 9.3800 (-0.74% WoW) . Data window ends Mon, 15 Sep 2025.
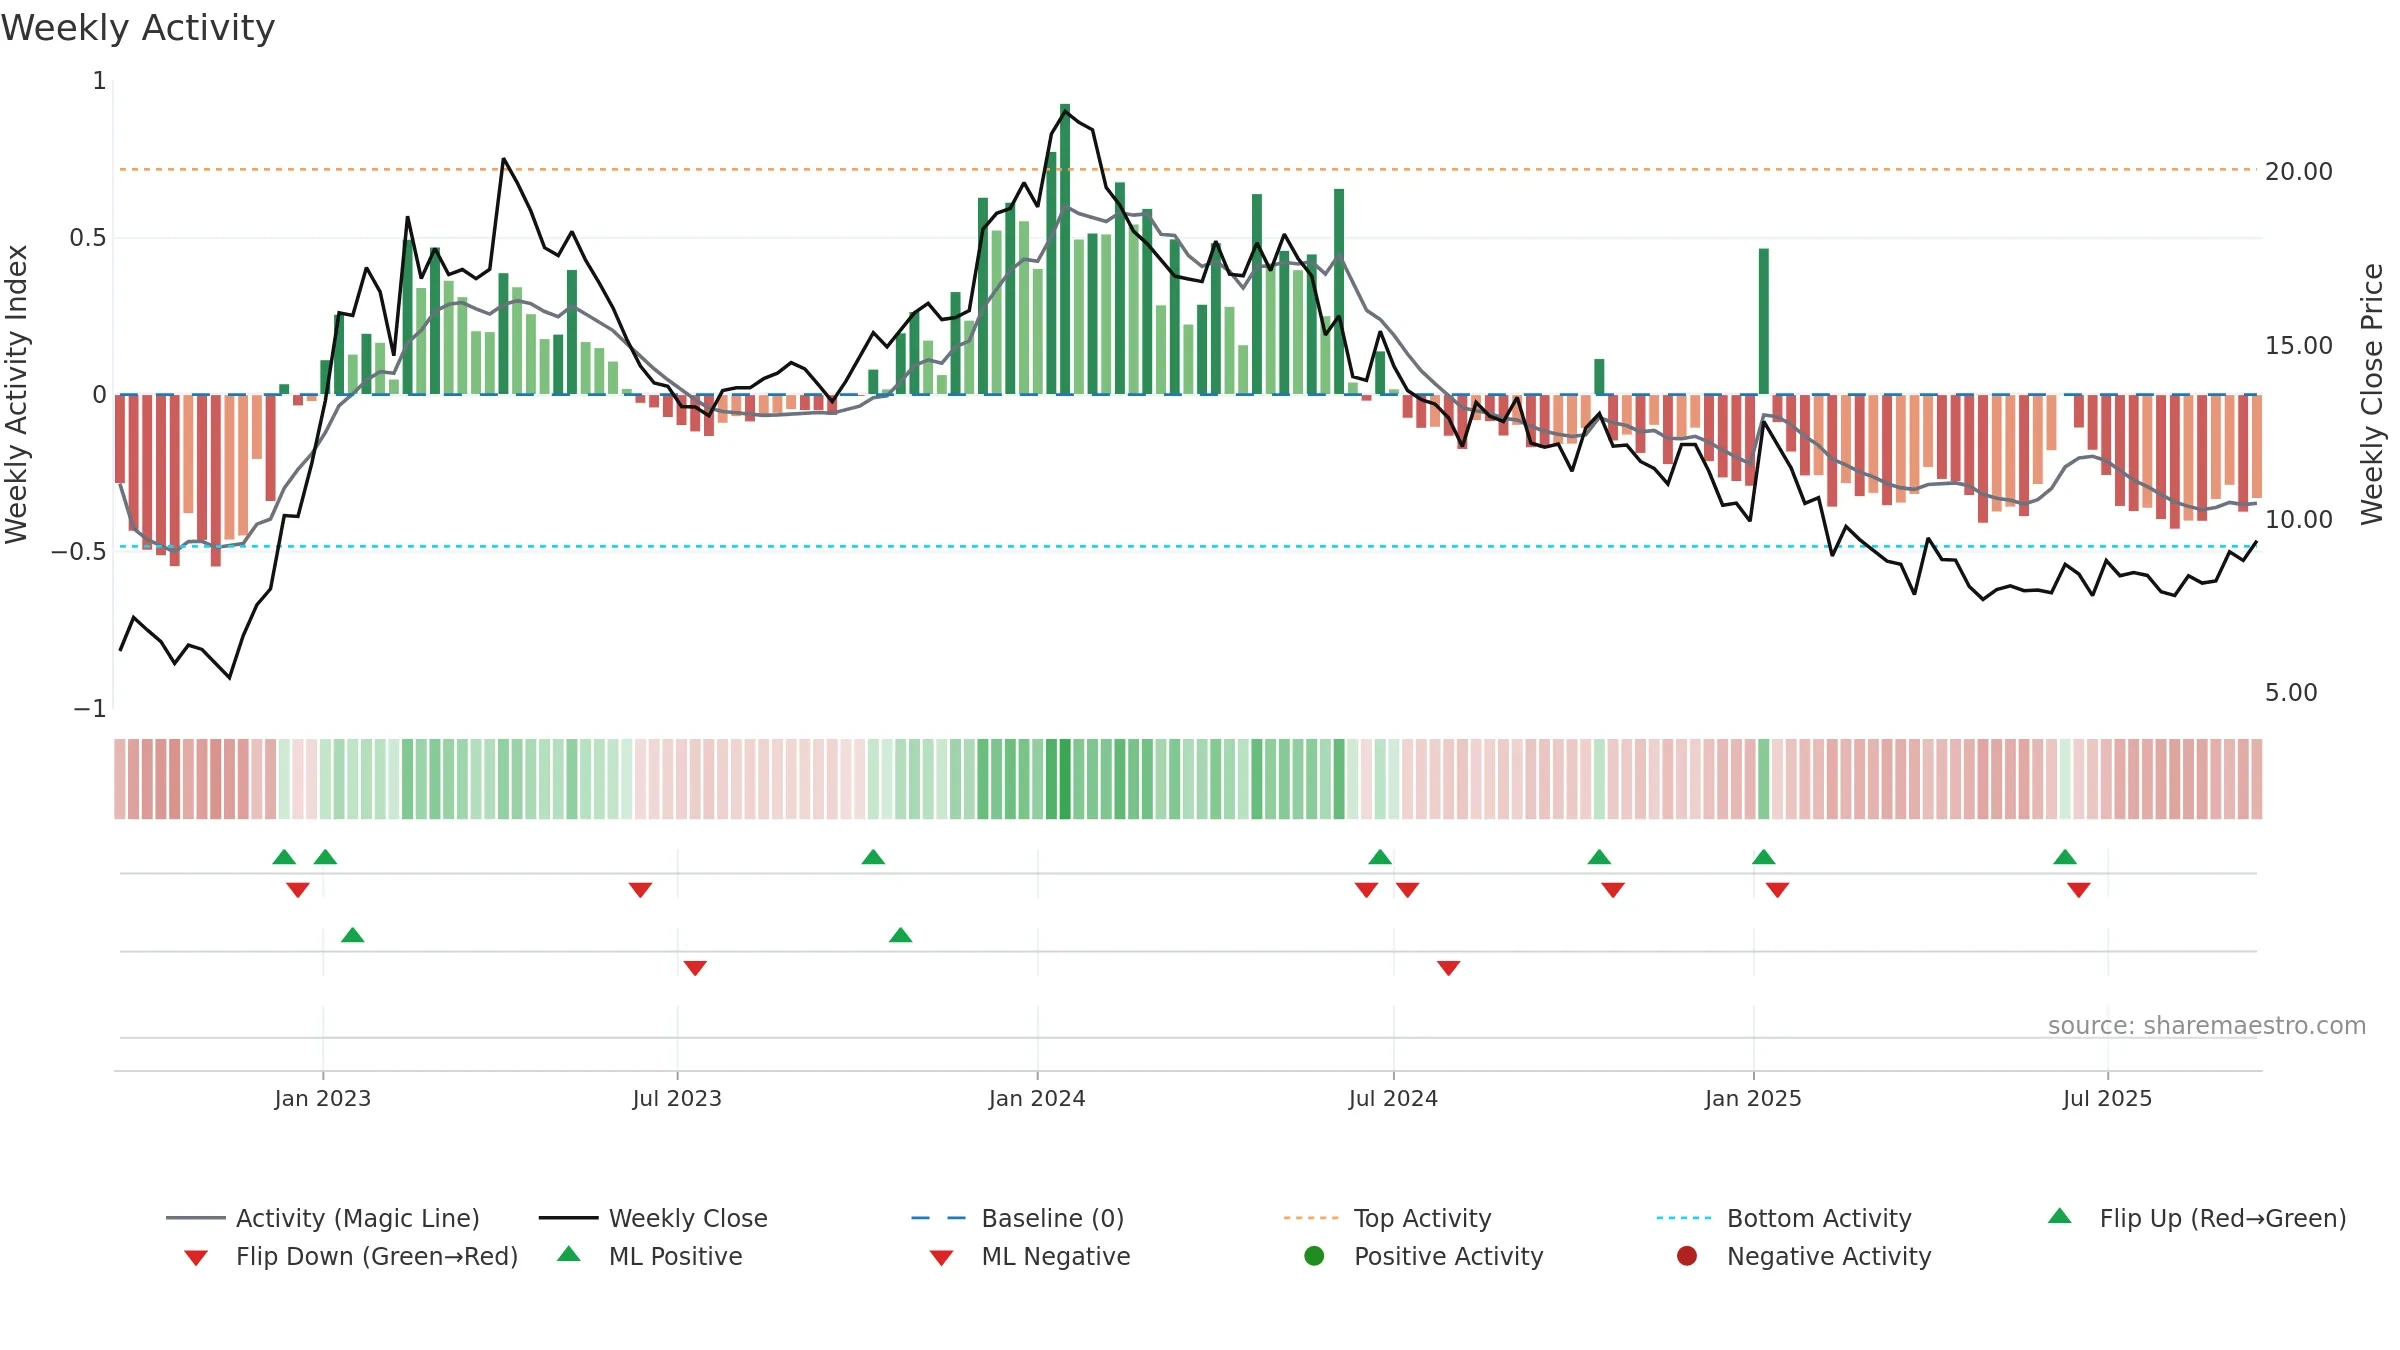
How to read this — Price slope is upward, indicating persistent buying over the window. Elevated weekly volatility increases whipsaw risk. Volume and price are moving in the same direction — a constructive confirmation. Returns are positively correlated with volume — strength tends to arrive on higher activity. Distance to baseline is narrowing — reverting closer to its fair-value track. Constructive MA stack supports the up-drift; pullbacks may find support at the 8–13 week region. Price holds above key averages, indicating constructive participation.
Up-slope supports buying interest; pullbacks may be contained if activity stays firm.
Gauge maps the trend signal to a 0–100 scale.
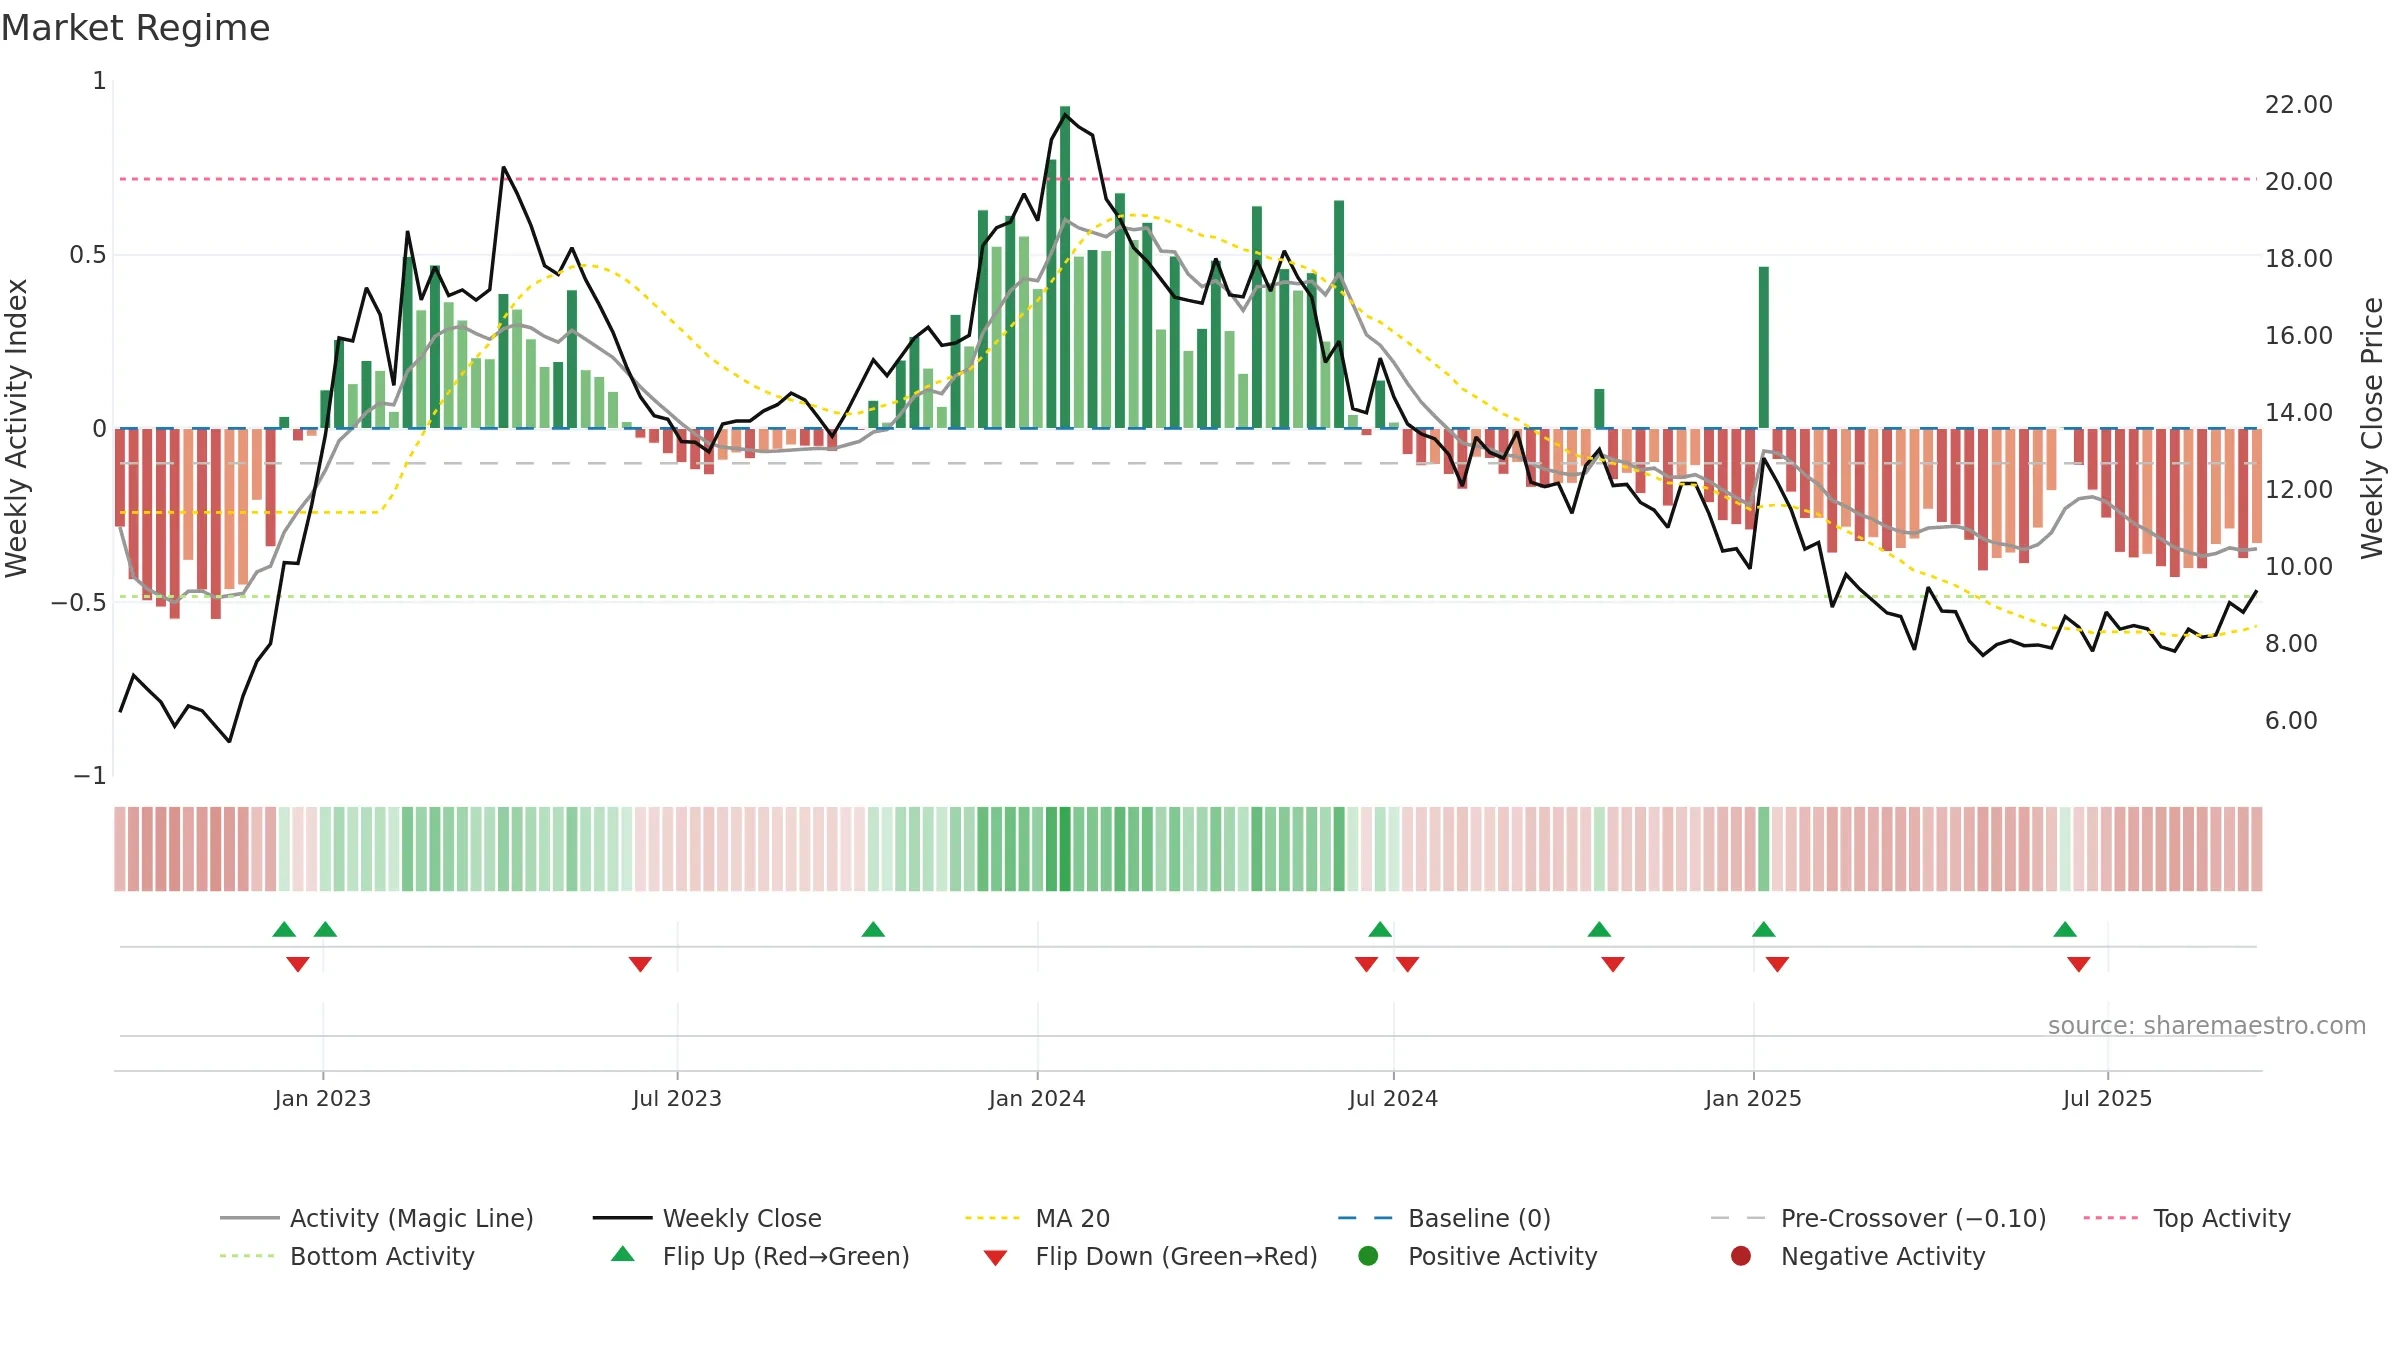
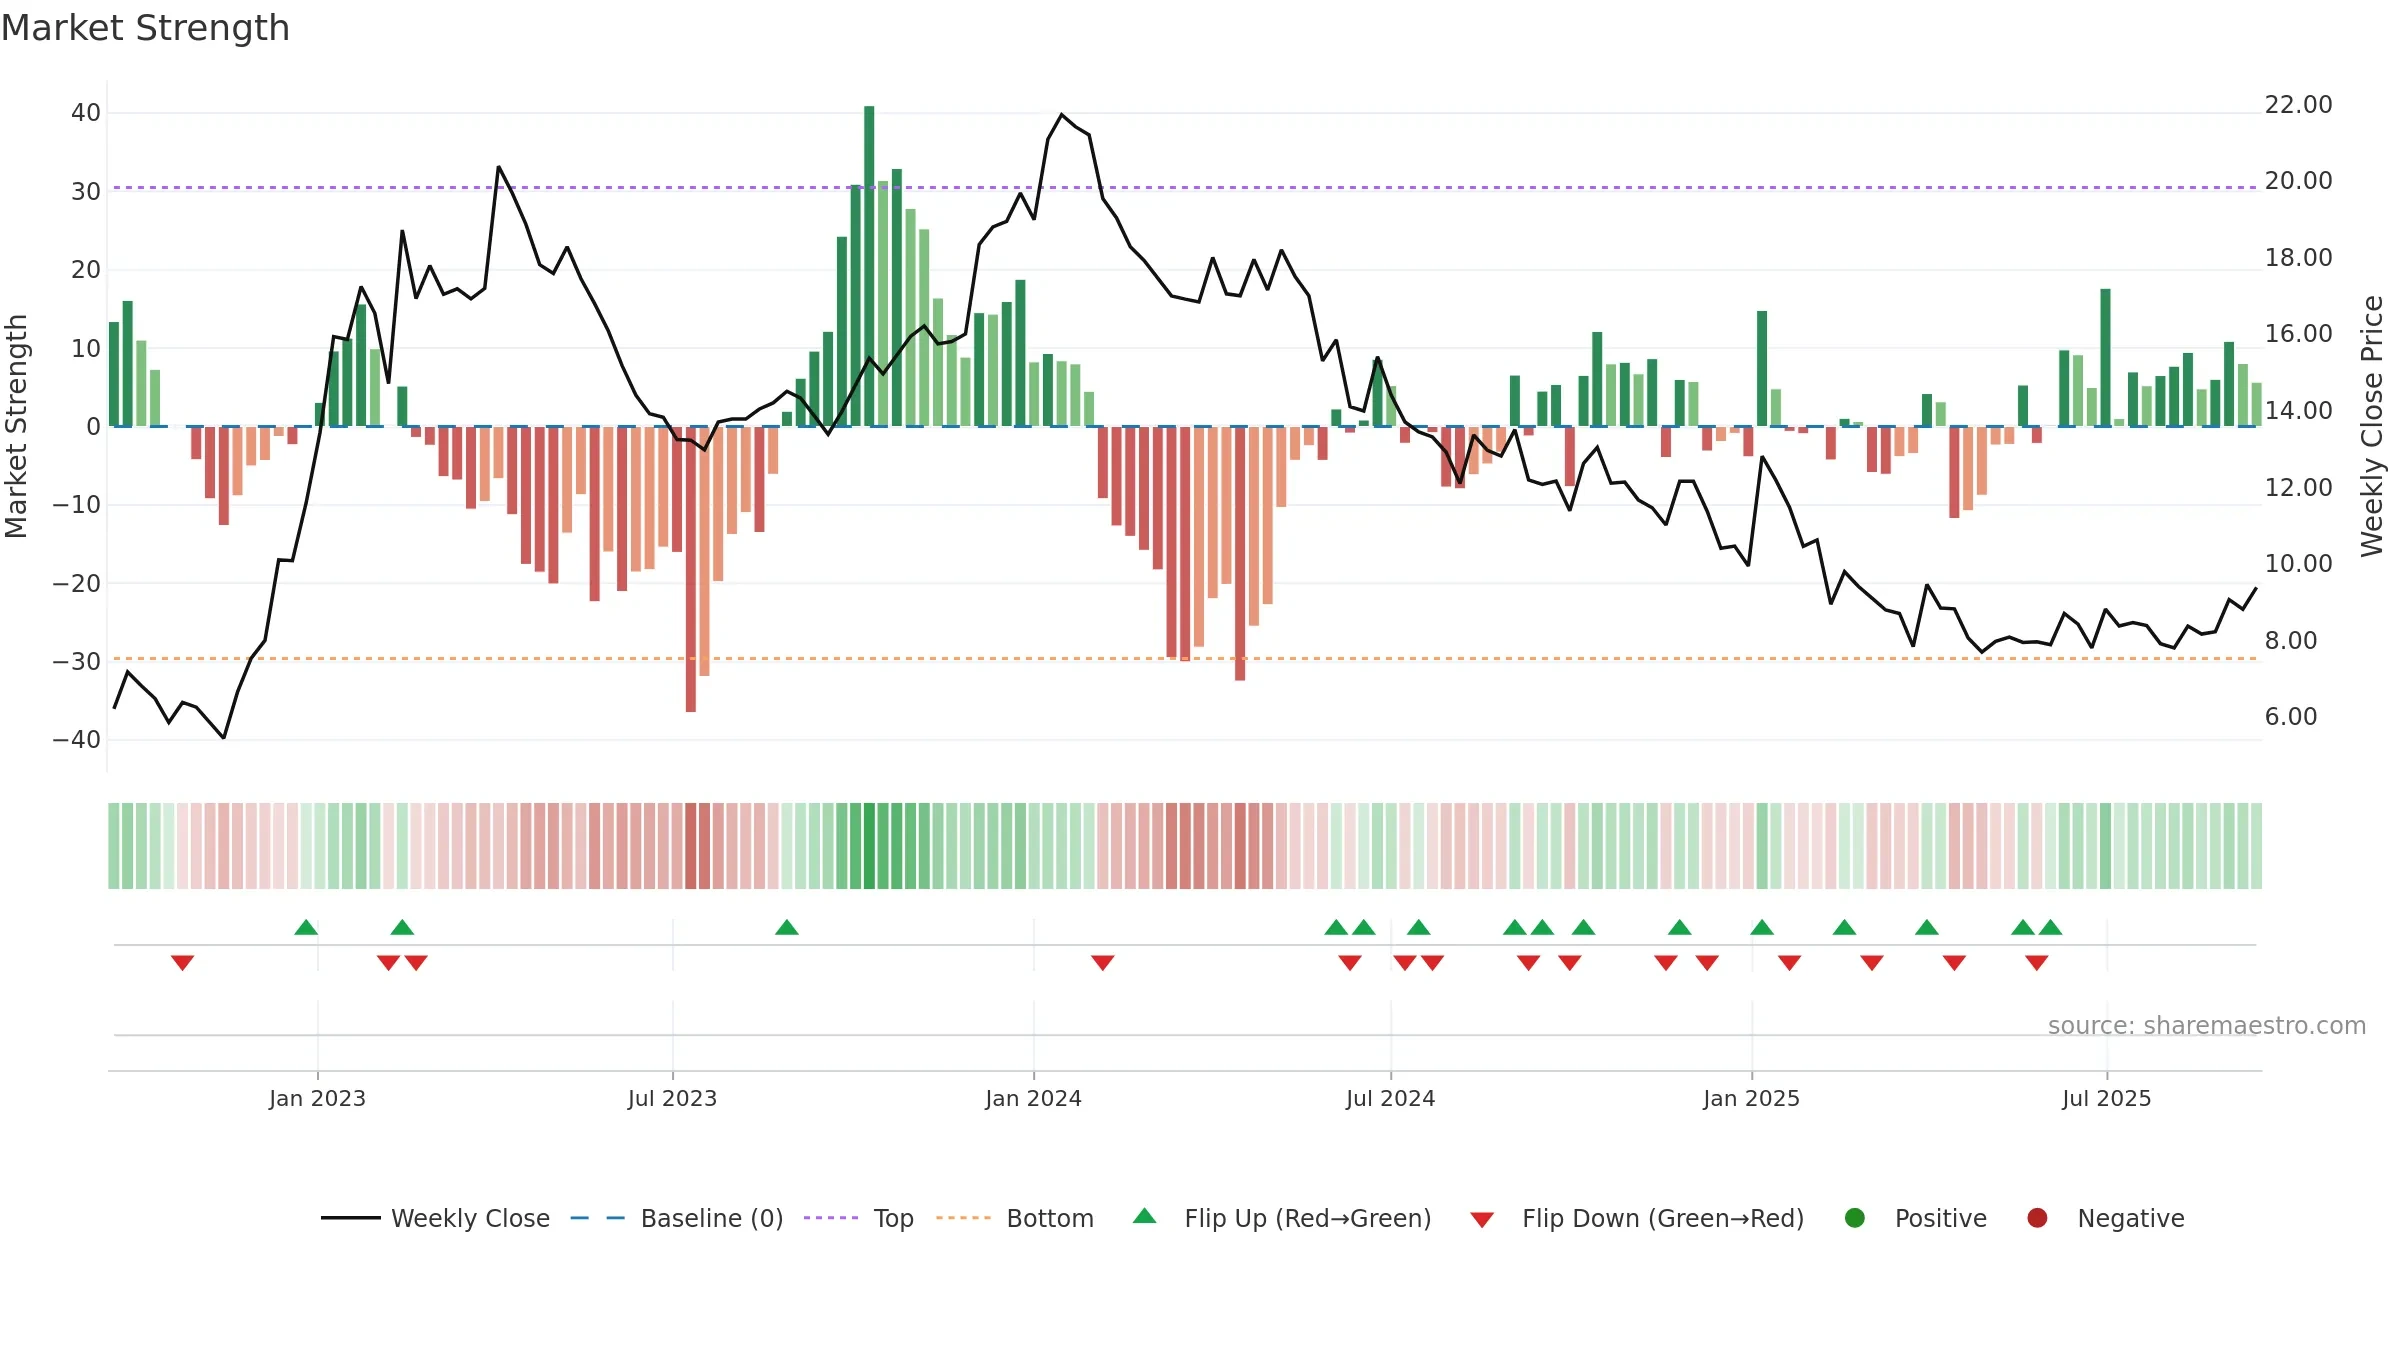
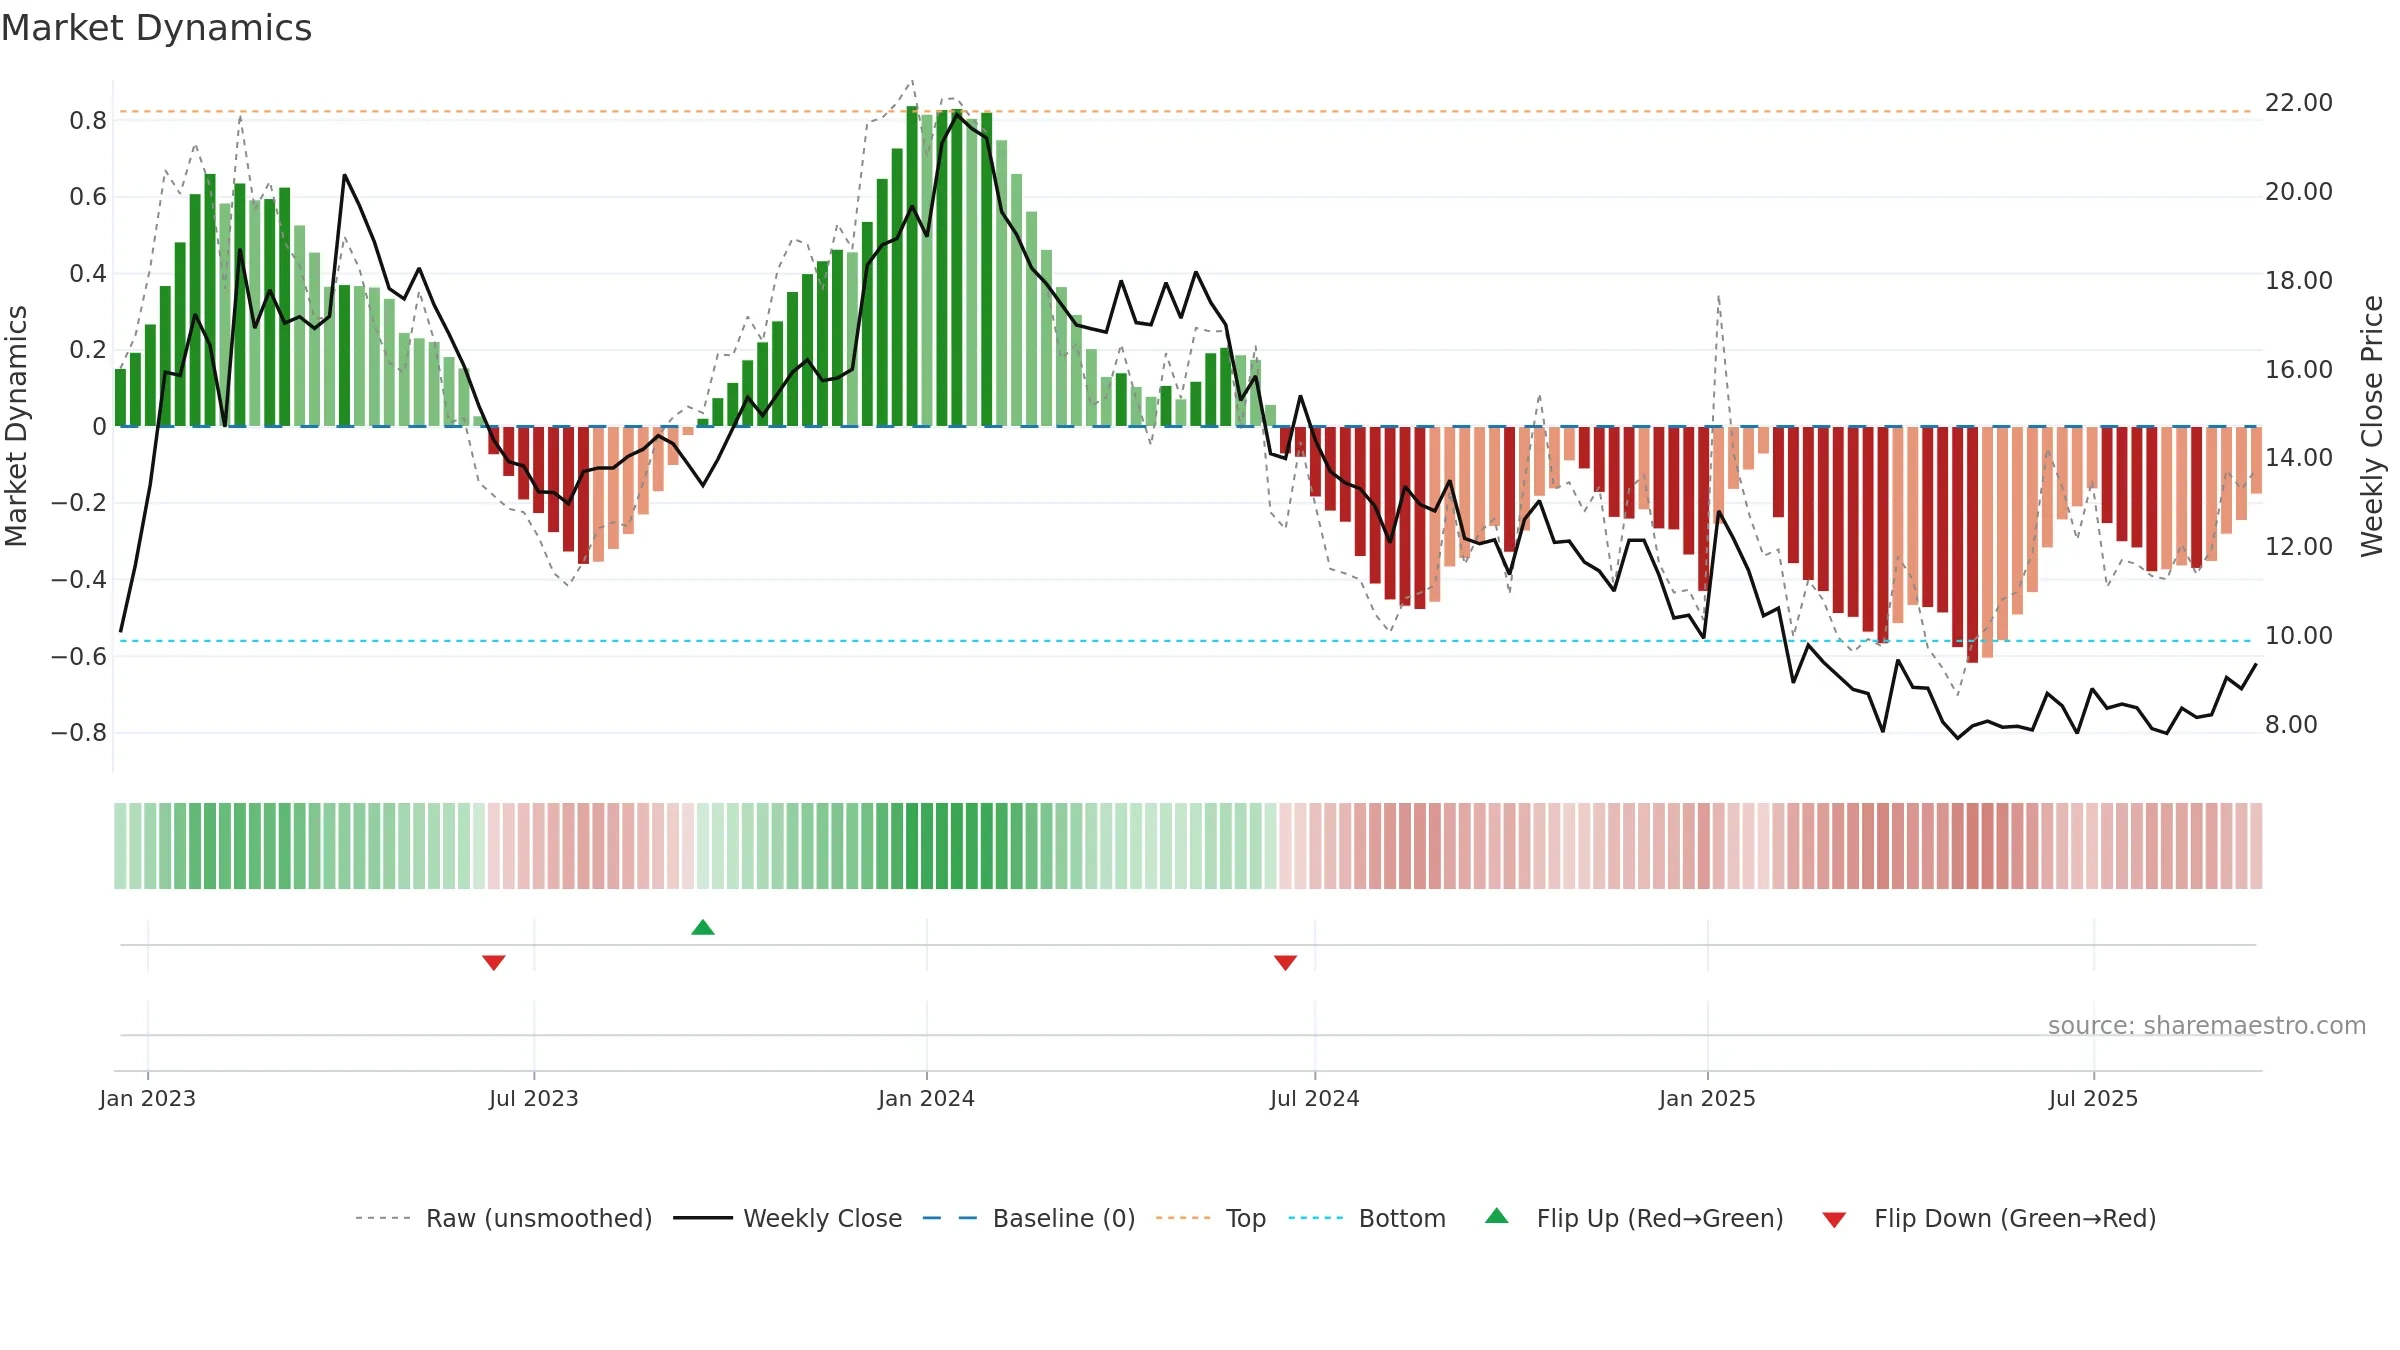
How to read this — Bearish backdrop but short-term momentum is improving; confirmation still needed.
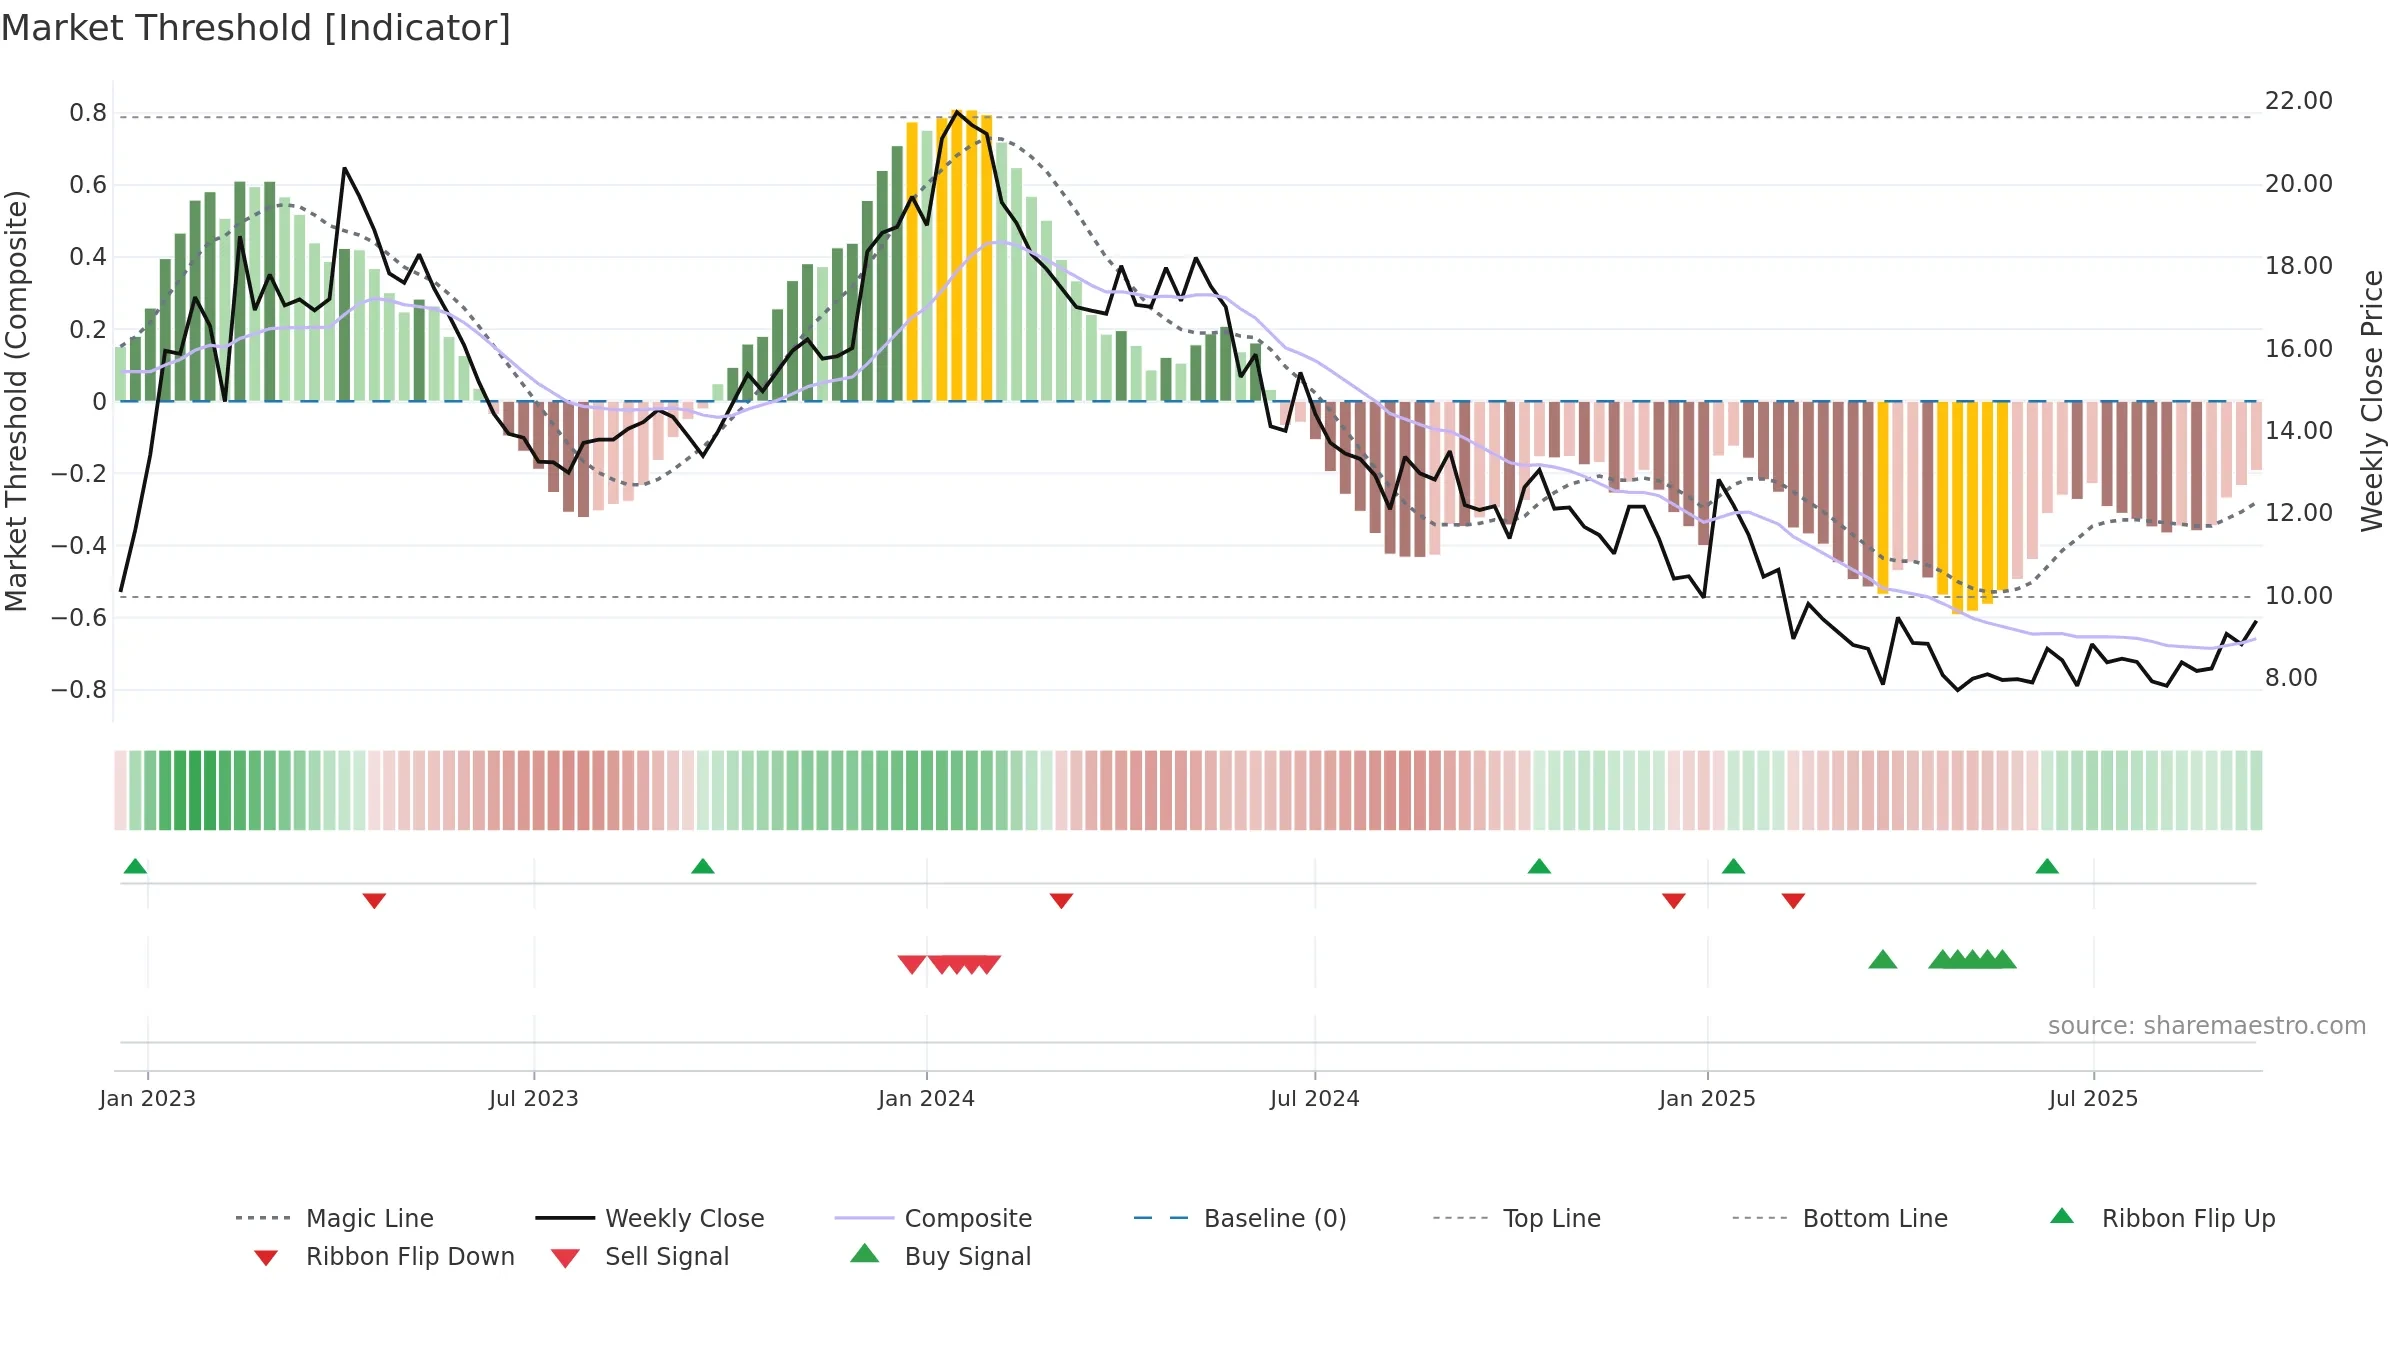
Early improvement — look for a reclaim of 0.50→0.60 to validate.
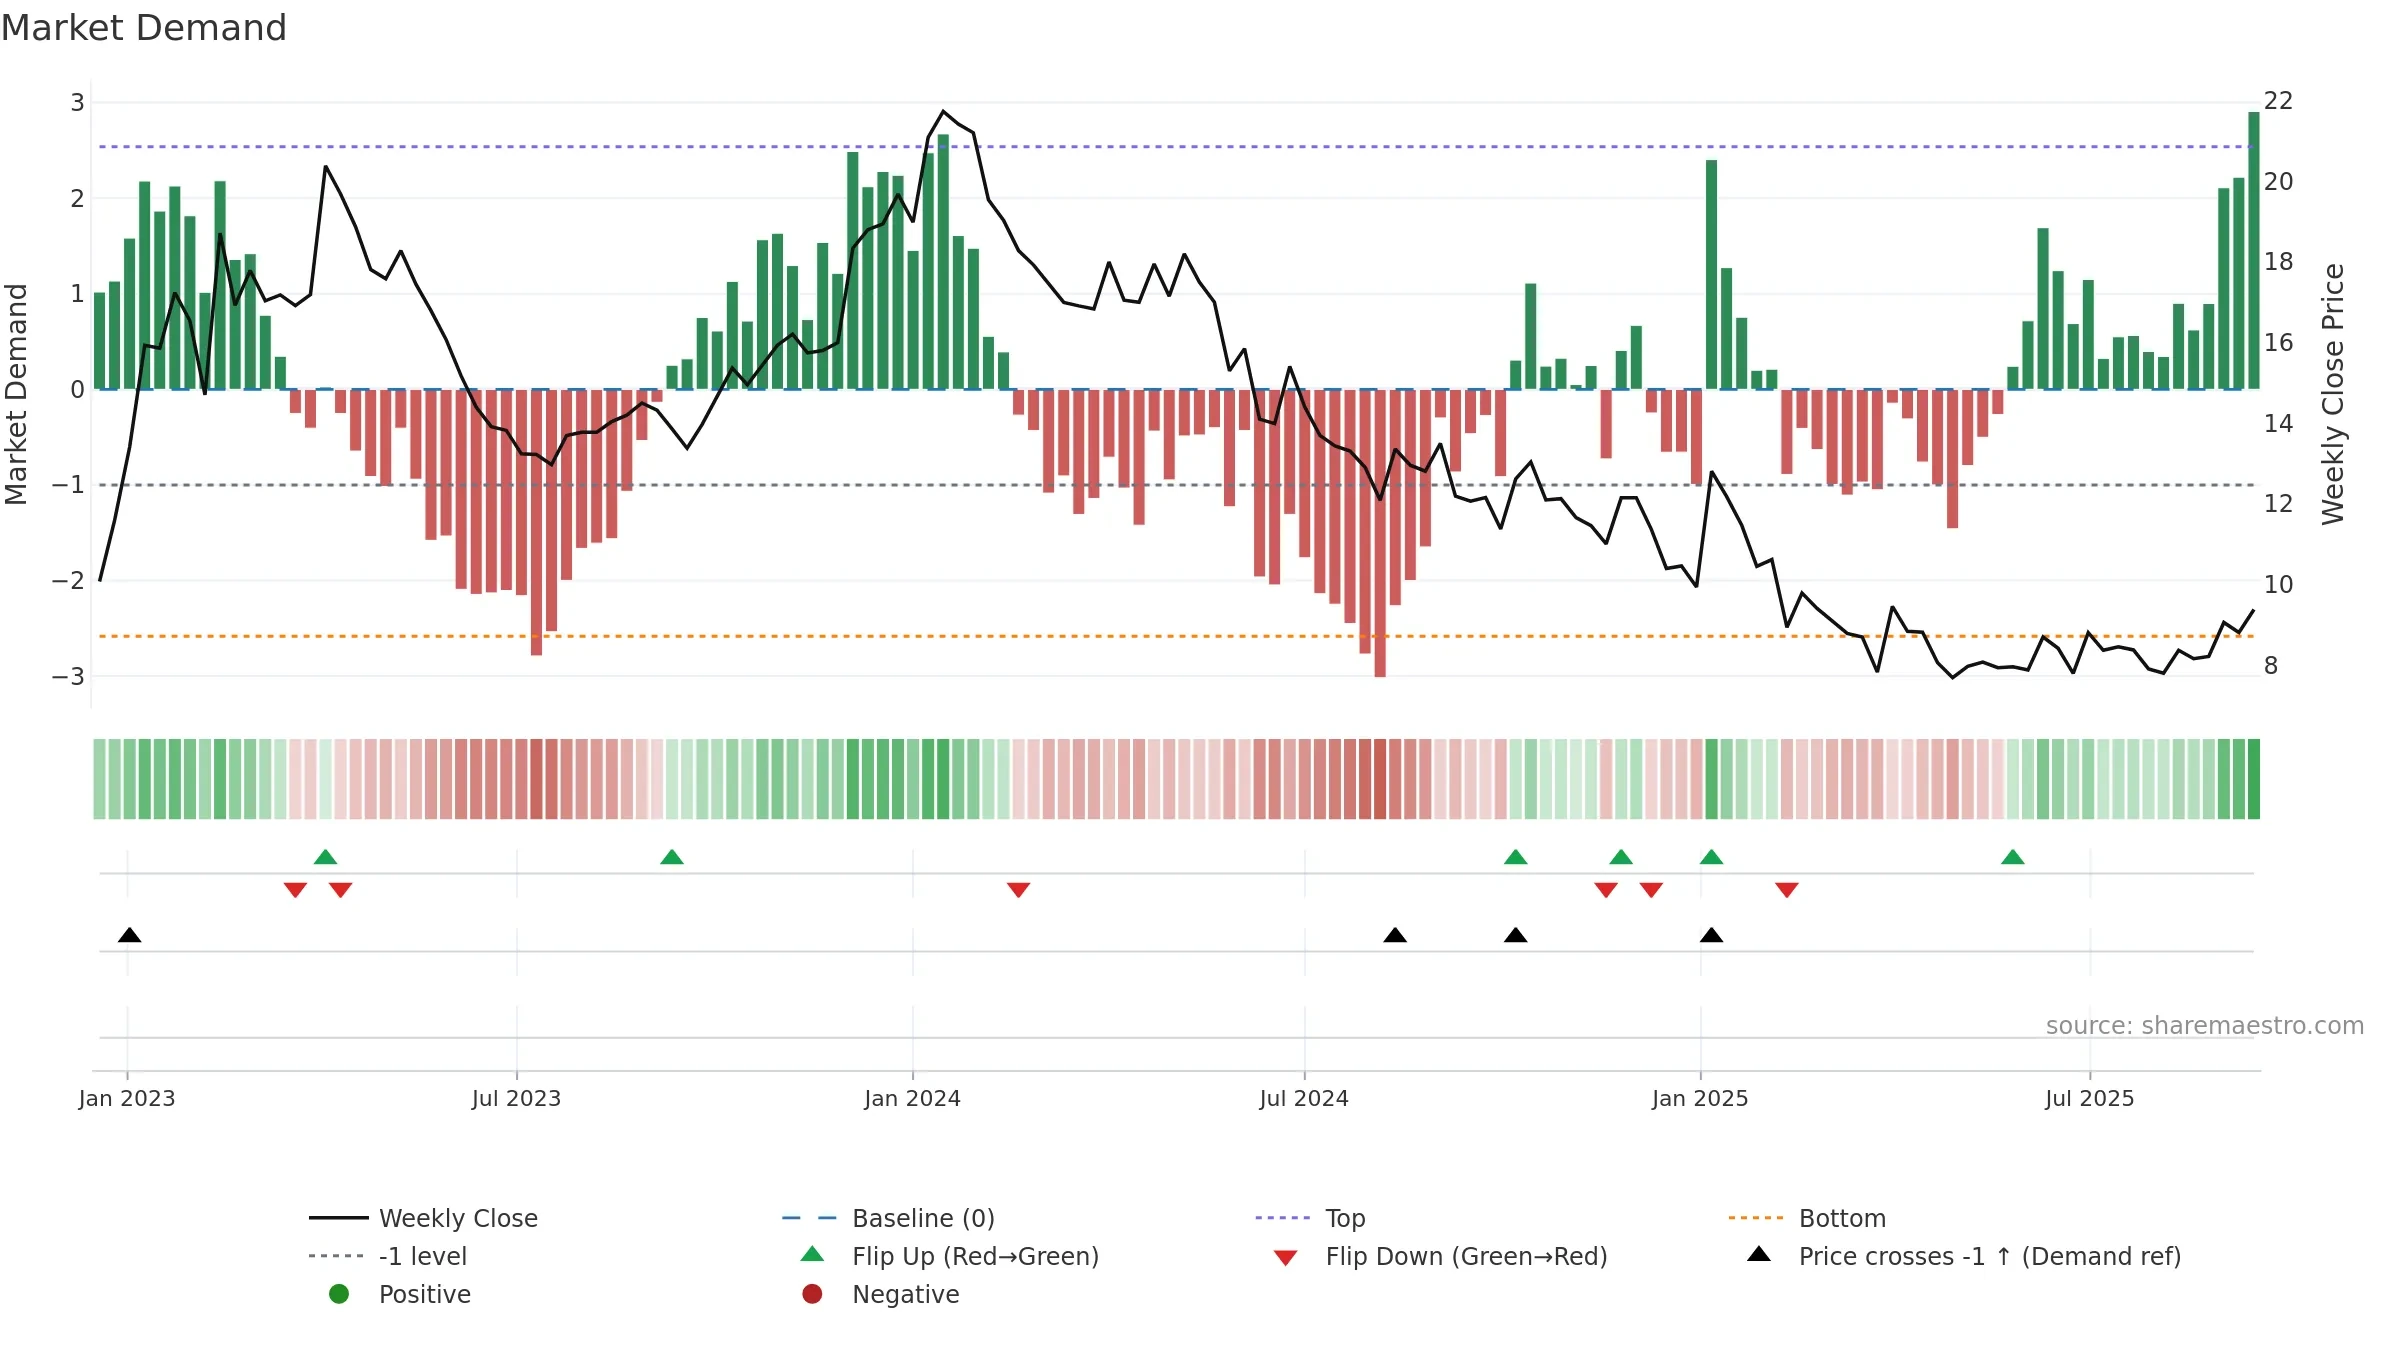
Price is above fair value; upside may be capped without catalysts.
Conclusion
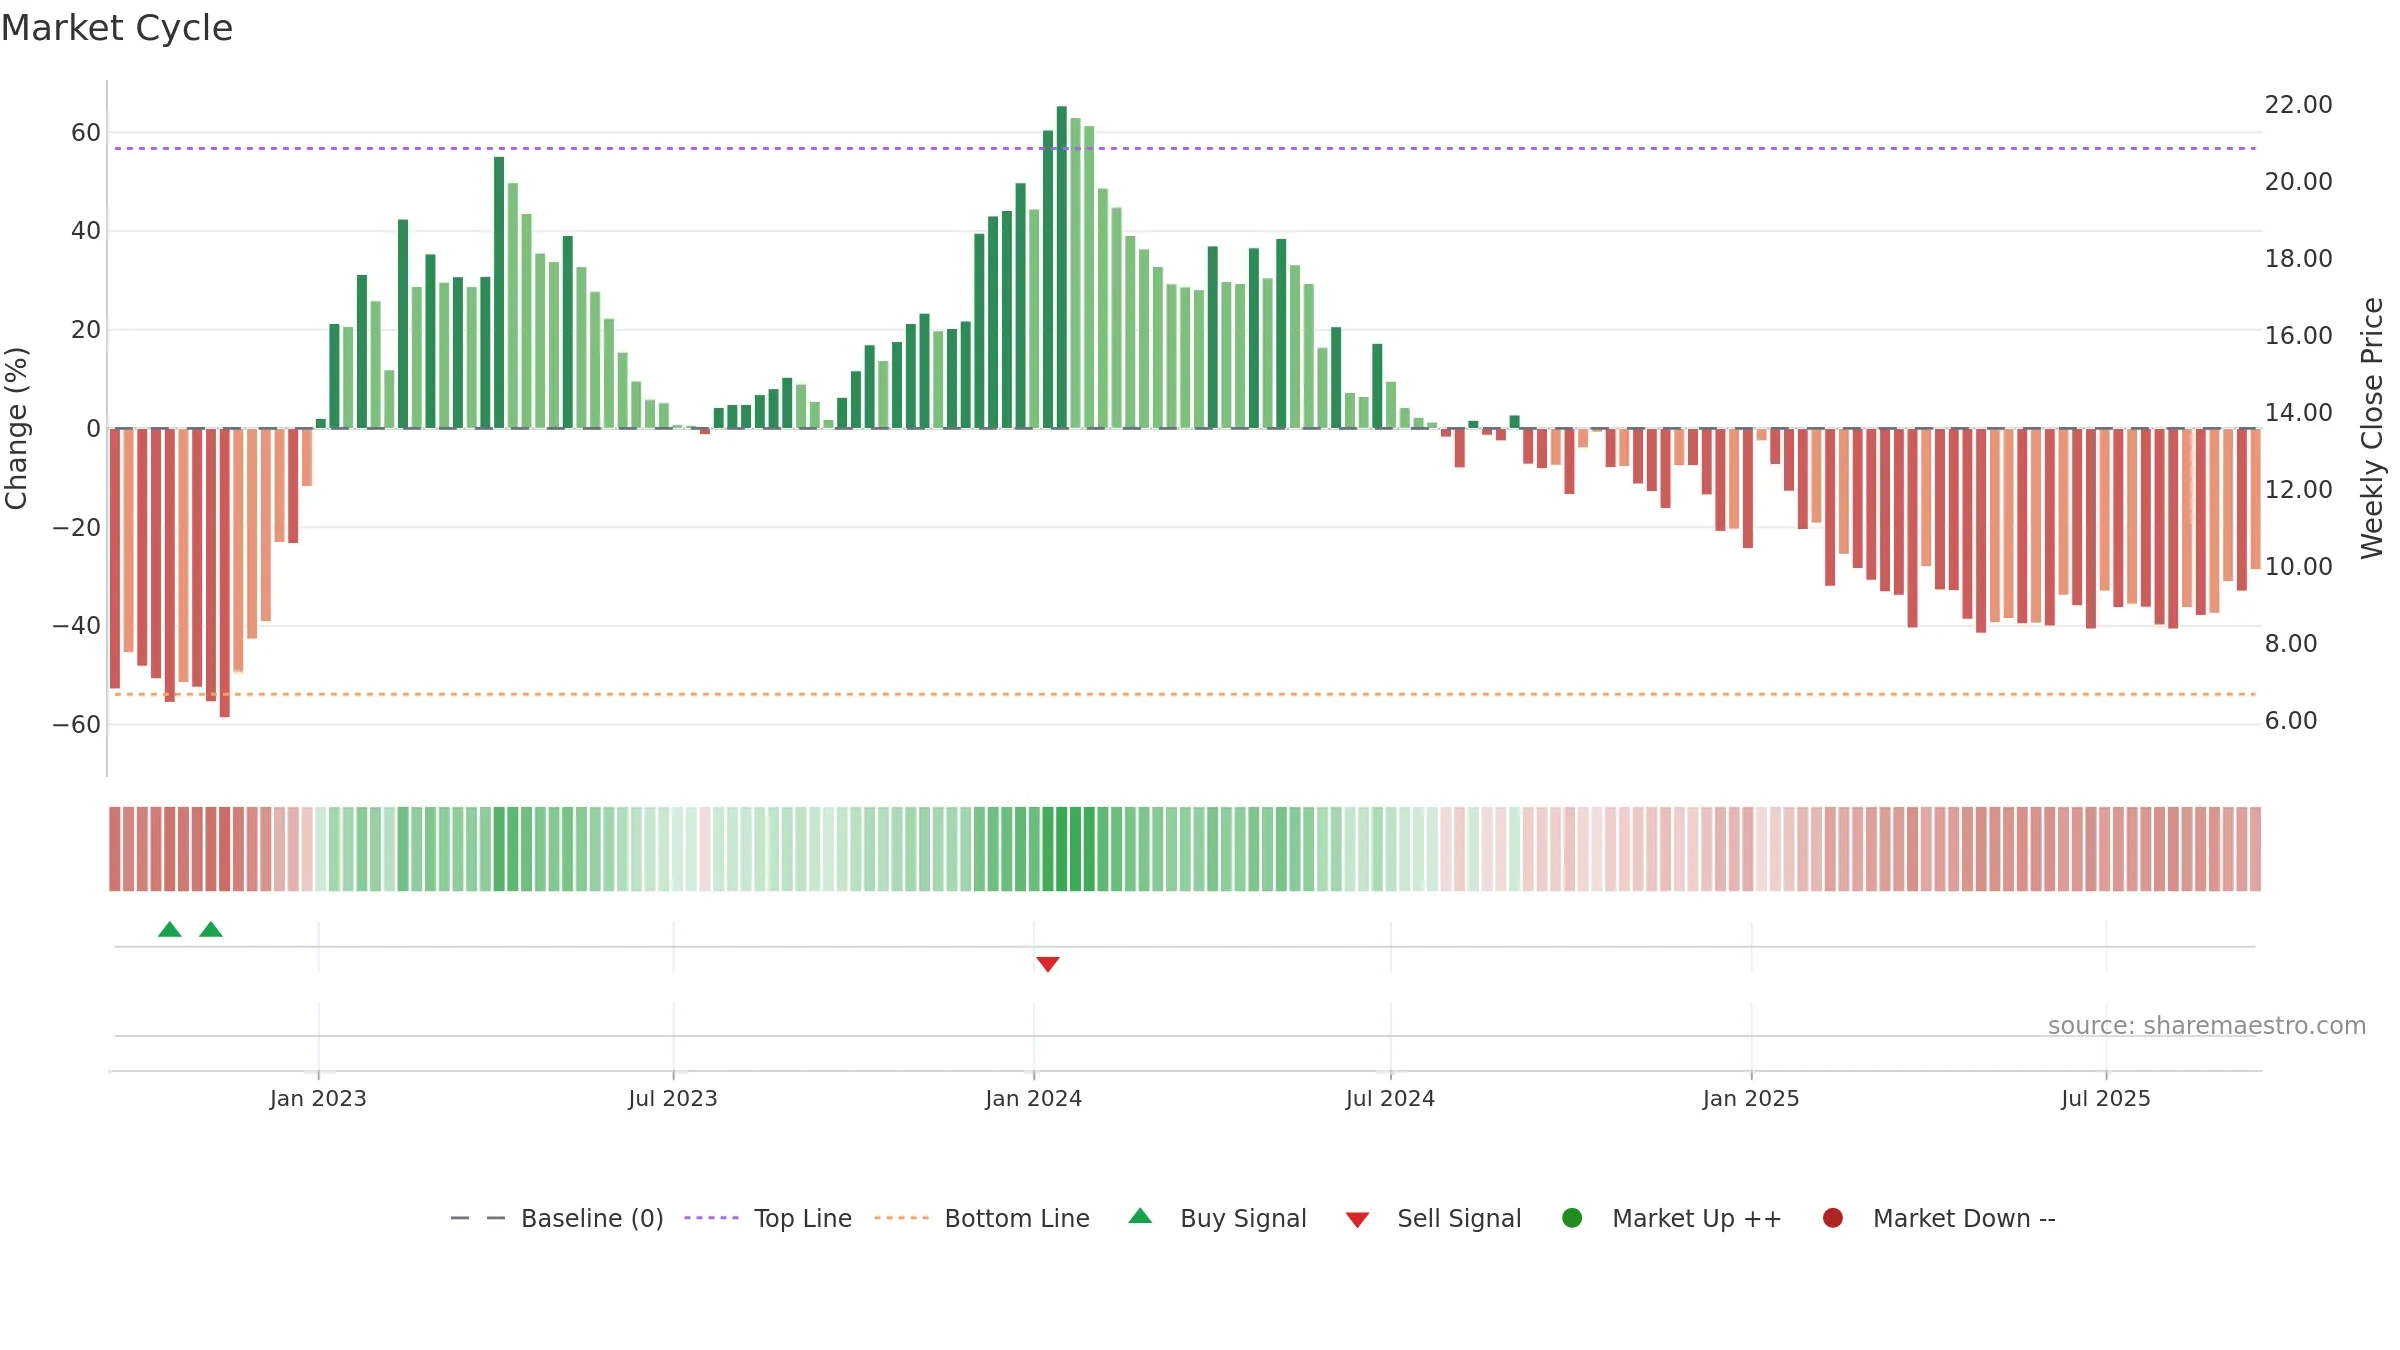
Positive setup. ★★★★☆ confidence. Price window: 18. Trend: Bottoming Attempt; gauge 22. In combination, liquidity confirms the move.
- Early improvement from bearish zone (bottoming attempt)
- Price holds above 8w & 26w averages
- Constructive moving-average stack
- Liquidity confirms the price trend
- High return volatility raises whipsaw risk
Why: Price window 18.58% over 8w. Close is 3.53% above the prior-window high. Return volatility 4.79%. Volume trend rising. Liquidity convergence with price. Trend state bottoming attempt. Low-regime (≤0.25) upticks 5/7 (71.0%) • Accumulating. MA stack constructive. Momentum neutral and rising. Valuation limited upside without catalysts.
Tip: Most metrics include a hover tooltip where they appear in the report.