Guangzhou Huayan Precision Machinery Co.,Ltd.
301138 SHE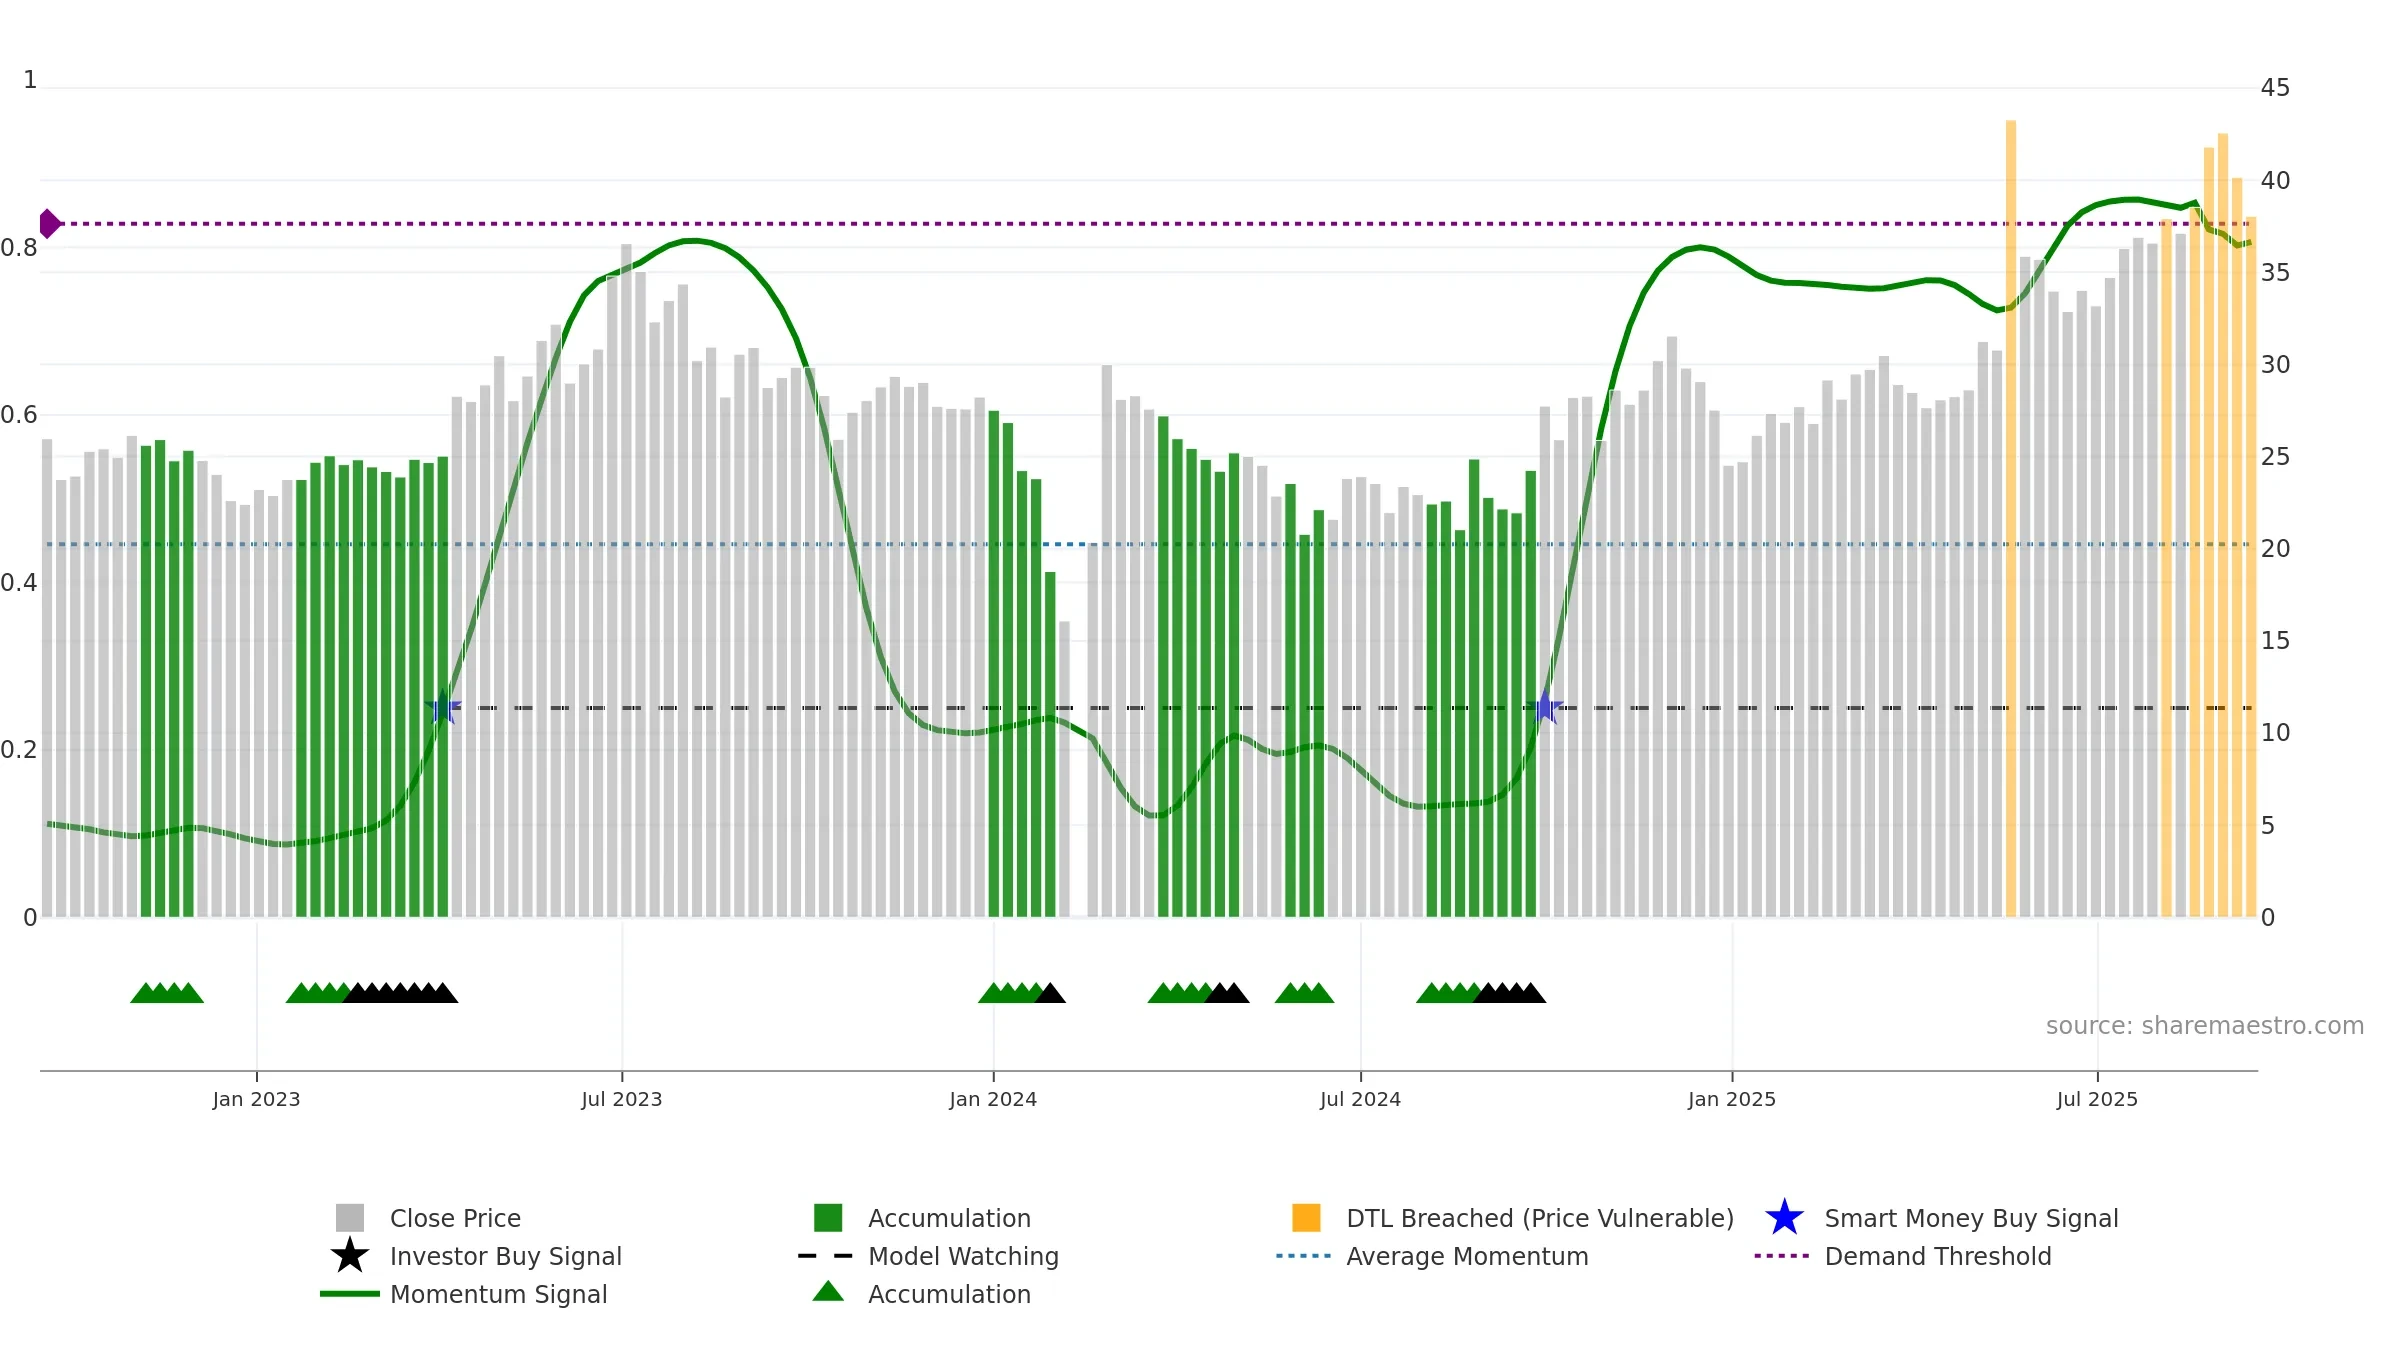
Weekly Report
Guangzhou Huayan Precision Machinery Co.,Ltd. closed at 38.0400 (0.45% WoW) . Data window ends Mon, 15 Sep 2025.
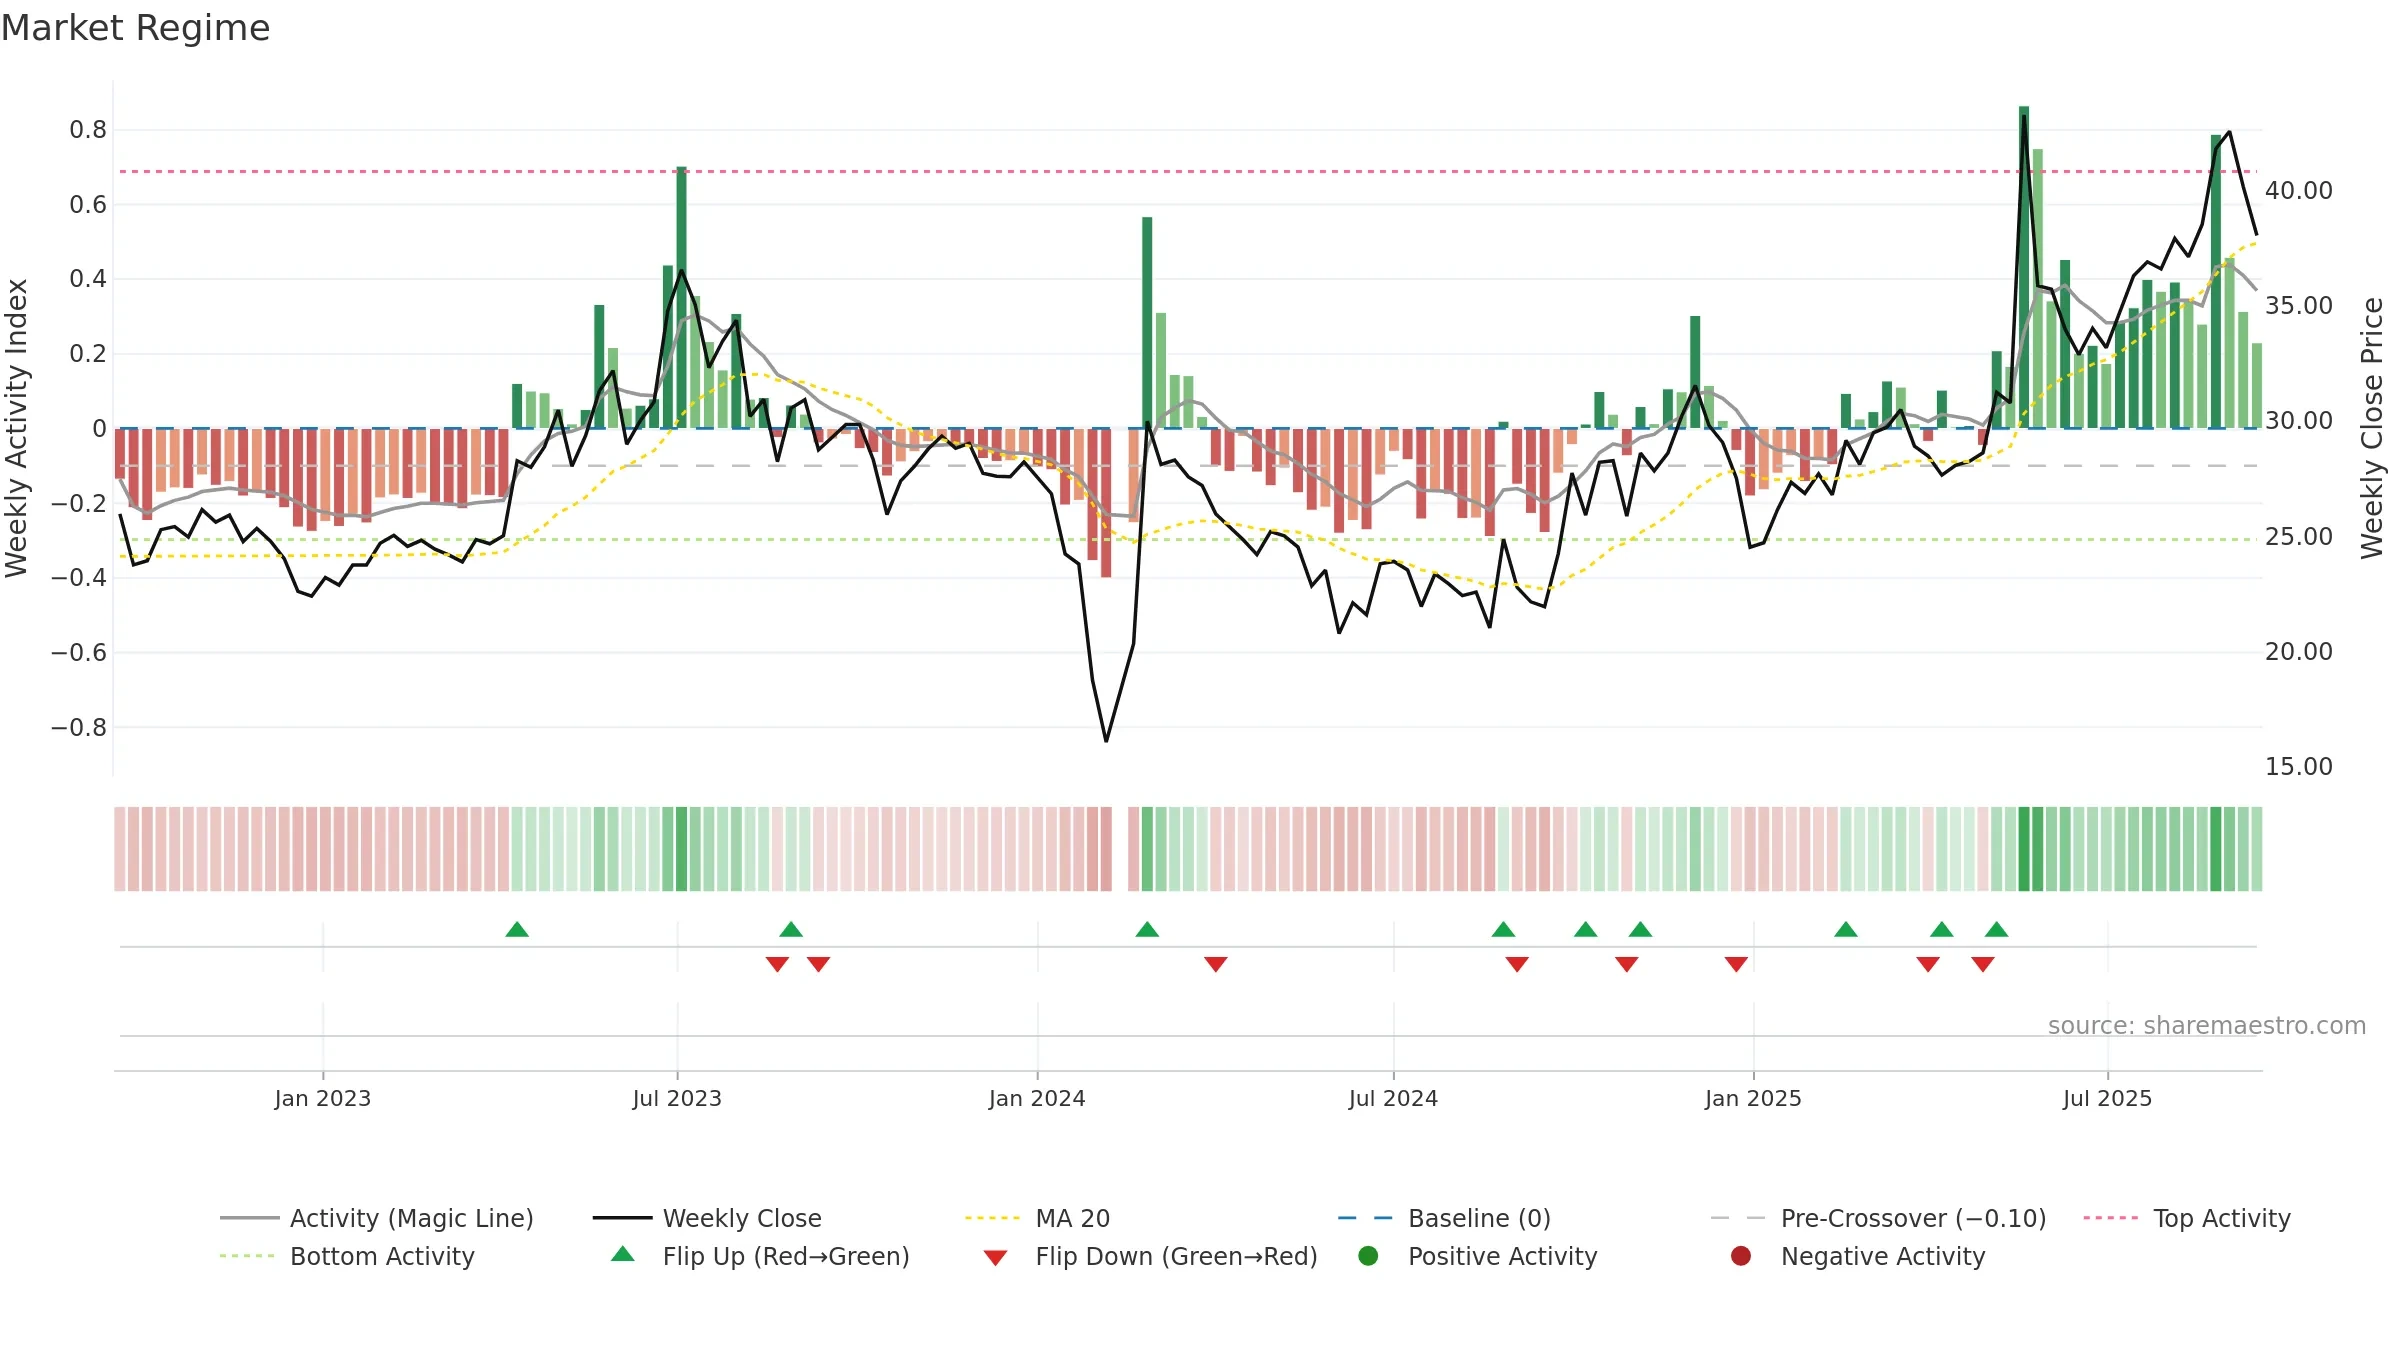
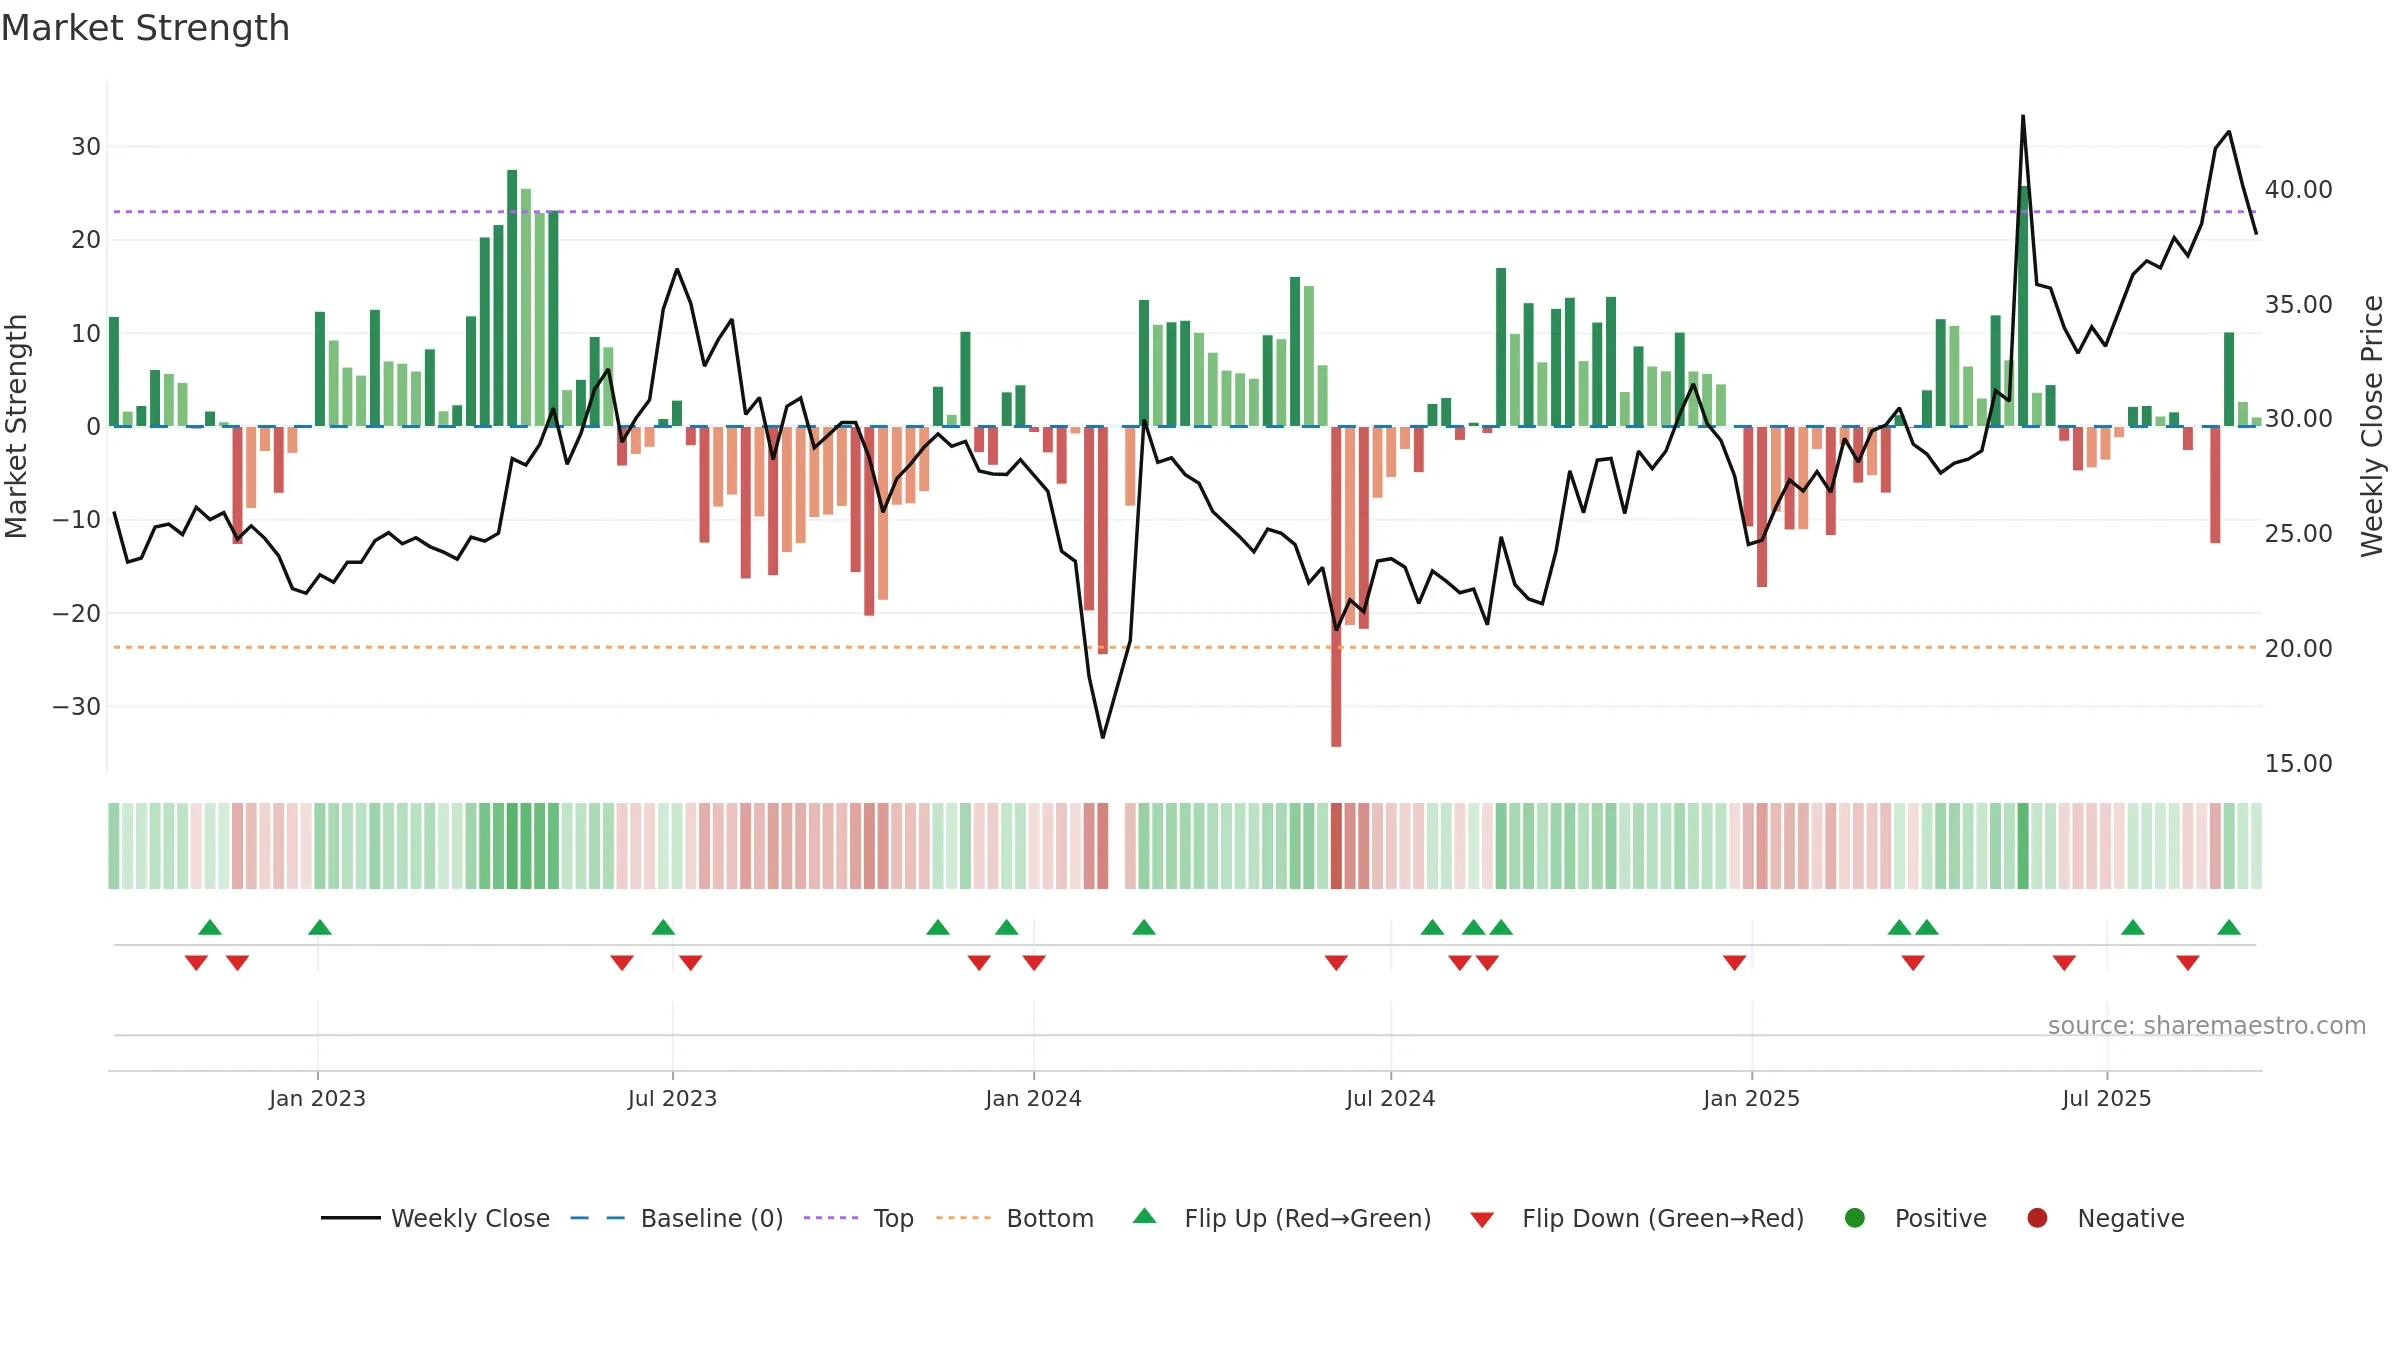
How to read this — Price slope is upward, indicating persistent buying over the window. Volume trend diverges from price — watch for fatigue or rotation. Returns are positively correlated with volume — strength tends to arrive on higher activity. Constructive MA stack supports the up-drift; pullbacks may find support at the 8–13 week region.
Up-slope supports buying interest; pullbacks may be contained if activity stays firm. Because liquidity isn’t confirming, prefer evidence of fresh demand before chasing moves.
Gauge maps the trend signal to a 0–100 scale.
How to read this — Gauge is elevated but momentum is rolling over; topping risk is rising.
Stay alert: protect gains or seek confirmation before adding risk.
Price is above fair value; upside may be capped without catalysts.
Conclusion
Negative setup. ★★☆☆☆ confidence. Price window: 3. Trend: Uptrend at Risk; gauge 80. In combination, liquidity diverges from price.
- Constructive moving-average stack
- High-level but rolling over (topping risk)
- Momentum is weak/falling
- Price is not above key averages
- Liquidity diverges from price
Why: Price window 3.96% over 8w. Close is -10.62% below the prior-window high. Volume trend falling. Liquidity divergence with price. Trend state uptrend at risk. High-regime (0.80–1.00) downticks 5/7 (71.0%) • Distributing. MA stack constructive. Momentum neutral and falling. Valuation limited upside without catalysts.
Tip: Most metrics include a hover tooltip where they appear in the report.