Accelleron Industries AG
ACLN SWX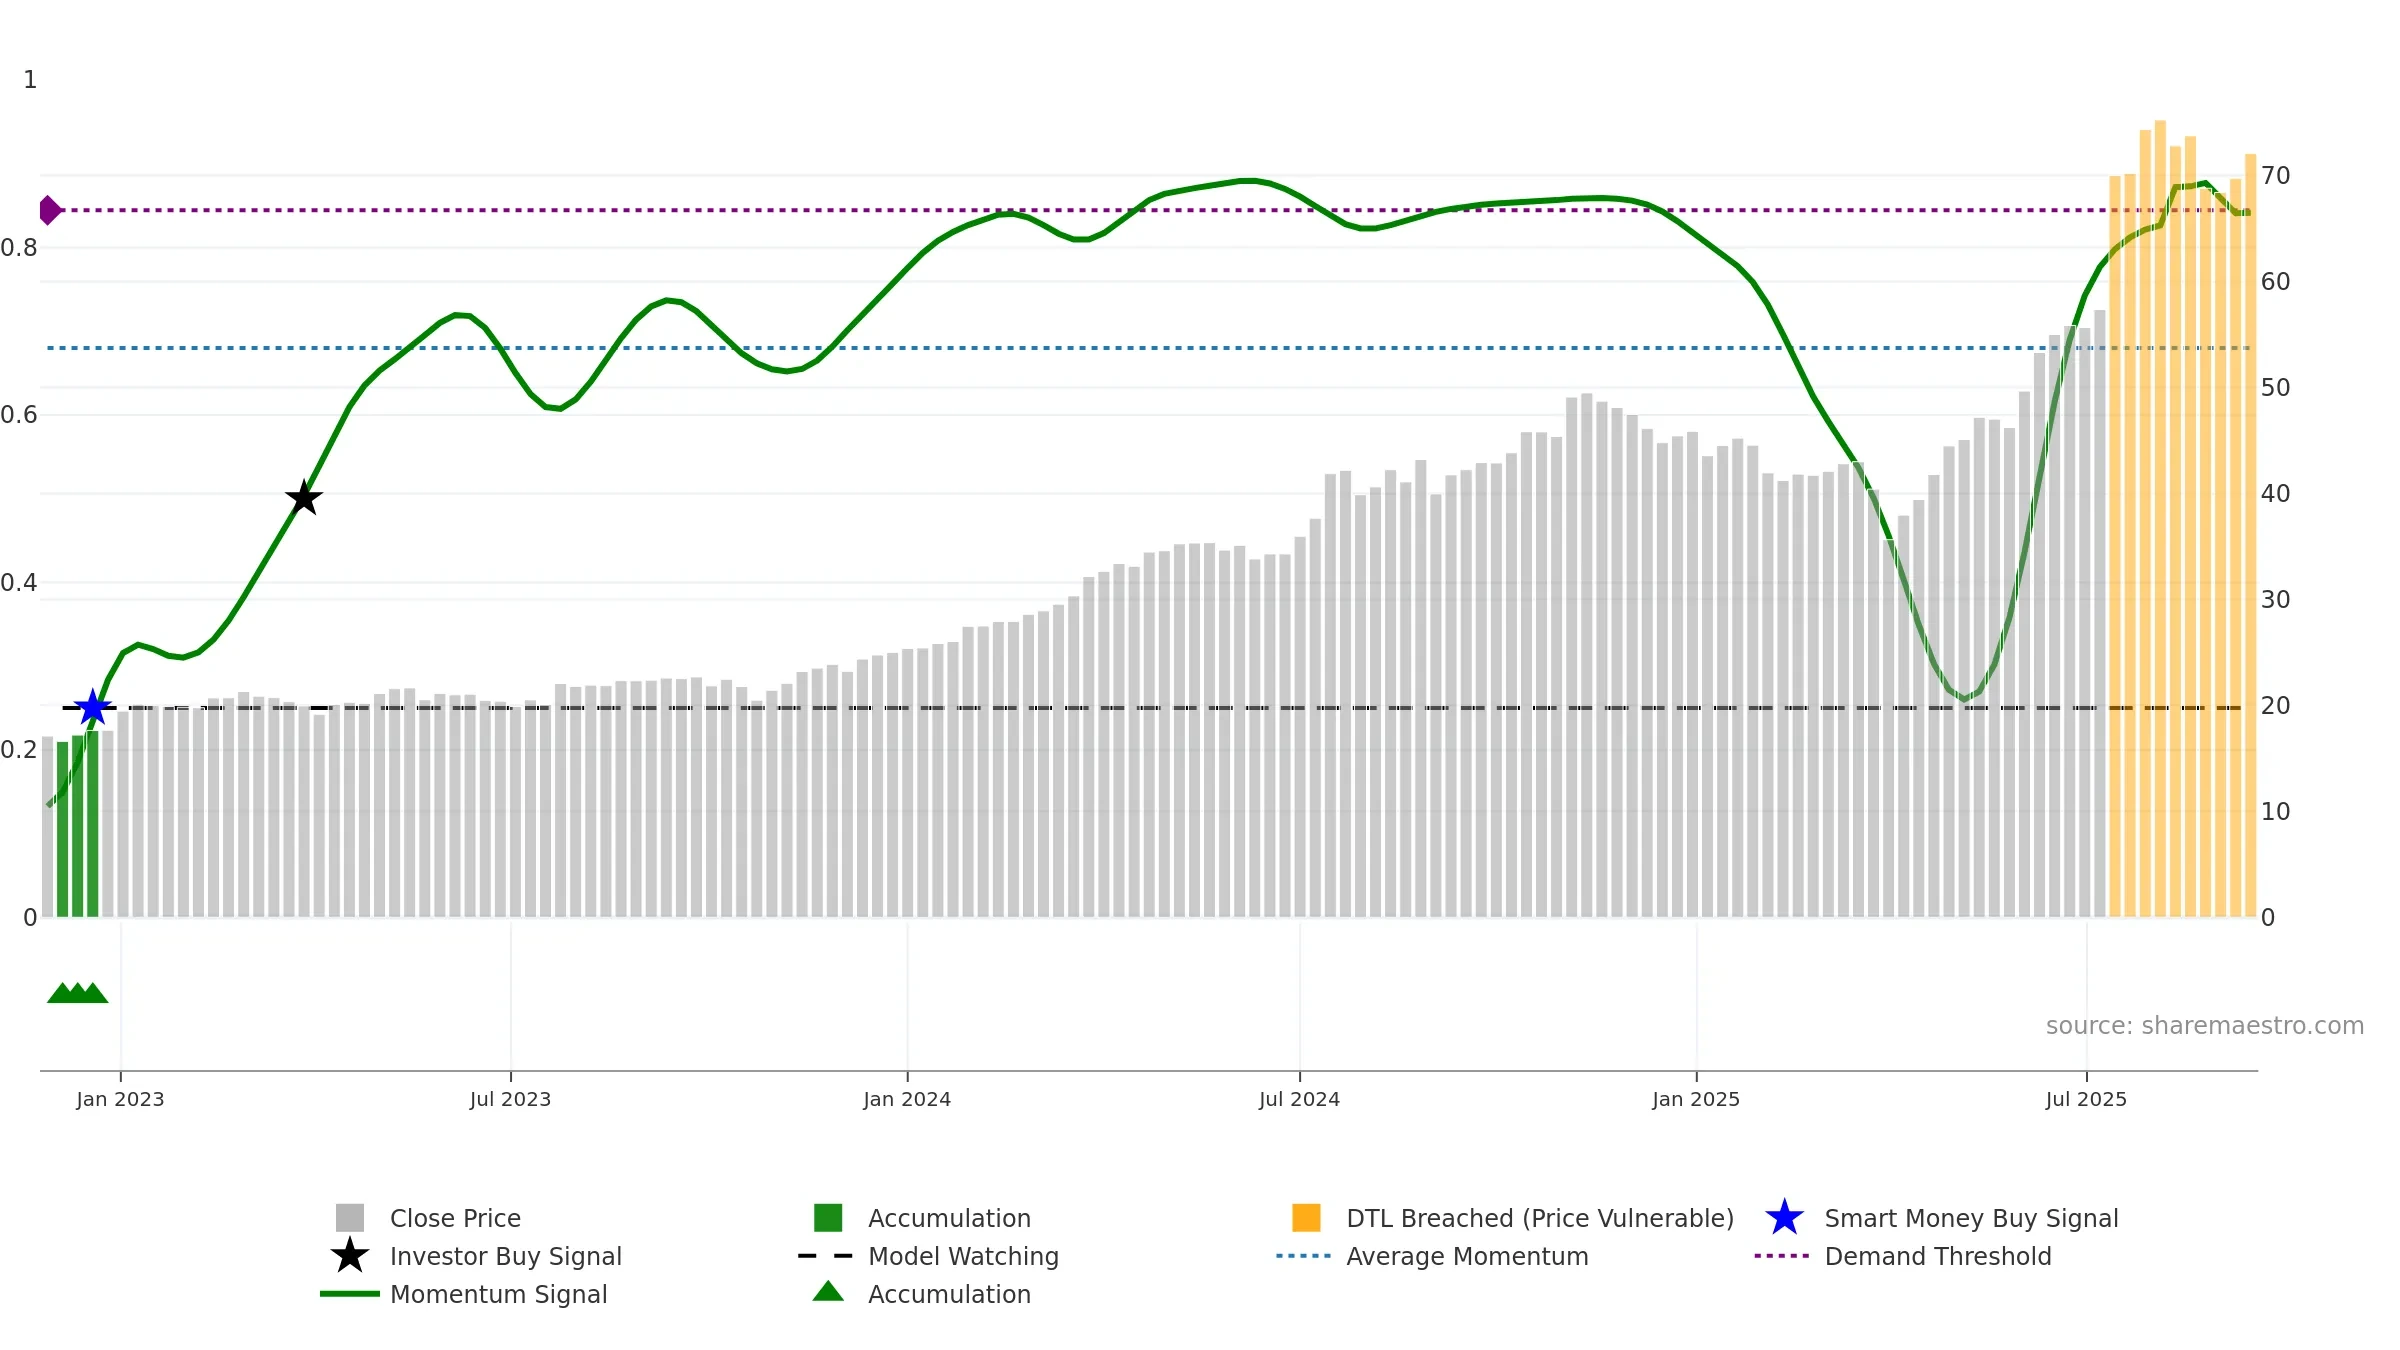
Weekly Report
Accelleron Industries AG closed at 72.1000 (-0.62% WoW) . Data window ends Mon, 15 Sep 2025.
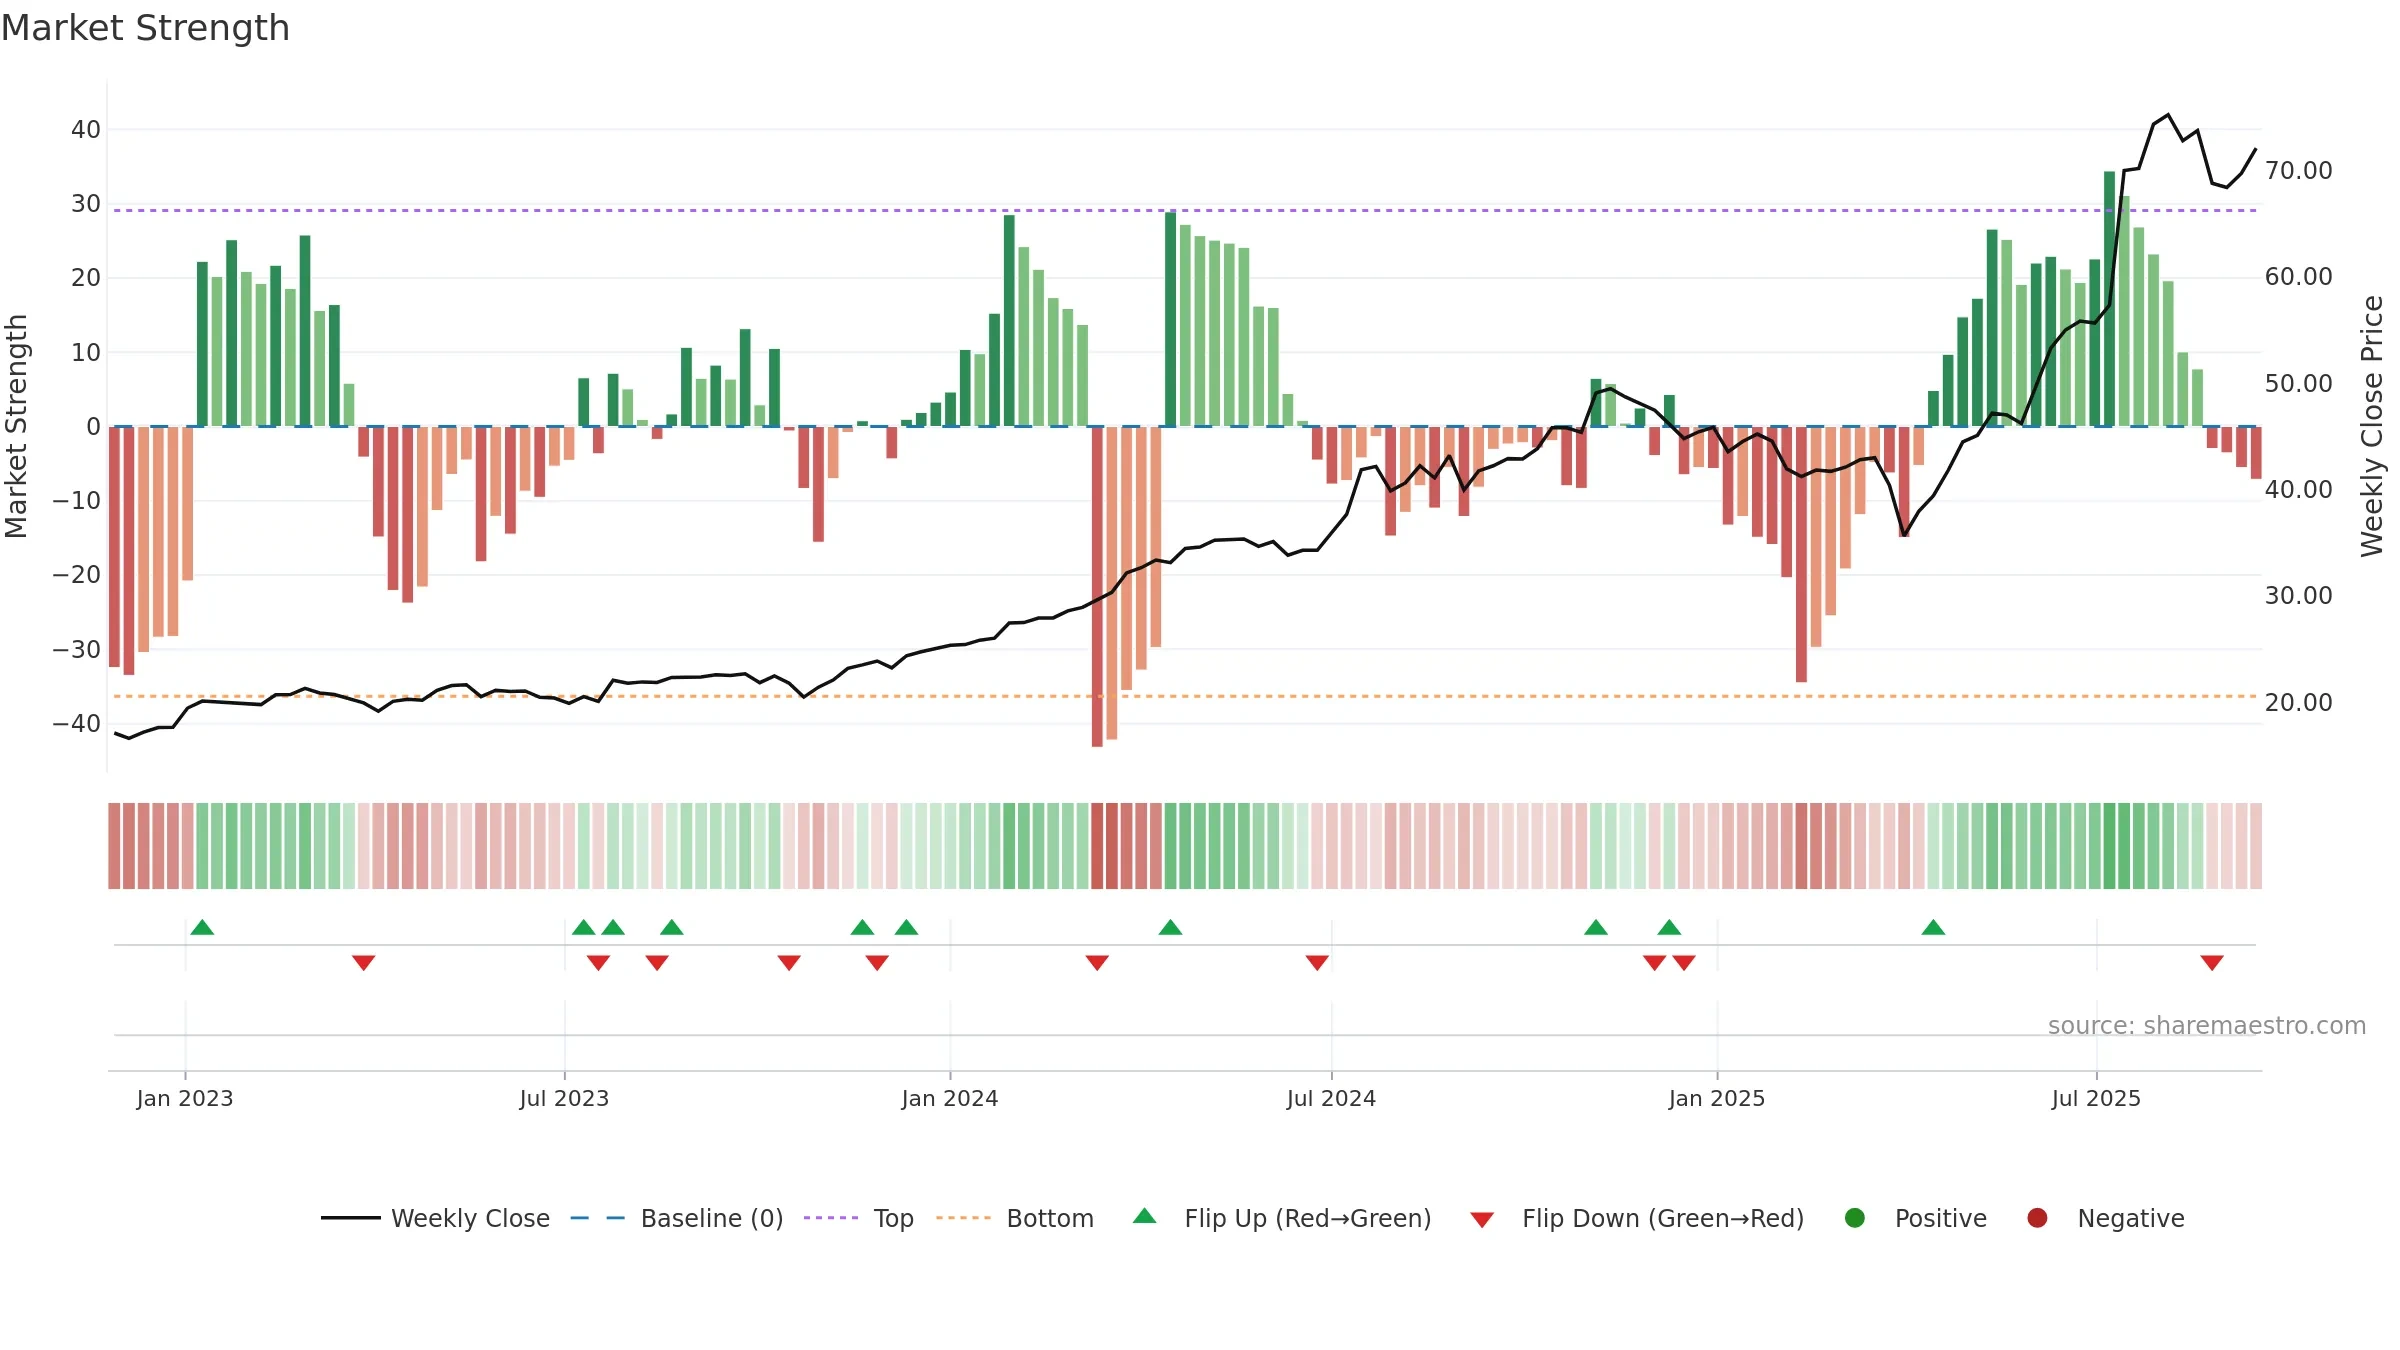
How to read this — Price slope is downward, indicating persistent supply pressure. Volume and price are moving in the same direction — a constructive confirmation. Distance to baseline is narrowing — reverting closer to its fair-value track. Price holds above key averages, indicating constructive participation.
Down-slope argues for patience; rallies can fade sooner unless participation improves.
Gauge maps the trend signal to a 0–100 scale.
How to read this — Gauge is elevated but momentum is rolling over; topping risk is rising.
Stay alert: protect gains or seek confirmation before adding risk.
Price is below fair value; potential upside if momentum constructive.
Conclusion
Positive setup. ★★★★☆ confidence. Price window: -3. Trend: Uptrend at Risk; gauge 84. In combination, liquidity confirms the move.
- Momentum is bullish and rising
- Price holds above 8w & 26w averages
- Liquidity confirms the price trend
- High-level but rolling over (topping risk)
- Negative multi-week performance
Why: Price window -3.03% over 8w. Close is -4.19% below the prior-window high. Volume trend falling. Liquidity convergence with price. Trend state uptrend at risk. High-regime (0.80–1.00) downticks 2/7 (29.0%) • Accumulating. Baseline deviation 1.13% (narrowing). Momentum bullish and rising. Valuation supportive skew.
Tip: Most metrics include a hover tooltip where they appear in the report.