ZIM Integrated Shipping Services Ltd.
ZIM NYSE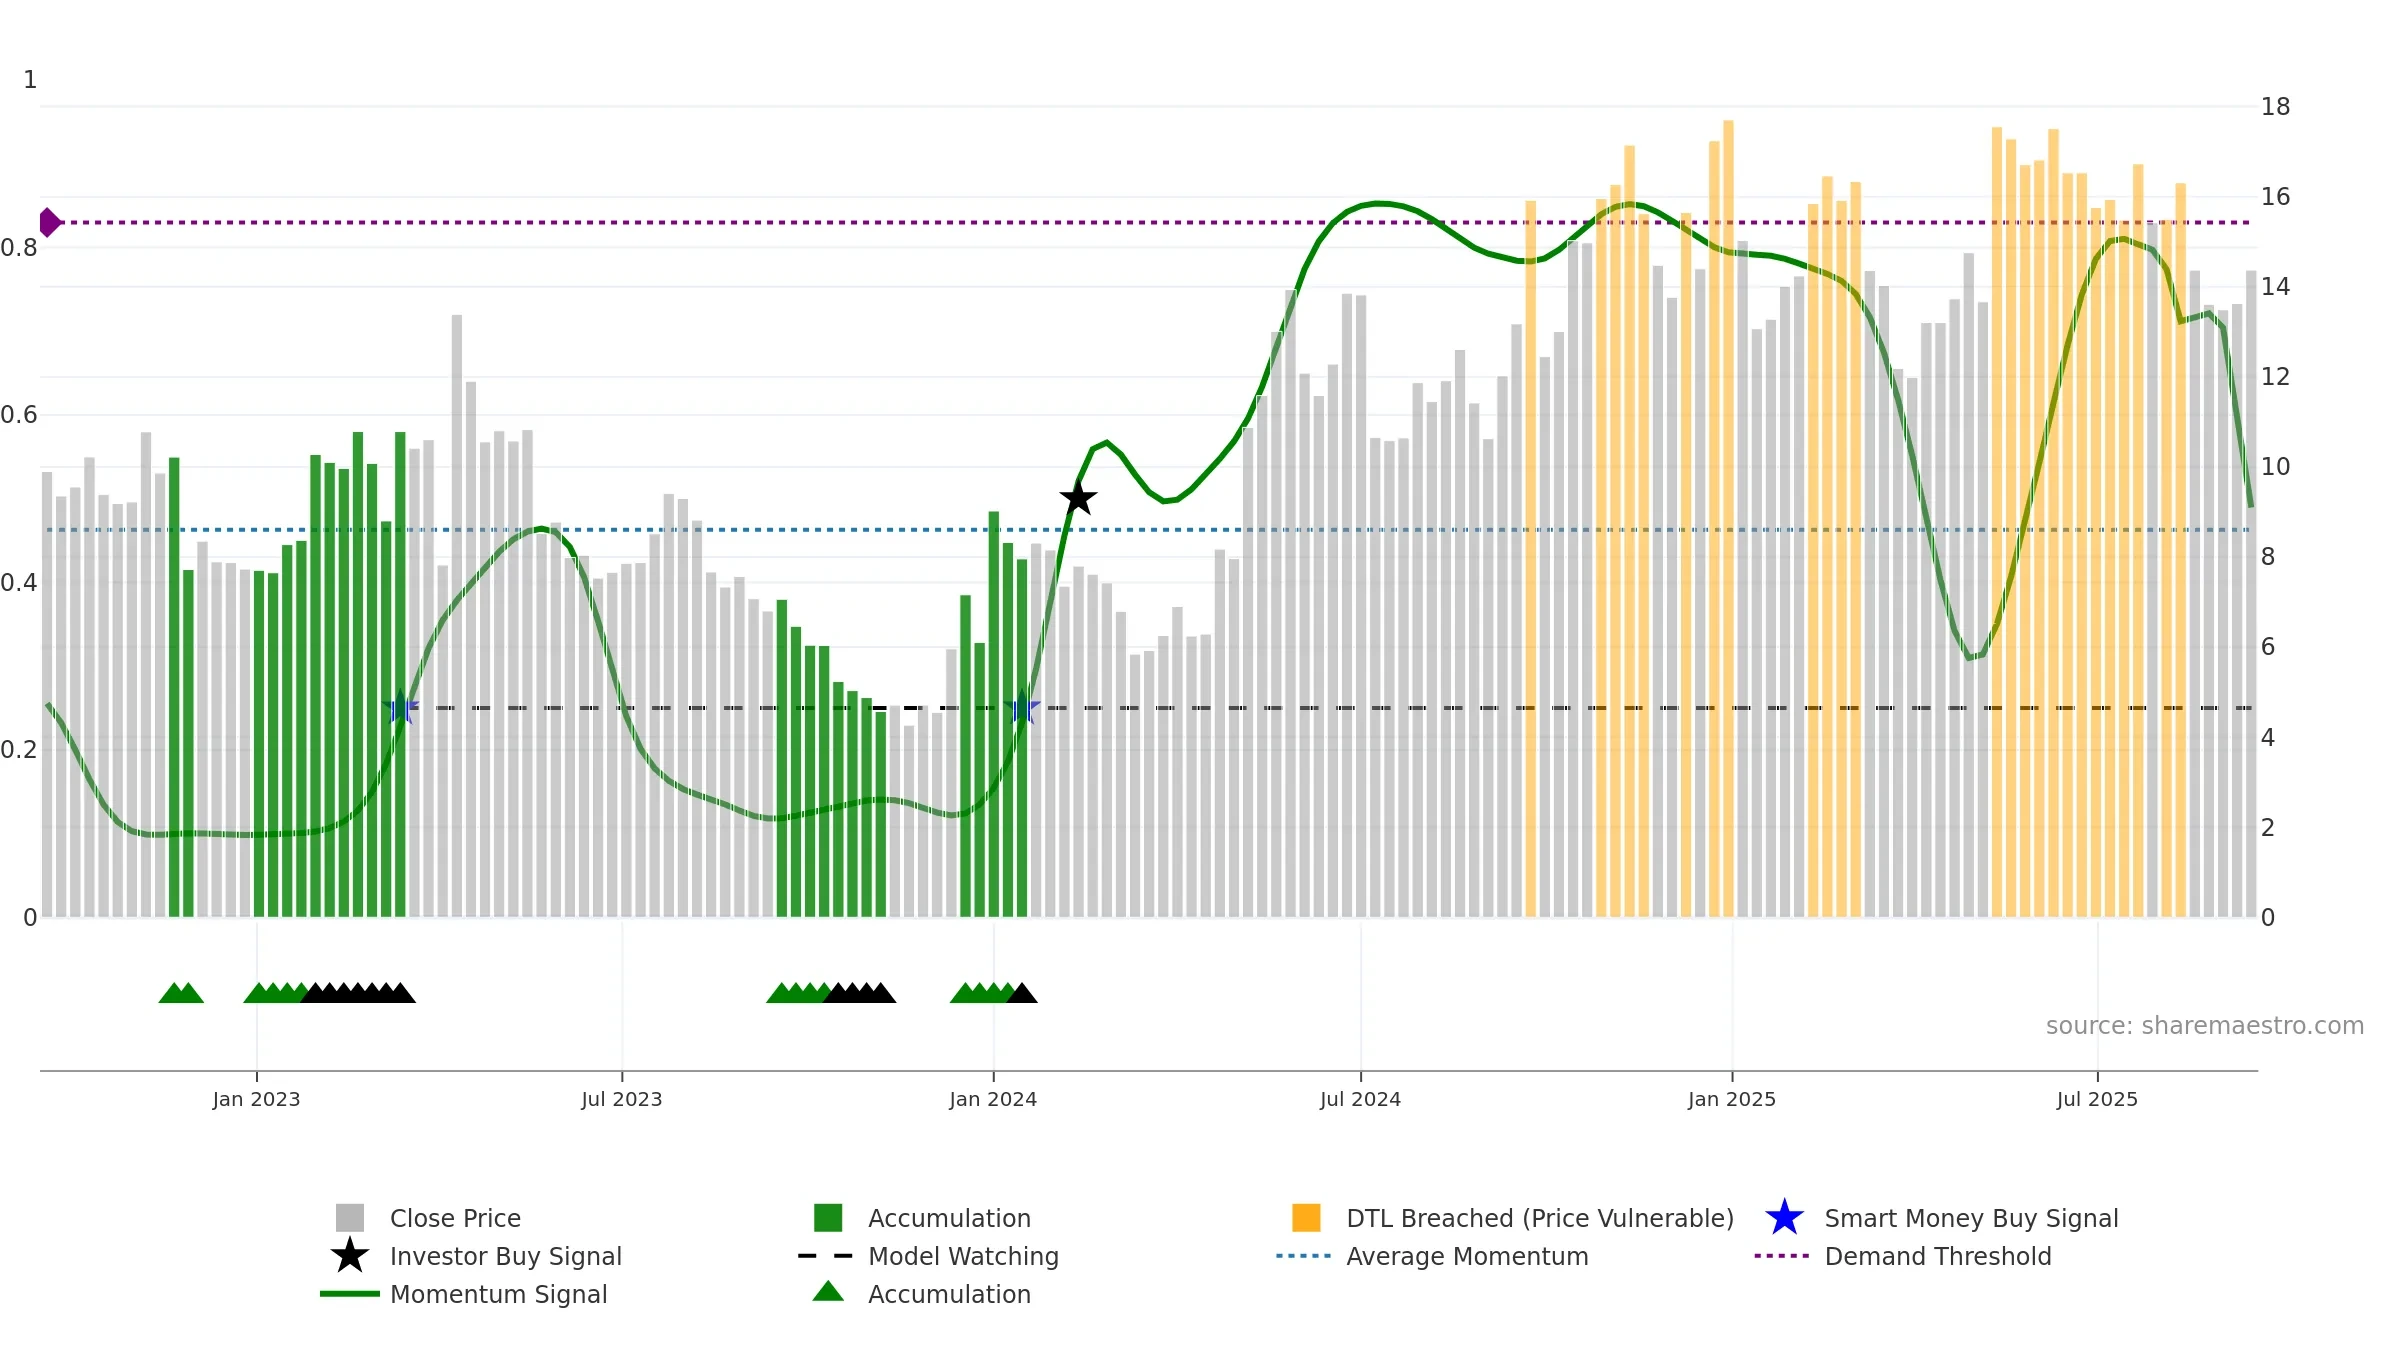
Weekly Summary
ZIM Integrated Shipping Services Ltd. closed at 14.3700 (-3.49% WoW) . Data window ends Mon, 15 Sep 2025.
How to read this — Price slope is downward, indicating persistent supply pressure. Elevated weekly volatility increases whipsaw risk. Volume trend diverges from price — watch for fatigue or rotation. Returns are negatively correlated with volume — strength may come on lighter activity. Distance to baseline is narrowing — reverting closer to its fair-value track. Price sits below key averages, keeping pressure on the tape.
Down-slope argues for patience; rallies can fade sooner unless participation improves. Because liquidity isn’t confirming, prefer evidence of fresh demand before chasing moves.
Gauge maps the trend signal to a 0–100 scale.
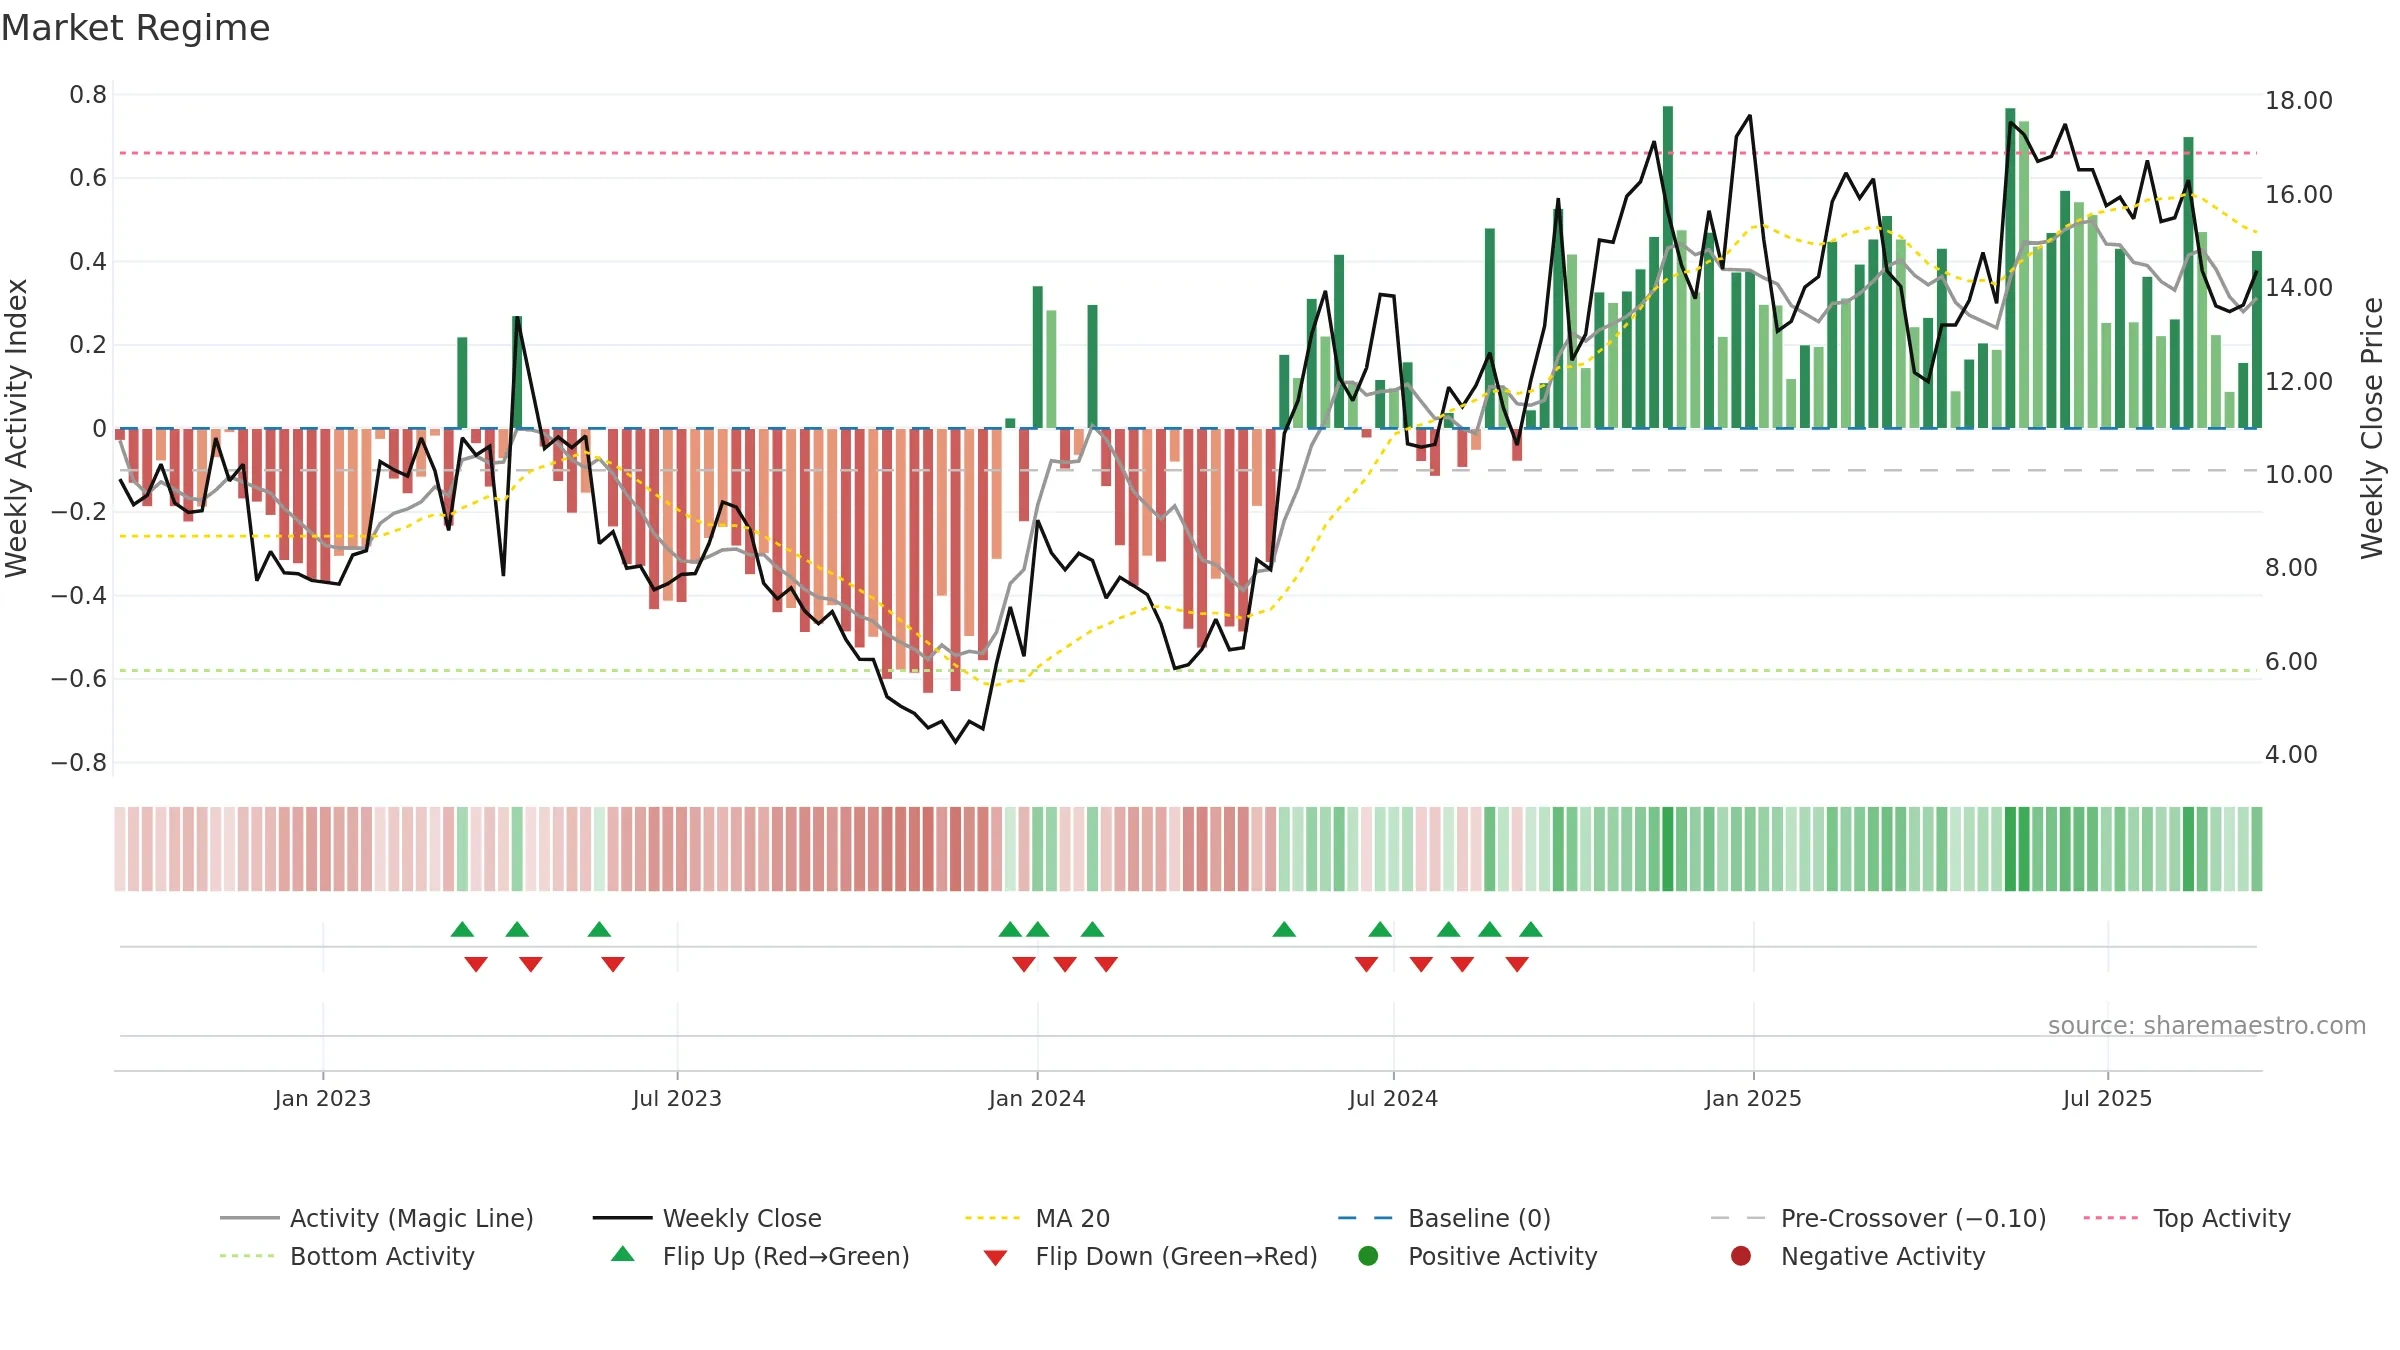
How to read this — Range-bound conditions; conviction is limited until a break or acceleration emerges. Loss of the ~0.50 midline after strength suggests regime shift.
Wait for a directional break or improving acceleration.

Relative strength is Negative
(< 0%, underperforming).
Latest MRS: -11.03% (week ending Fri, 19 Sep 2025).
Slope: Falling over 8w.
Notes:
- Below zero line indicates relative weakness vs benchmark.
- MRS slope falling over ~8 weeks.
The flag is positive: favourable upside skew with supportive conditions.
Conclusion
Negative setup. ★★☆☆☆ confidence. Trend: Range / Neutral · -6.81% over window · vol 4.16% · liquidity divergence · posture below · RS weak
- Momentum is weak/falling
- Price is not above key averages
- Liquidity diverges from price
- High return volatility raises whipsaw risk
Why: Price window -6.81% over w. Close is -11.89% below the prior-window high. Return volatility 4.16%. Volume trend rising. Liquidity divergence with price. Trend state range / neutral. Momentum neutral and falling. Valuation stance positive.
Tip: Most metrics include a hover tooltip where they appear in the report.