Akash Infra-Projects Limited
AKASH NSE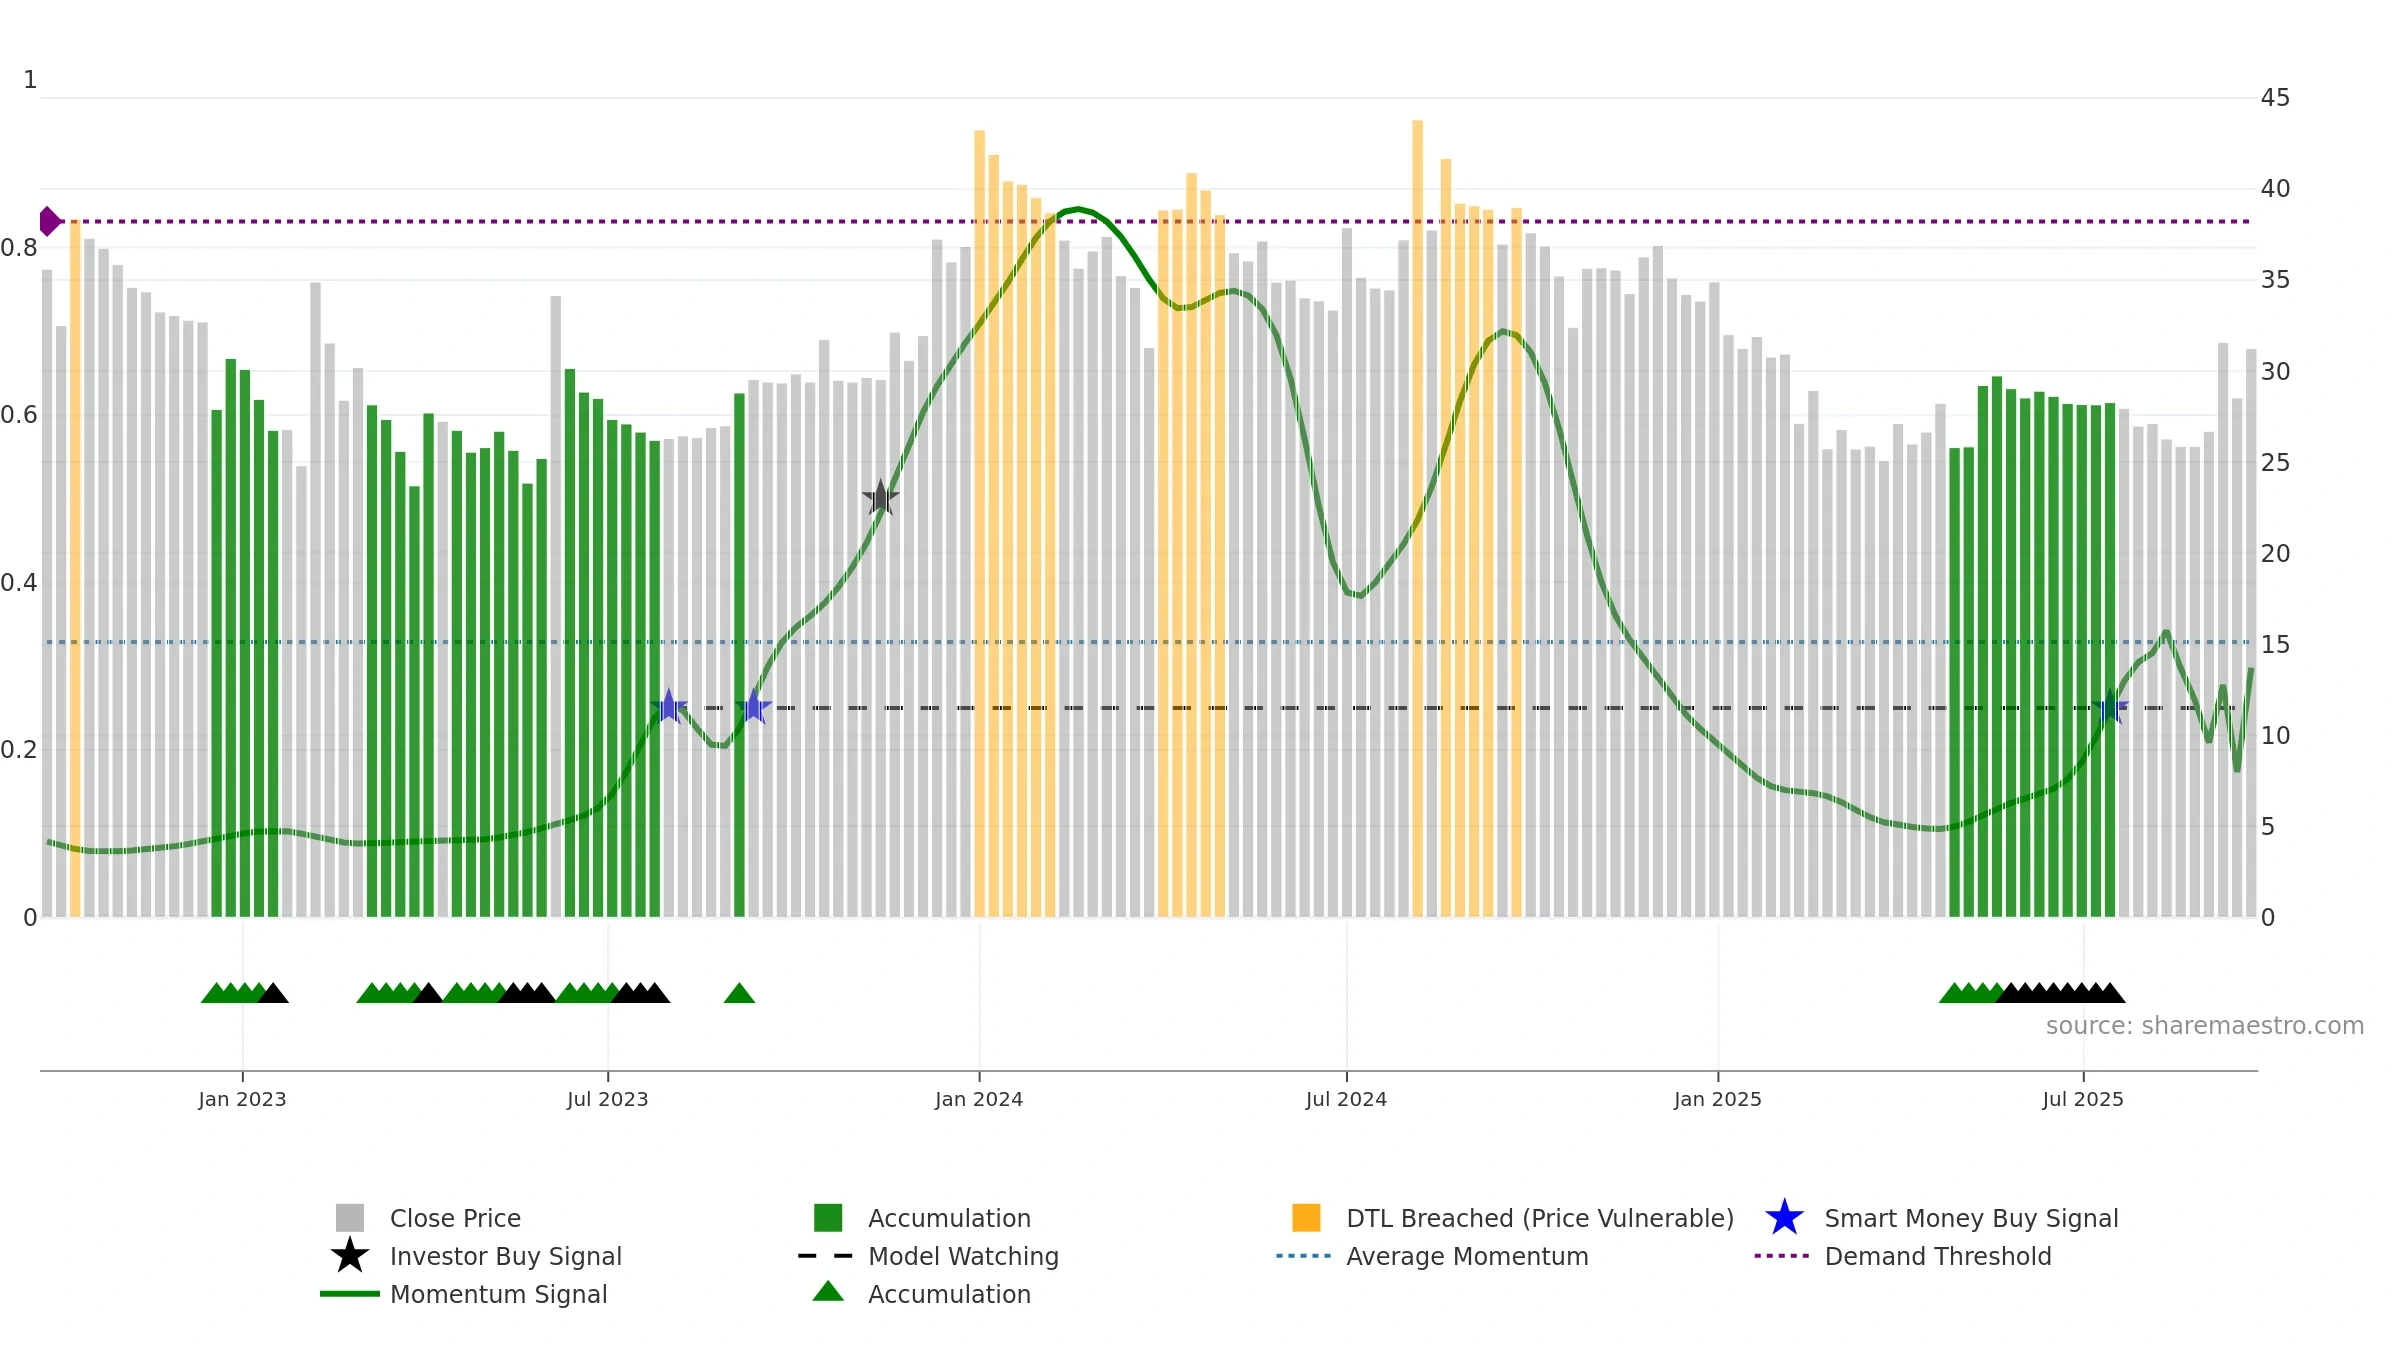
Weekly Report
Akash Infra-Projects Limited closed at 31.2500 (-0.92% WoW) . Data window ends Mon, 22 Sep 2025.
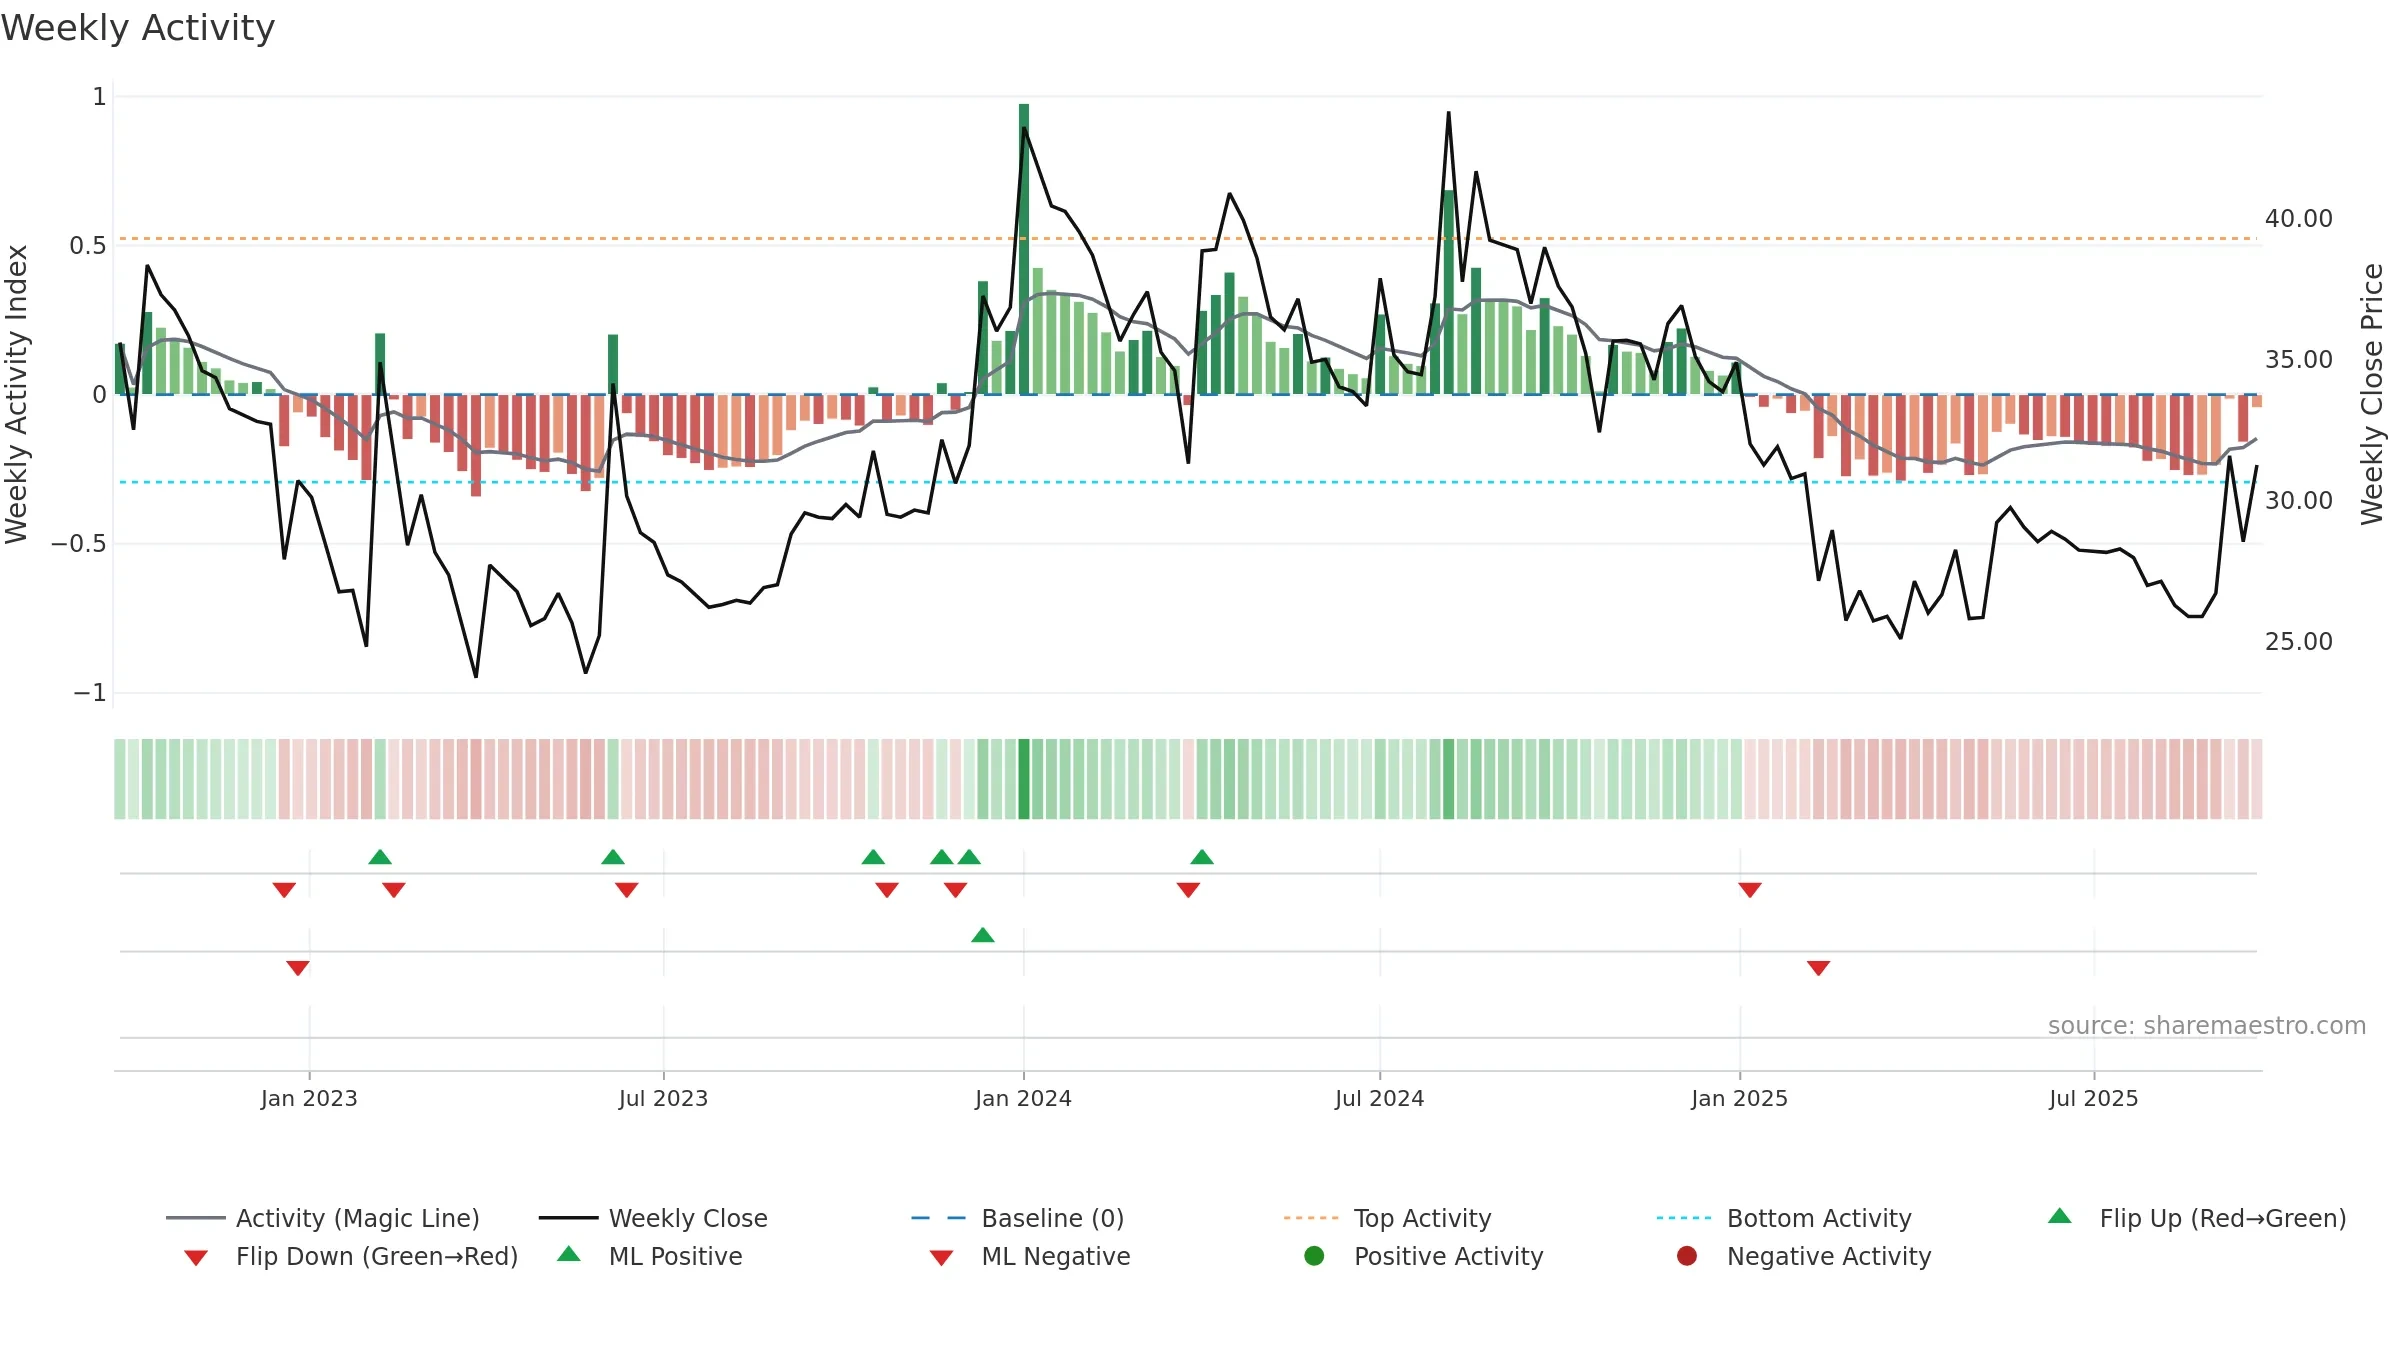
How to read this — Price slope is upward, indicating persistent buying over the window. Elevated weekly volatility increases whipsaw risk. Volume and price are moving in the same direction — a constructive confirmation. Returns are positively correlated with volume — strength tends to arrive on higher activity. Price holds above key averages, indicating constructive participation.
Up-slope supports buying interest; pullbacks may be contained if activity stays firm.
Gauge maps the trend signal to a 0–100 scale.
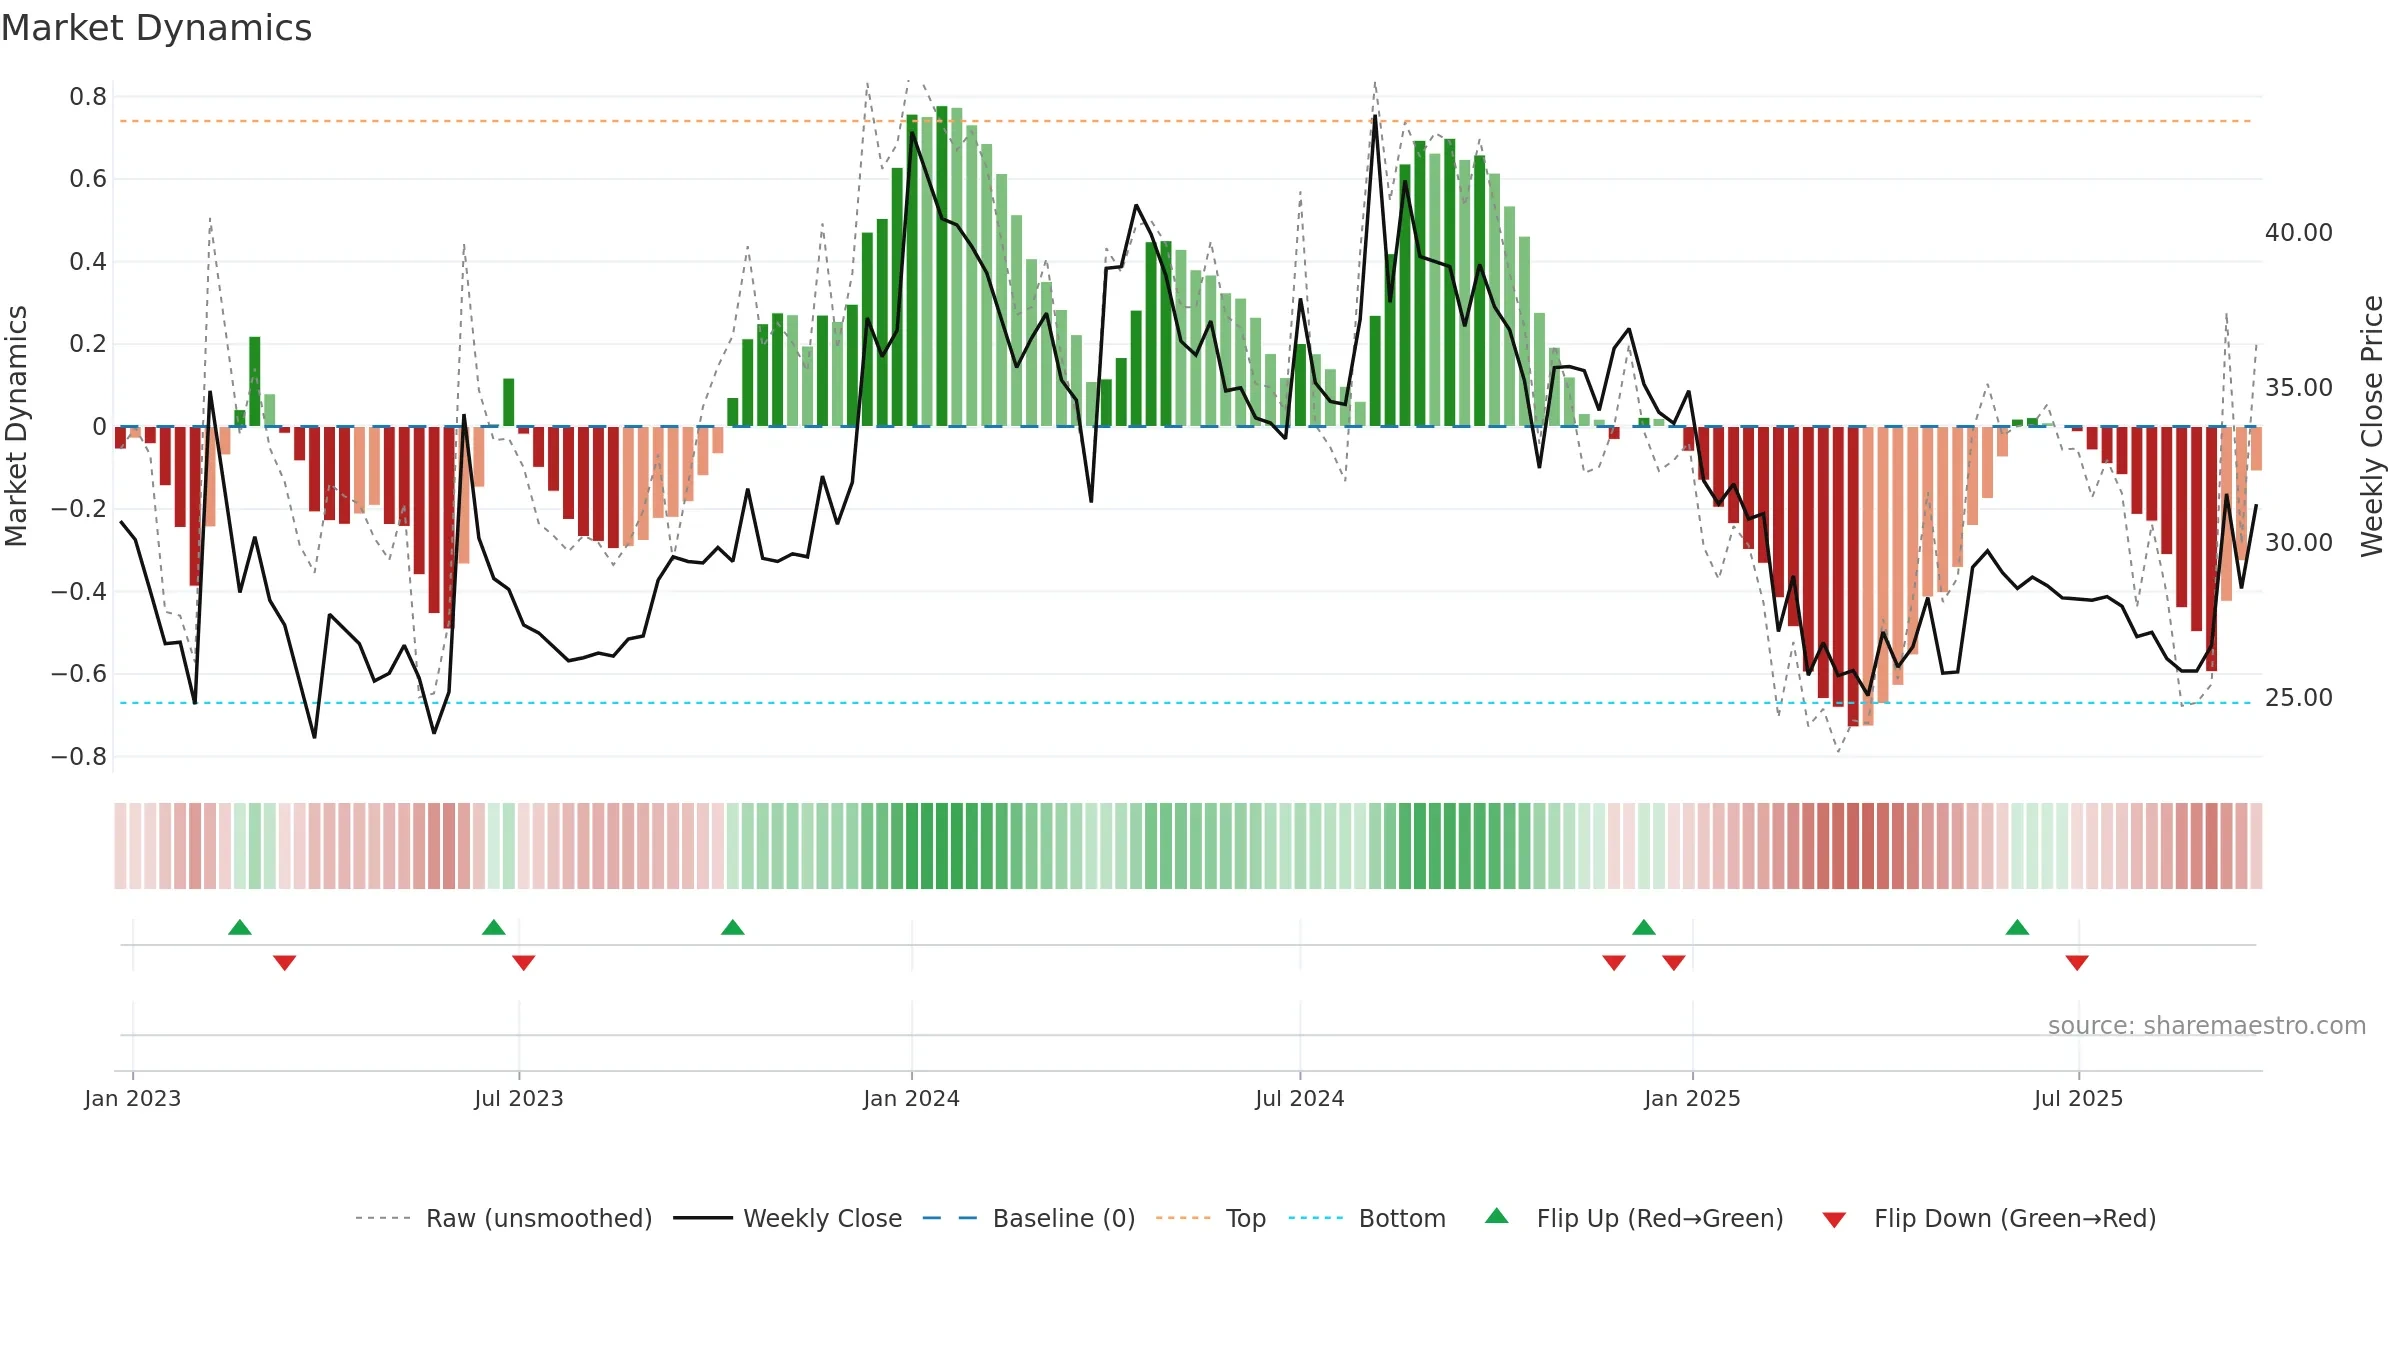
How to read this — Bearish backdrop but short-term momentum is improving; confirmation still needed.
Early improvement — look for a reclaim of 0.50→0.60 to validate.
Price is above fair value; upside may be capped without catalysts.
Conclusion
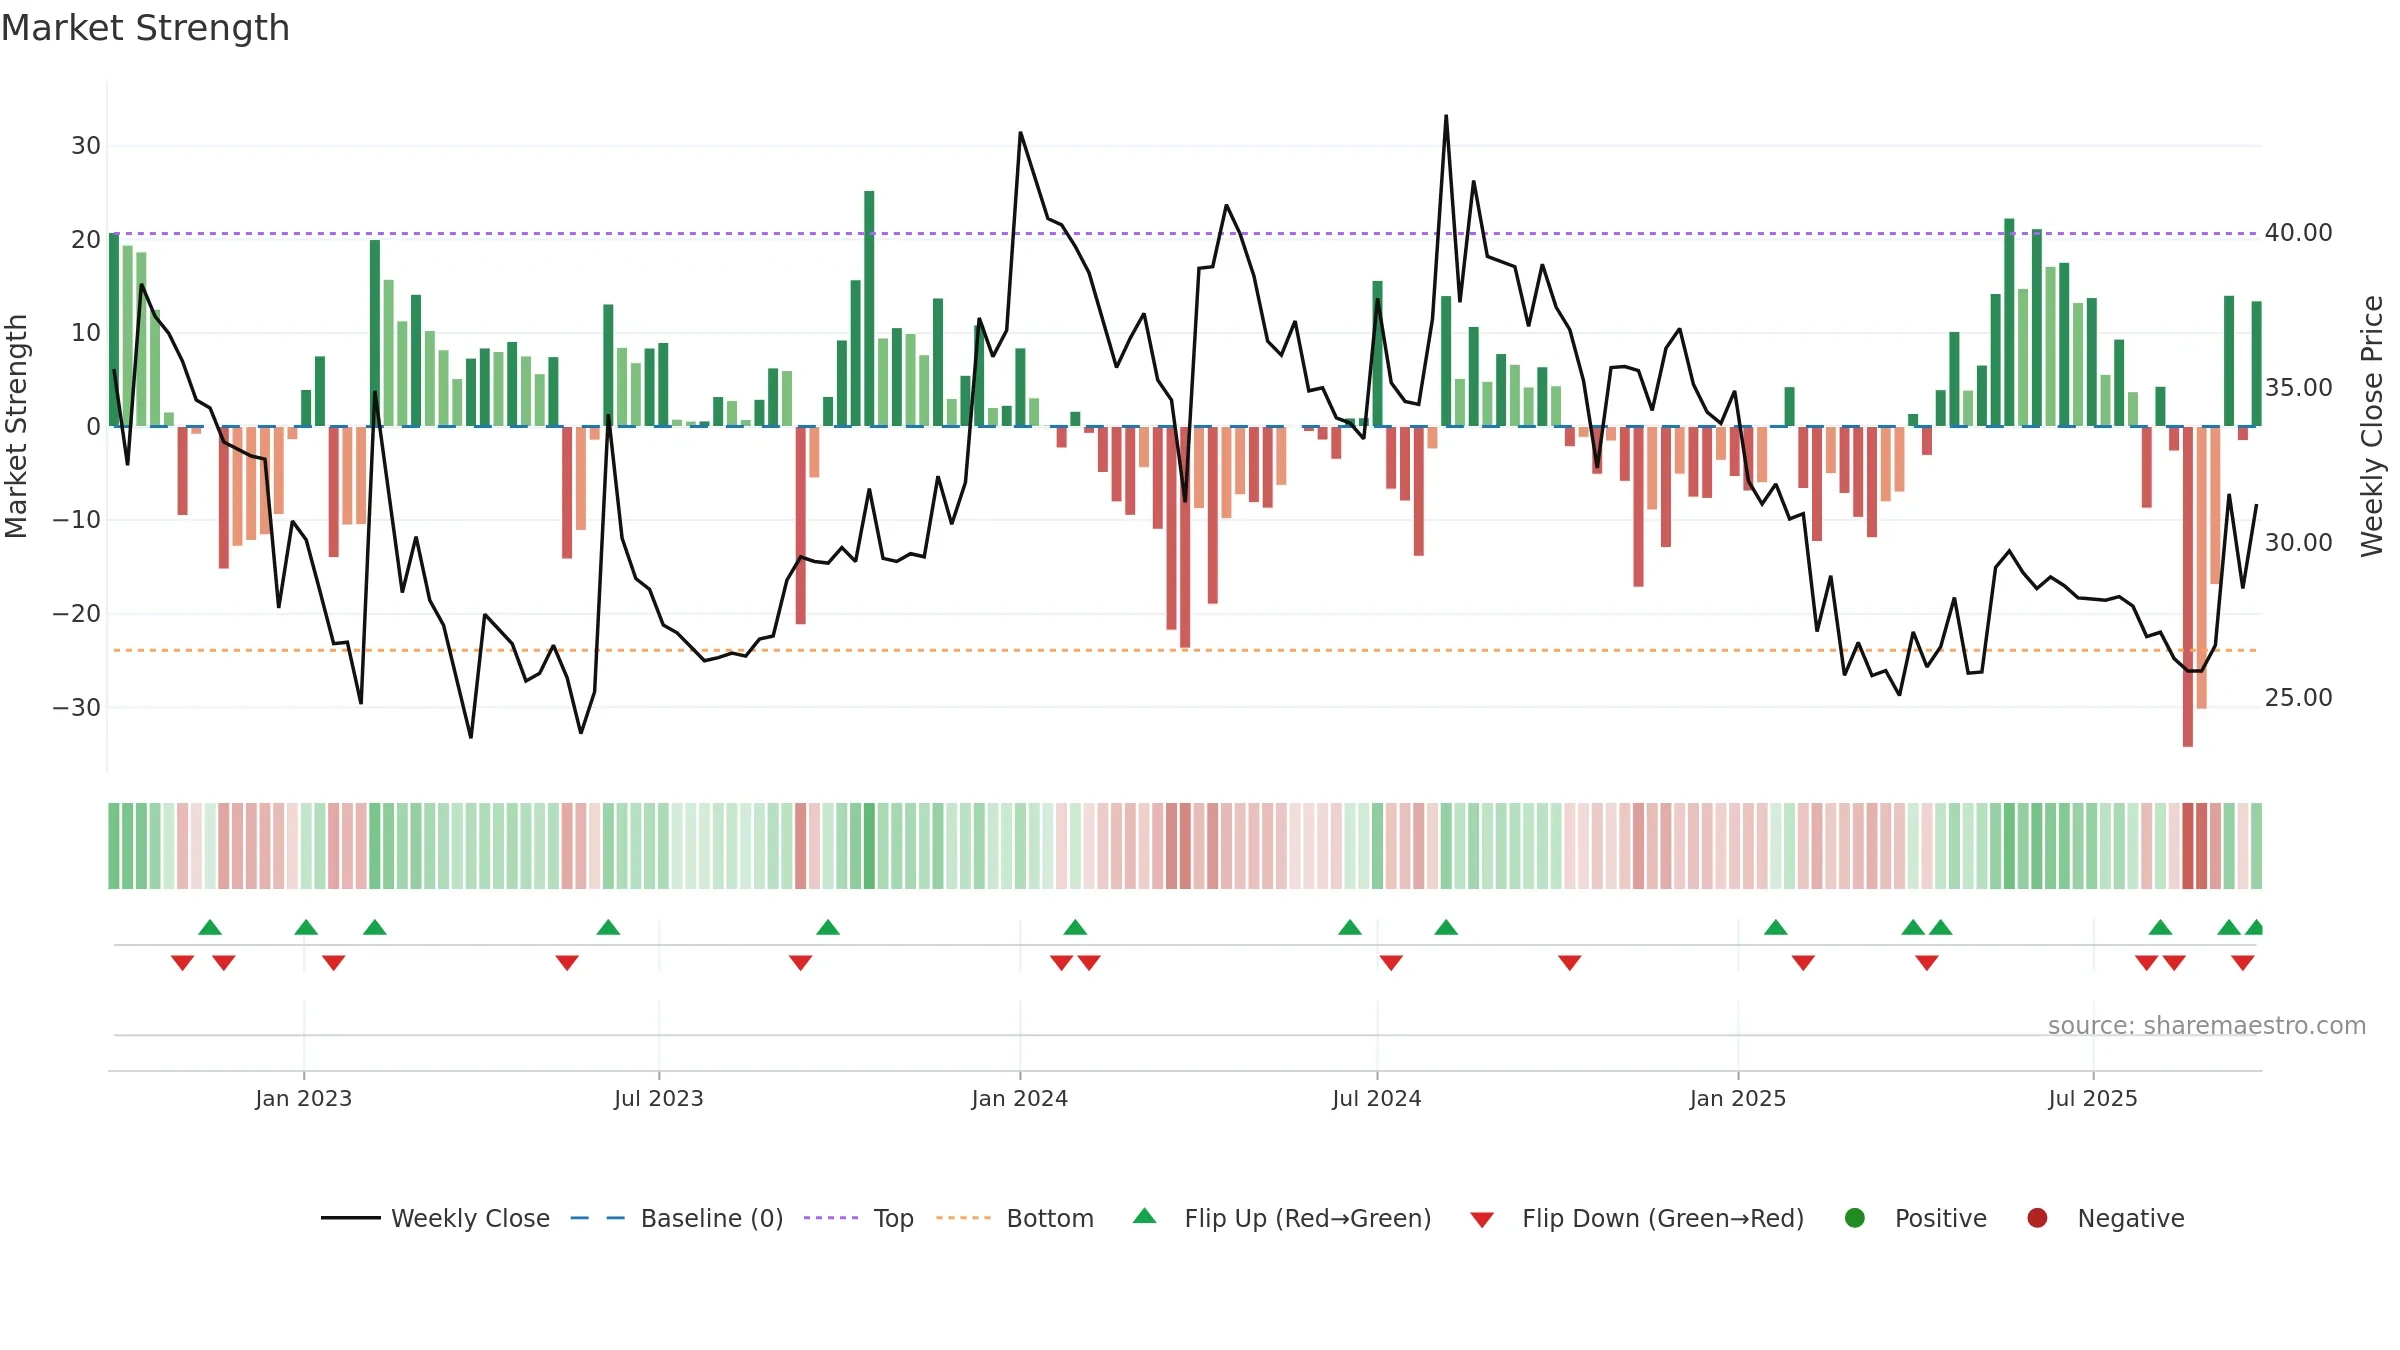
Negative setup. ★★☆☆☆ confidence. Price window: 15. Trend: Bottoming Attempt; gauge 29. In combination, liquidity confirms the move.
- Early improvement from bearish zone (bottoming attempt)
- Price holds above 8w & 26w averages
- Liquidity confirms the price trend
- Solid multi-week performance
- Momentum is weak/falling
- High return volatility raises whipsaw risk
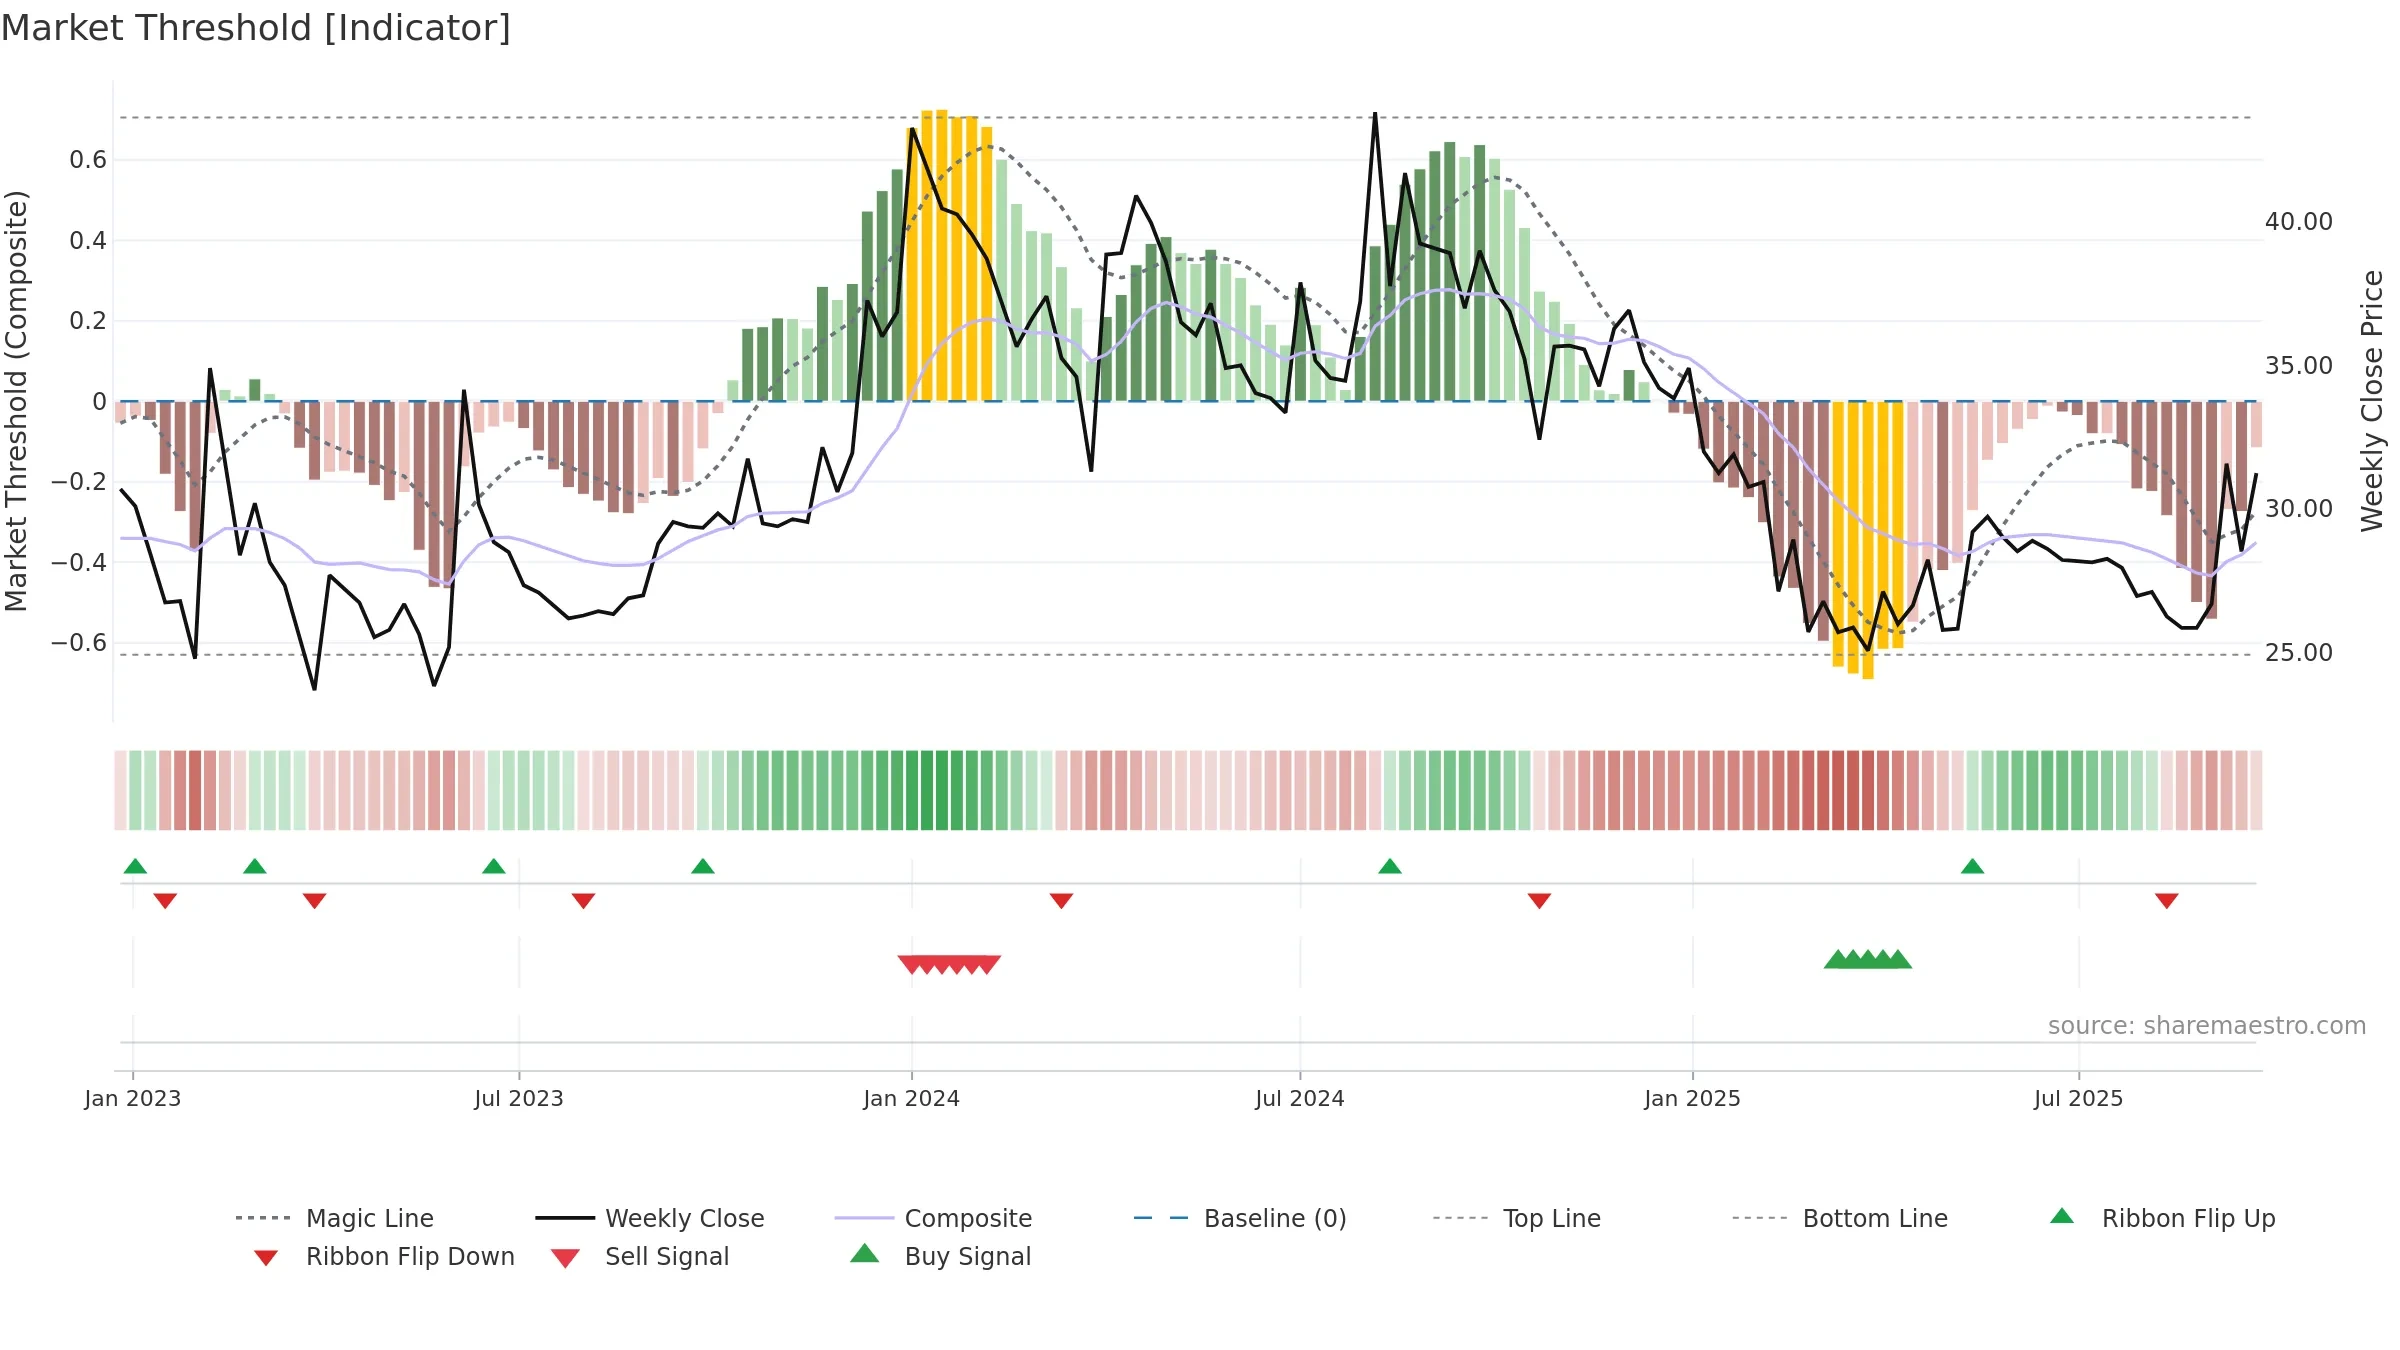
Why: Price window 15.23% over 8w. Close is -1.04% below the prior-window high. Return volatility 5.92%. Volume trend rising. Liquidity convergence with price. Trend state bottoming attempt. Low-regime (≤0.25) upticks 2/2 (100.0%) • Accumulating. Momentum bearish and falling. Valuation limited upside without catalysts.
Tip: Most metrics include a hover tooltip where they appear in the report.