Jupiter Fund Management Plc
JUP LSE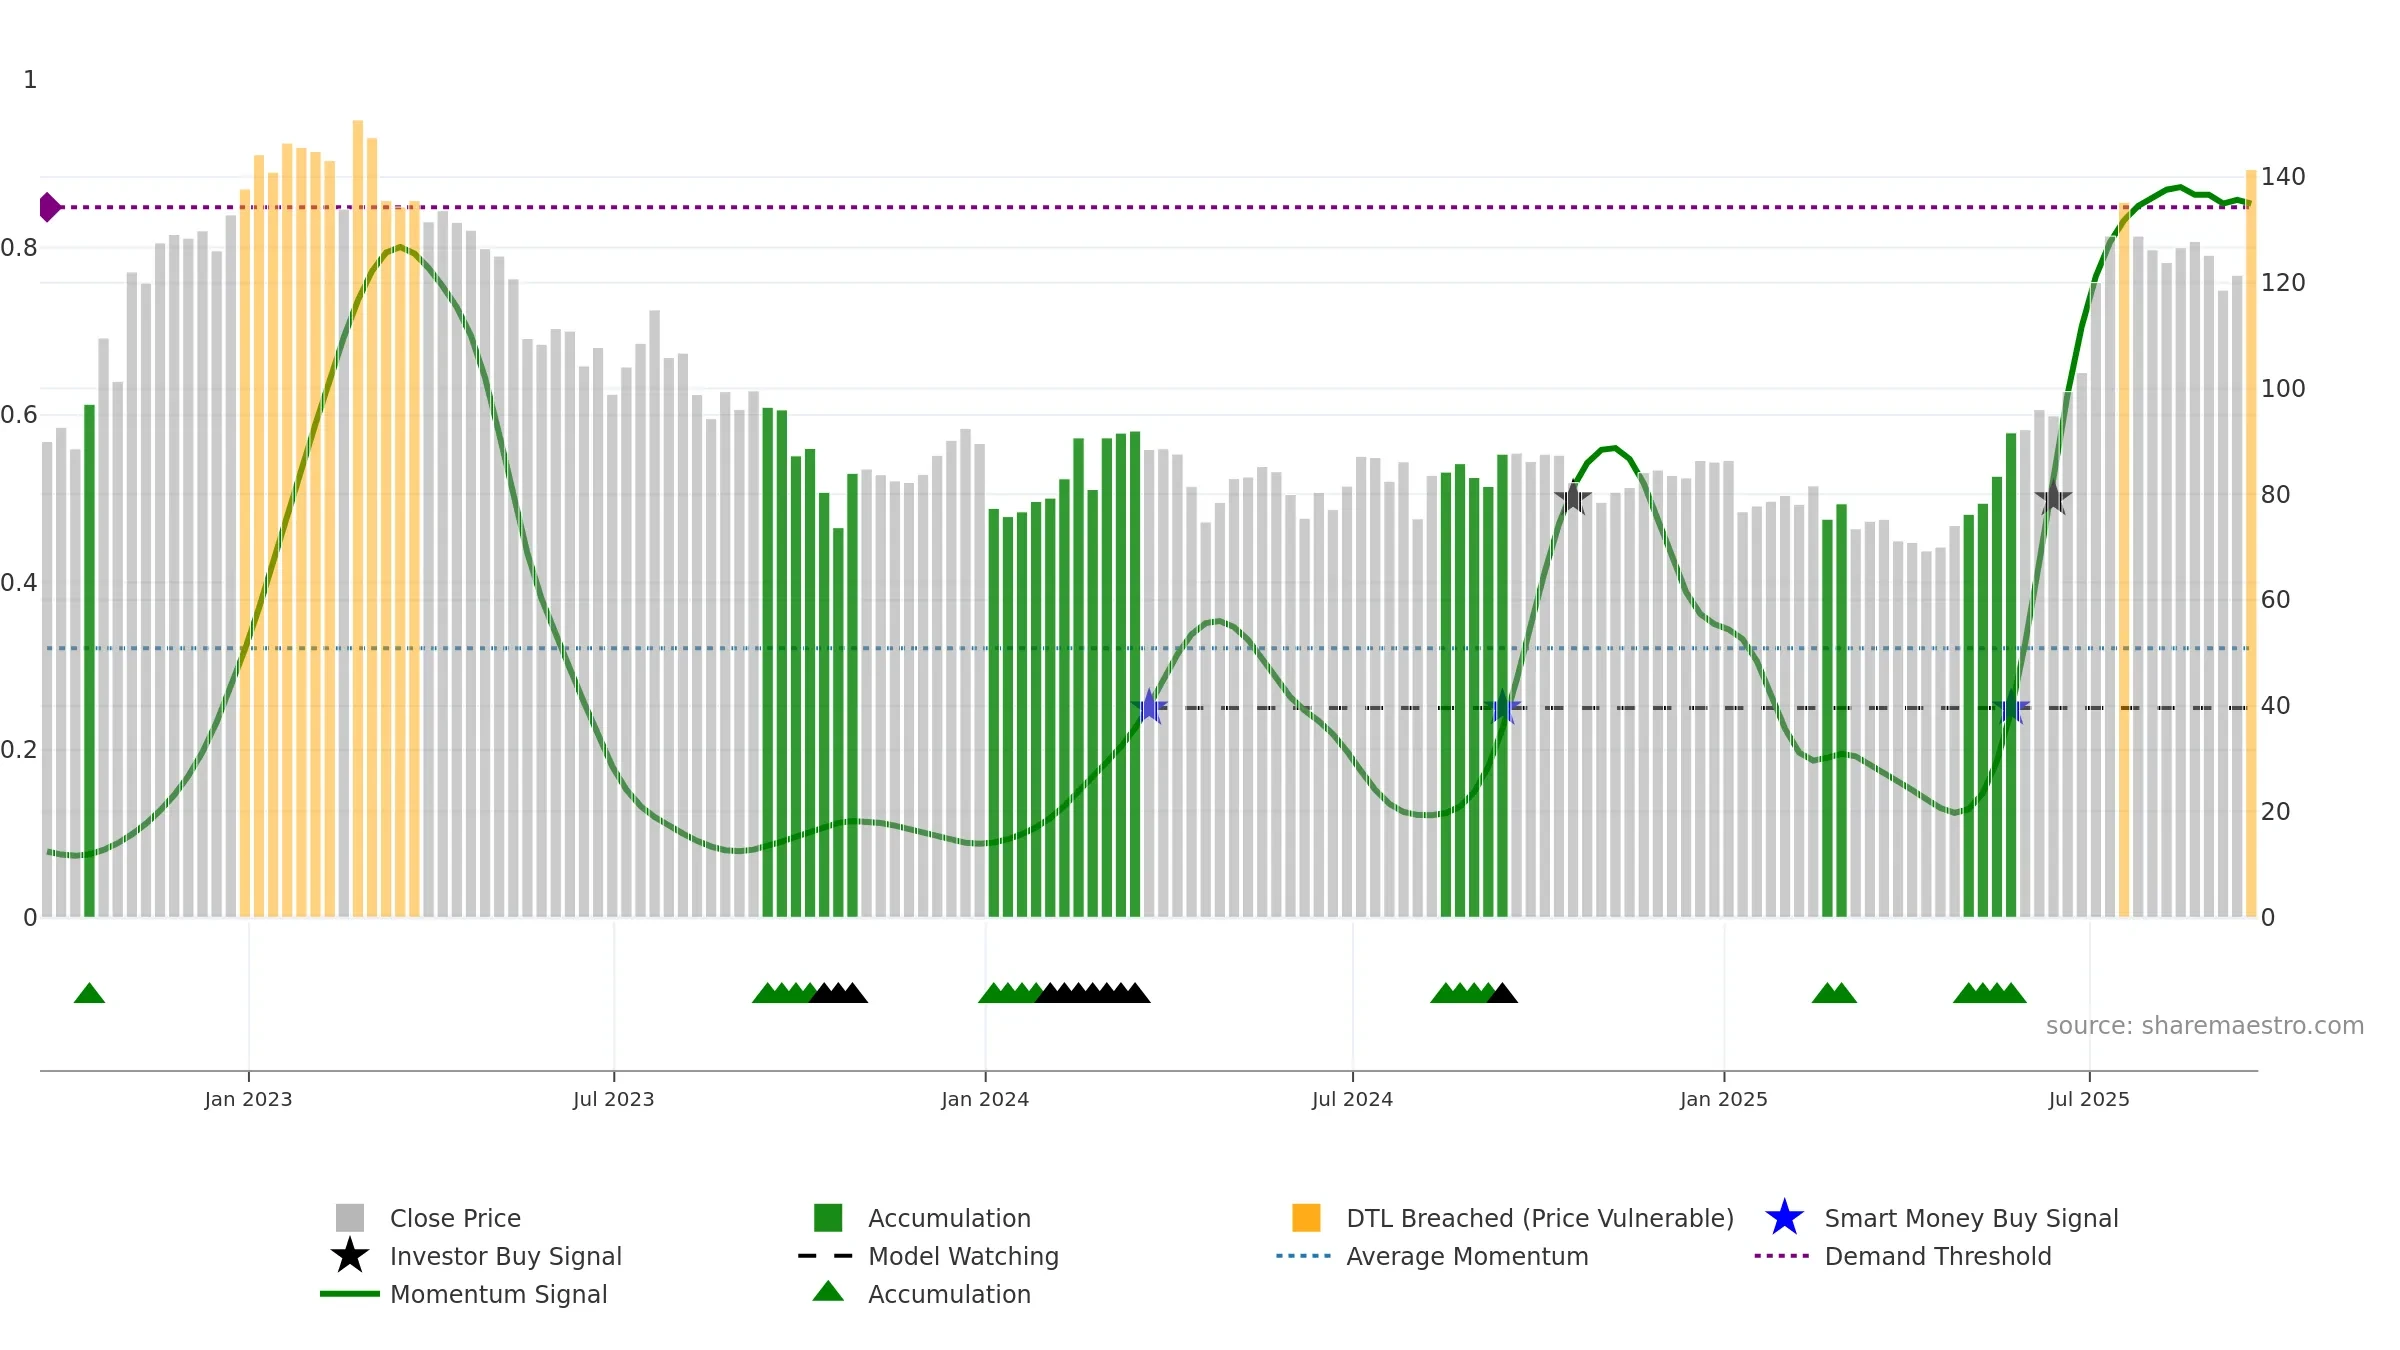
Weekly Report
Jupiter Fund Management Plc closed at 141.4000 (0.00% WoW) . Data window ends Fri, 19 Sep 2025.
How to read this — Price slope is upward, indicating persistent buying over the window. Low weekly volatility favours steadier follow-through. Volume and price are moving in the same direction — a constructive confirmation. Returns are positively correlated with volume — strength tends to arrive on higher activity. Constructive MA stack supports the up-drift; pullbacks may find support at the 8–13 week region. Fresh short-term crossover improves near-term tone. Price holds above key averages, indicating constructive participation.
Up-slope supports buying interest; pullbacks may be contained if activity stays firm.
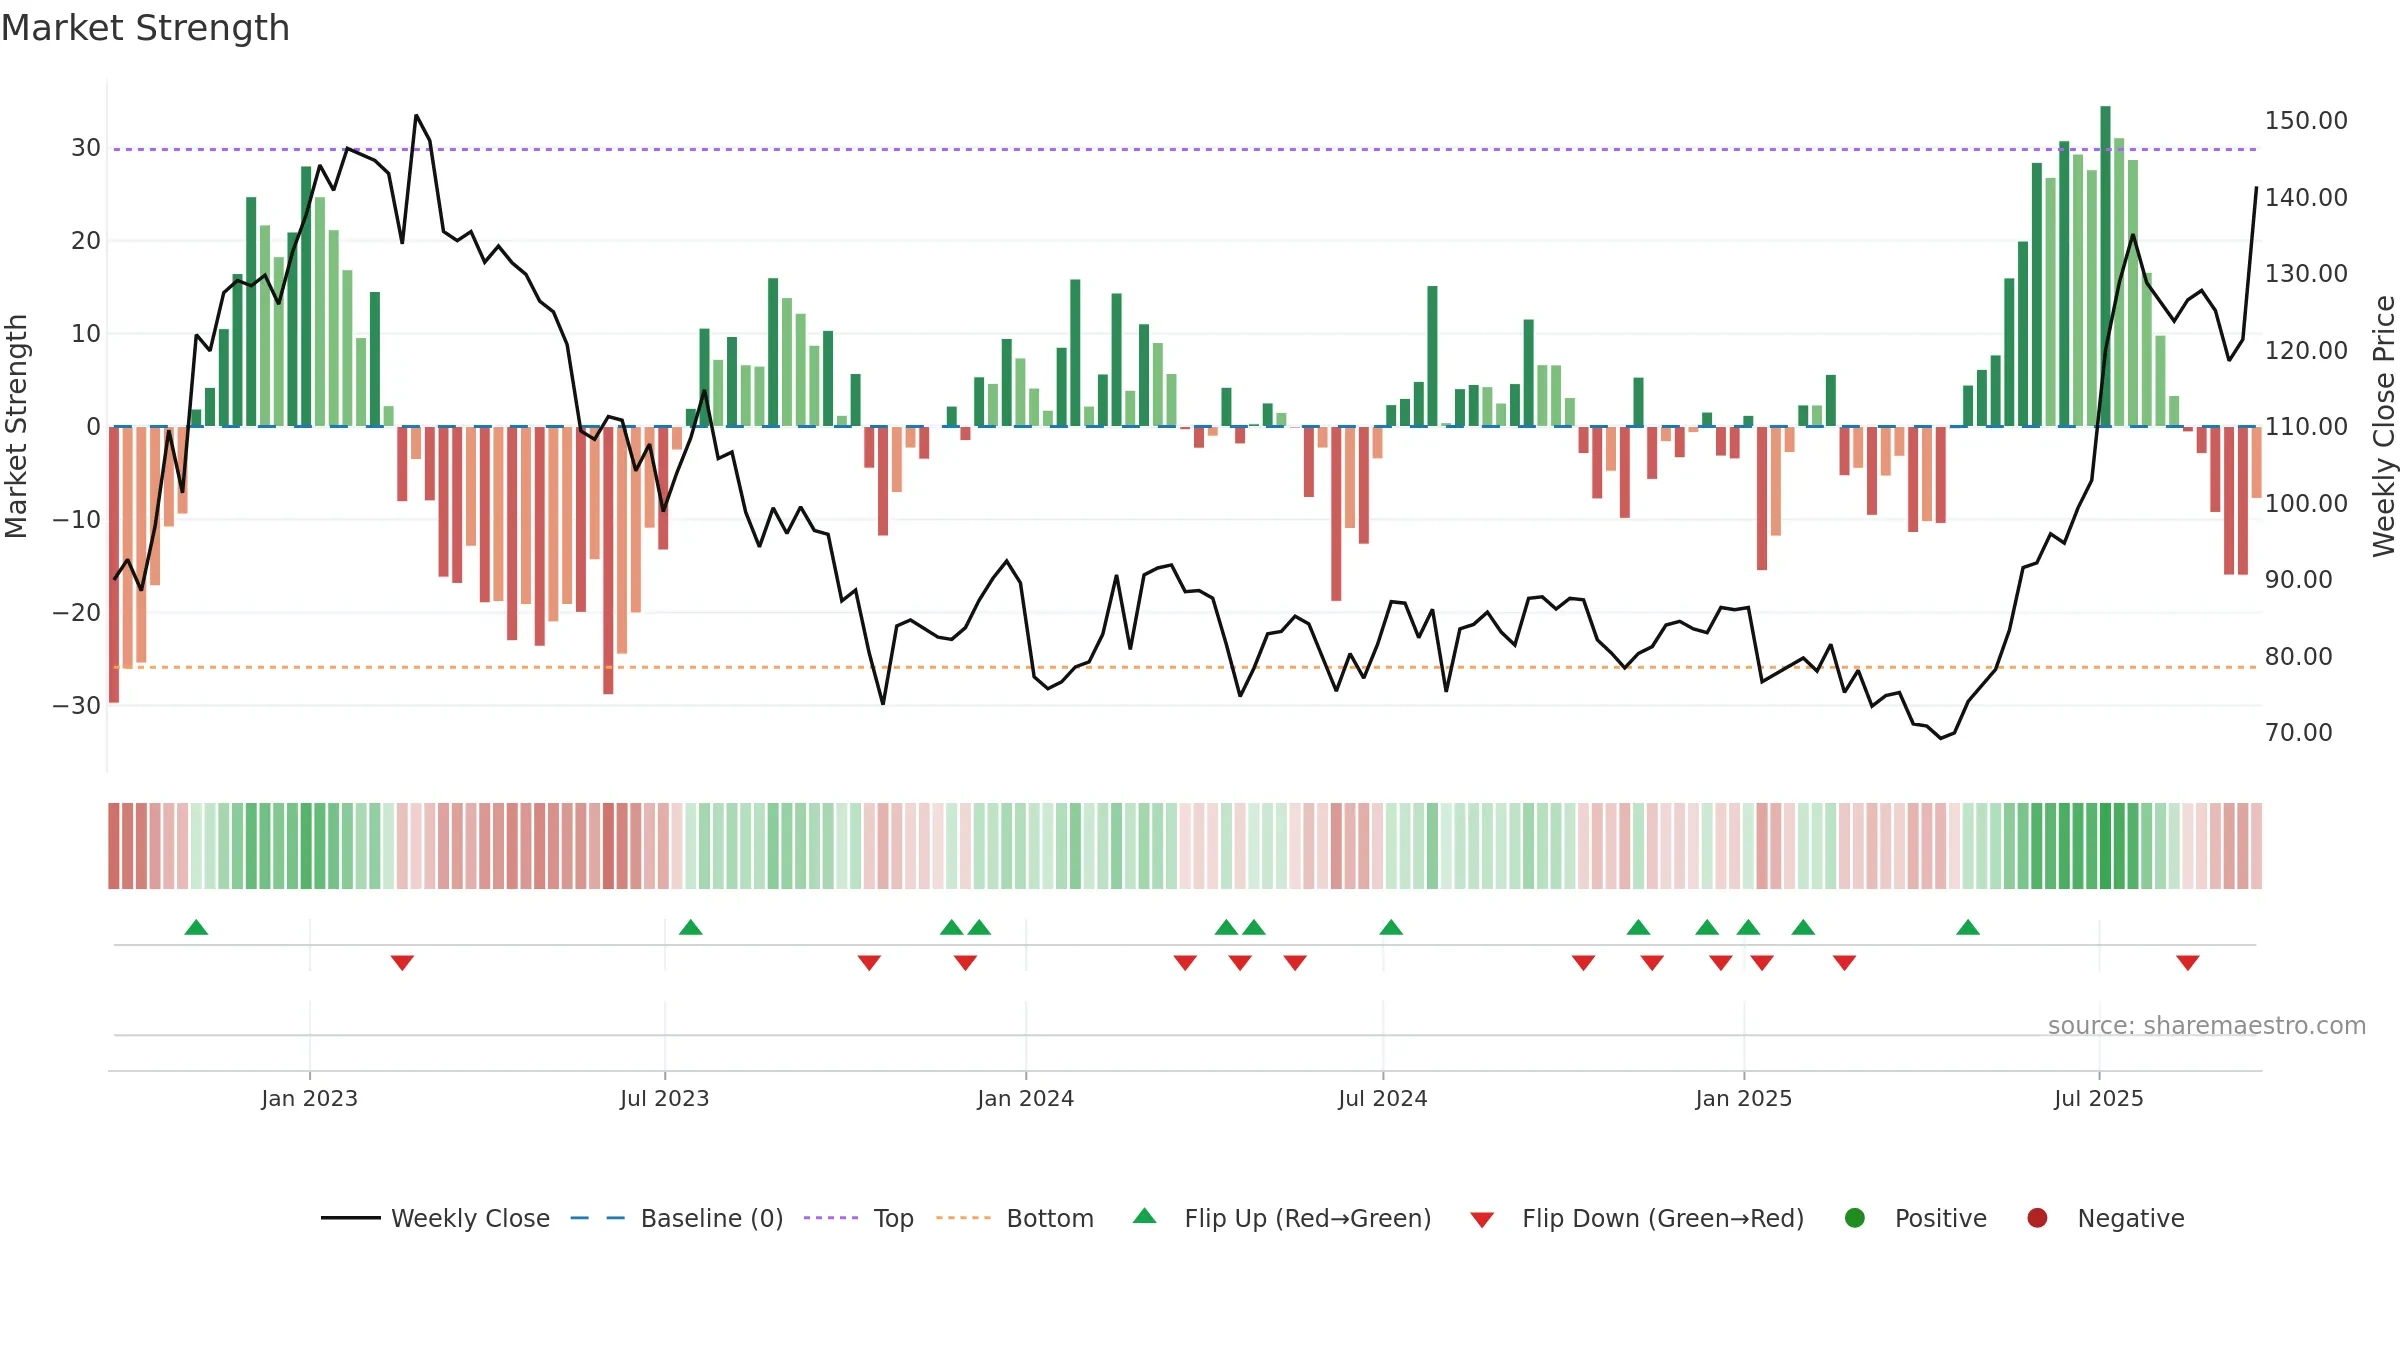
Gauge maps the trend signal to a 0–100 scale.
How to read this — Gauge is elevated but momentum is rolling over; topping risk is rising.
Stay alert: protect gains or seek confirmation before adding risk.
The flag is positive: favourable upside skew with supportive conditions.
Conclusion
Neutral setup. ★★★☆☆ confidence. Price window: 12. Trend: Uptrend at Risk; gauge 85. In combination, liquidity confirms the move.
- Price holds above 8w & 26w averages
- Constructive moving-average stack
- Liquidity confirms the price trend
- Low return volatility supports durability
- High-level but rolling over (topping risk)
- Momentum is weak/falling
Why: Price window 12.04% over 8w. Close is 10.64% above the prior-window high. Return volatility 1.36%. Volume trend rising. Liquidity convergence with price. Trend state uptrend at risk. High-regime (0.80–1.00) downticks 3/7 (43.0%) • Accumulating. MA stack constructive. 4–8w crossover bullish. Momentum neutral and falling. Valuation stance positive.
Tip: Most metrics include a hover tooltip where they appear in the report.