Weekly Report
iShares Select U.S. REIT ETF closed at 60.6000 (-0.56% WoW) . Data window ends Fri, 19 Sep 2025.
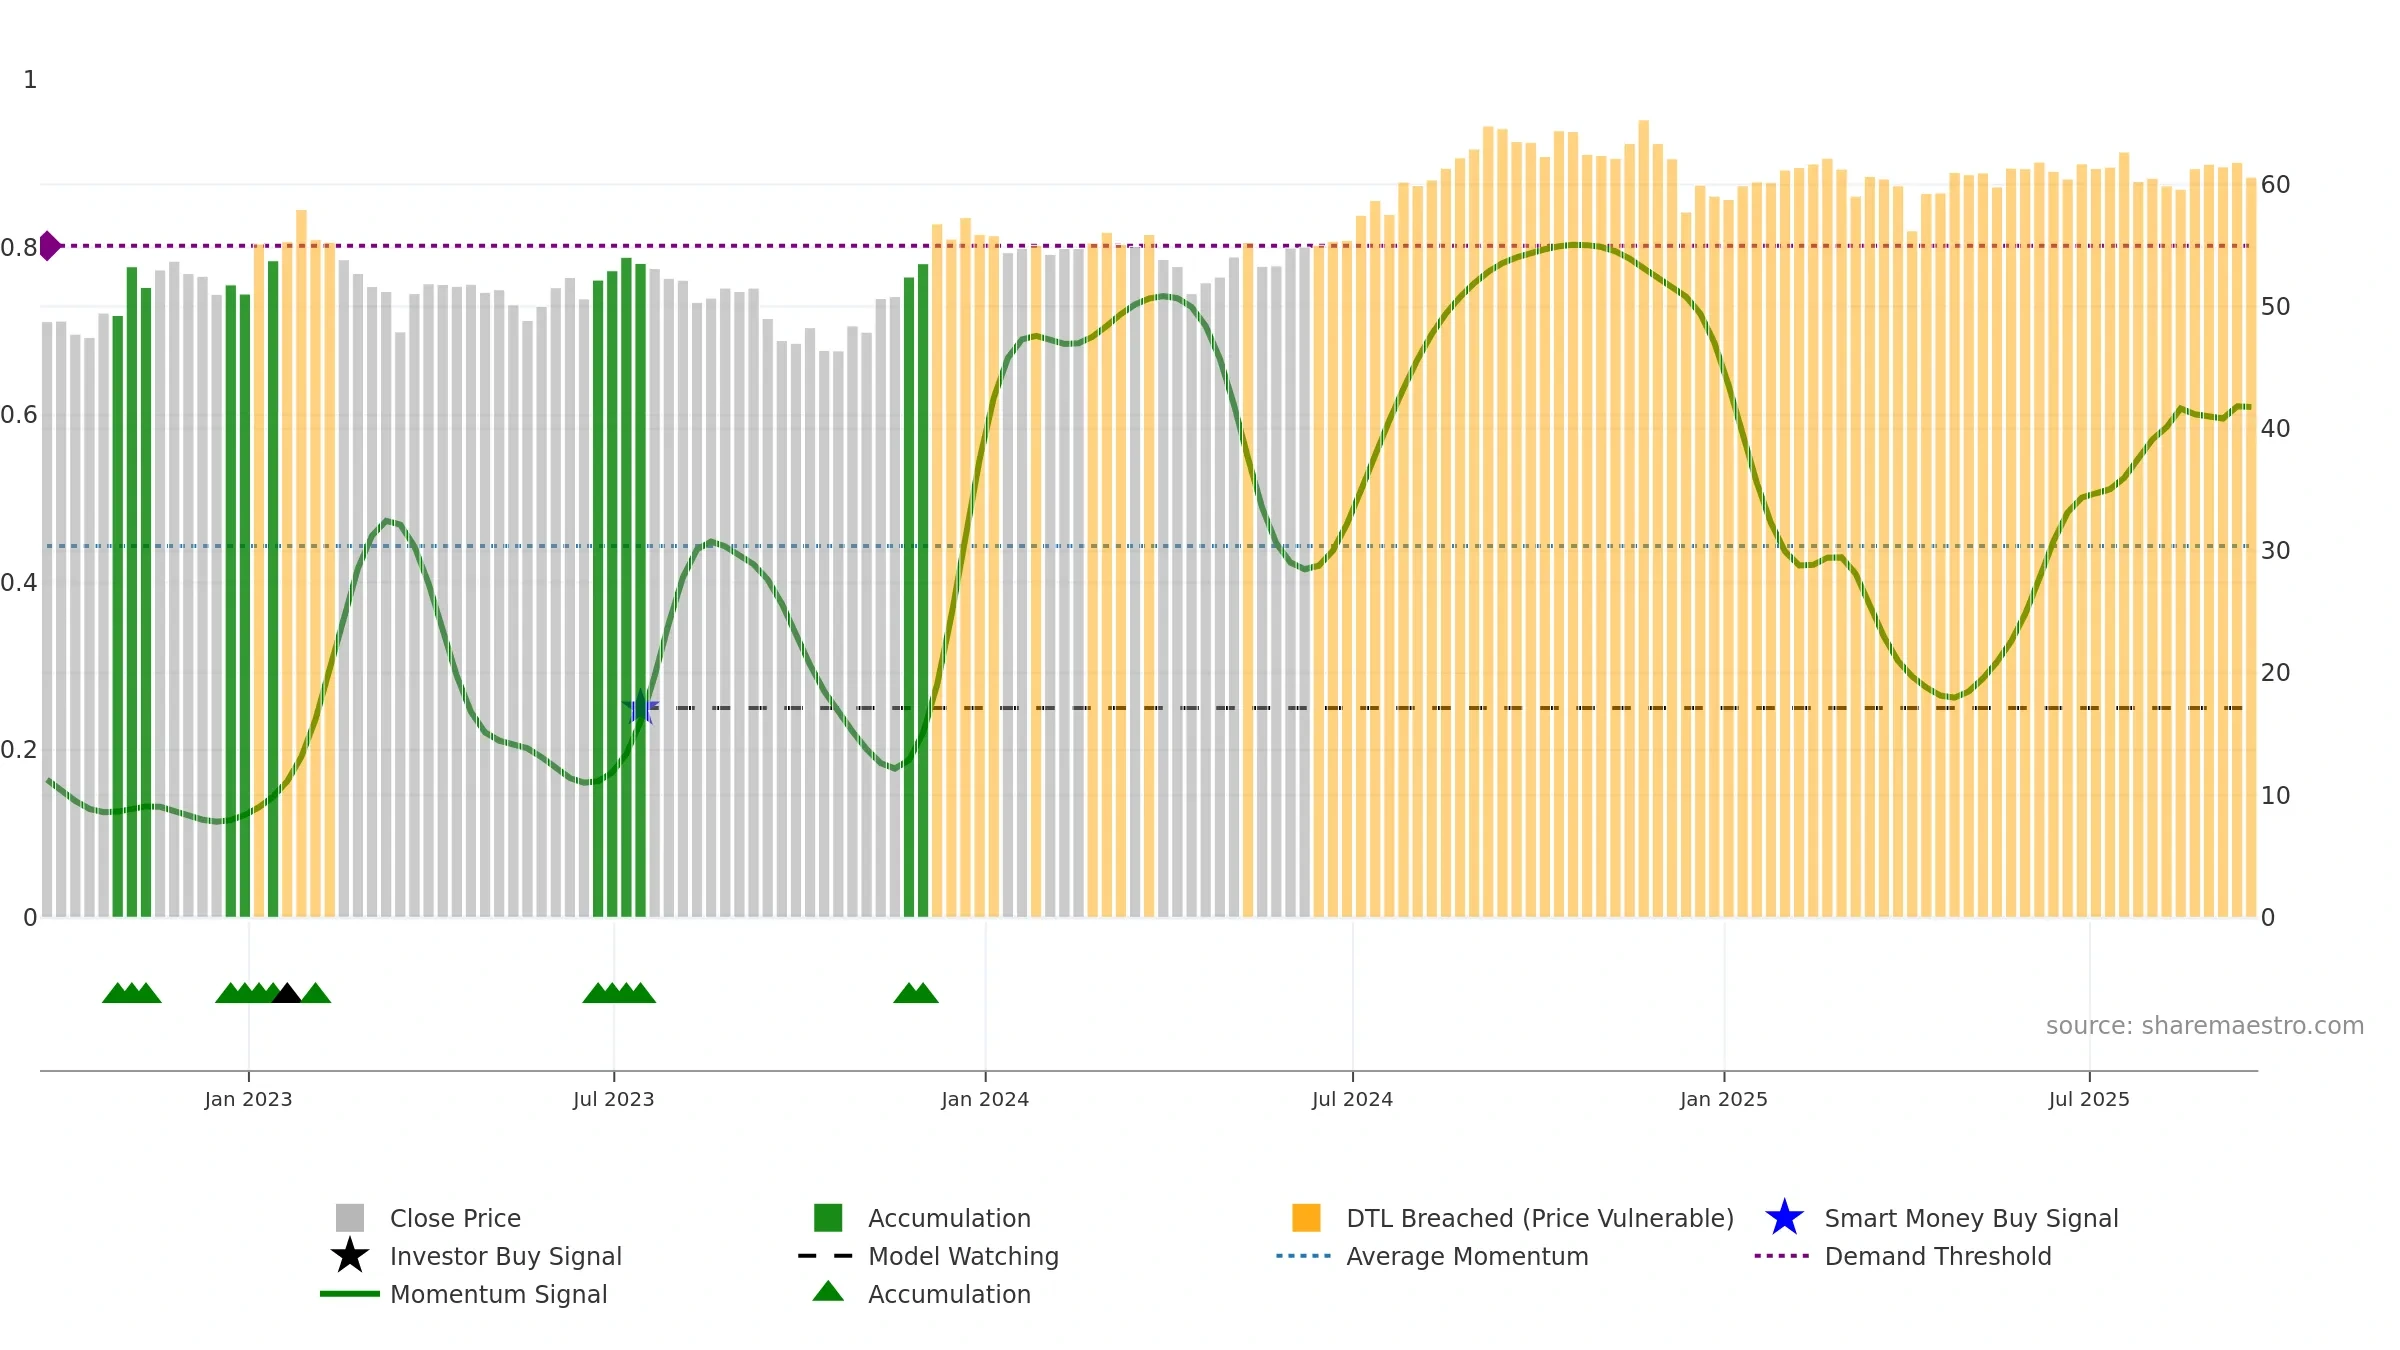
How to read this — Price slope is upward, indicating persistent buying over the window. Low weekly volatility favours steadier follow-through. Volume trend diverges from price — watch for fatigue or rotation. Accumulation weeks: 1; distribution weeks: 3. Price sits below key averages, keeping pressure on the tape.
Up-slope supports buying interest; pullbacks may be contained if activity stays firm. Because liquidity isn’t confirming, prefer evidence of fresh demand before chasing moves.
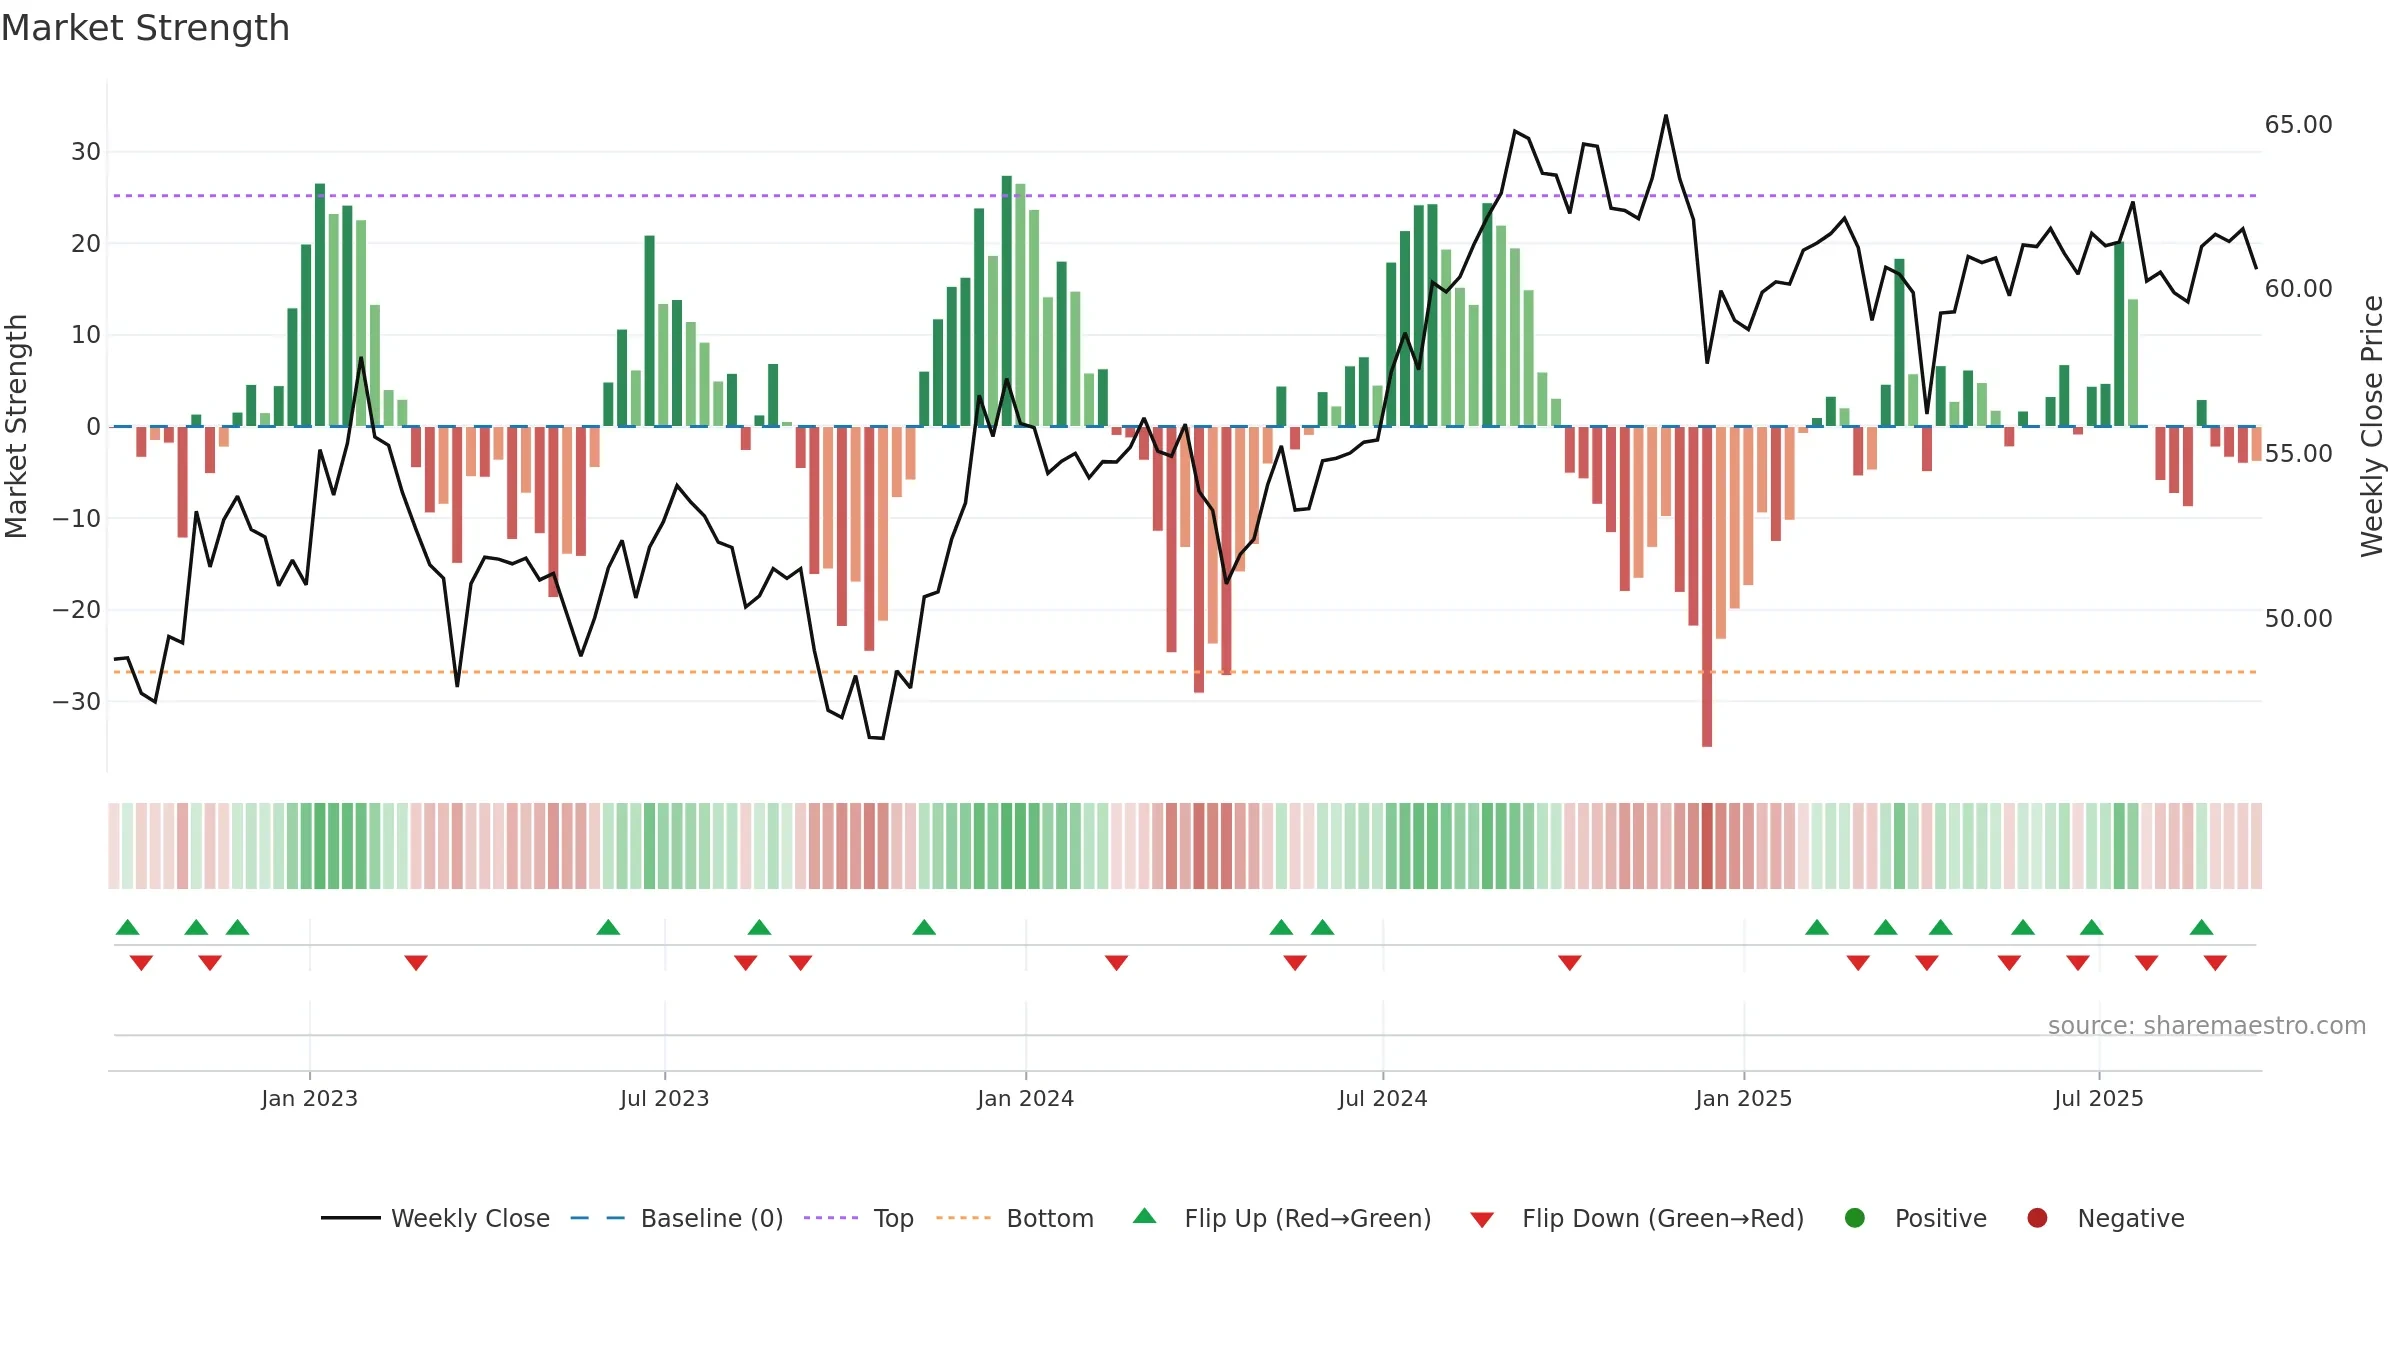
Gauge maps the trend signal to a 0–100 scale.
How to read this — Bullish gauge levels imply persistent upside pressure. A rising gauge shows momentum building rather than fading. Deceleration reduces the odds of persistence.
Constructive backdrop; dips are more likely to find support while the gauge stays high and rising.
Conclusion
Neutral setup. ★★★☆☆ confidence. Price window: 0. Trend: Bullish @ 60. In combination, liquidity diverges from price.
Why: Price window 0.15% over 8w. Close is -1.97% below the window high. Return volatility 0.63%. Volume trend falling. Liquidity divergence with price. Accumulation 1; distribution 3. MA stack mixed. Baseline deviation 0.09% (widening). Momentum bullish and rising. Acceleration decelerating. Gauge volatility low.
Tip: Most metrics also include a hover tooltip where they appear in the report.