GRG Metrology & Test Group Co., Ltd.
002967 SHE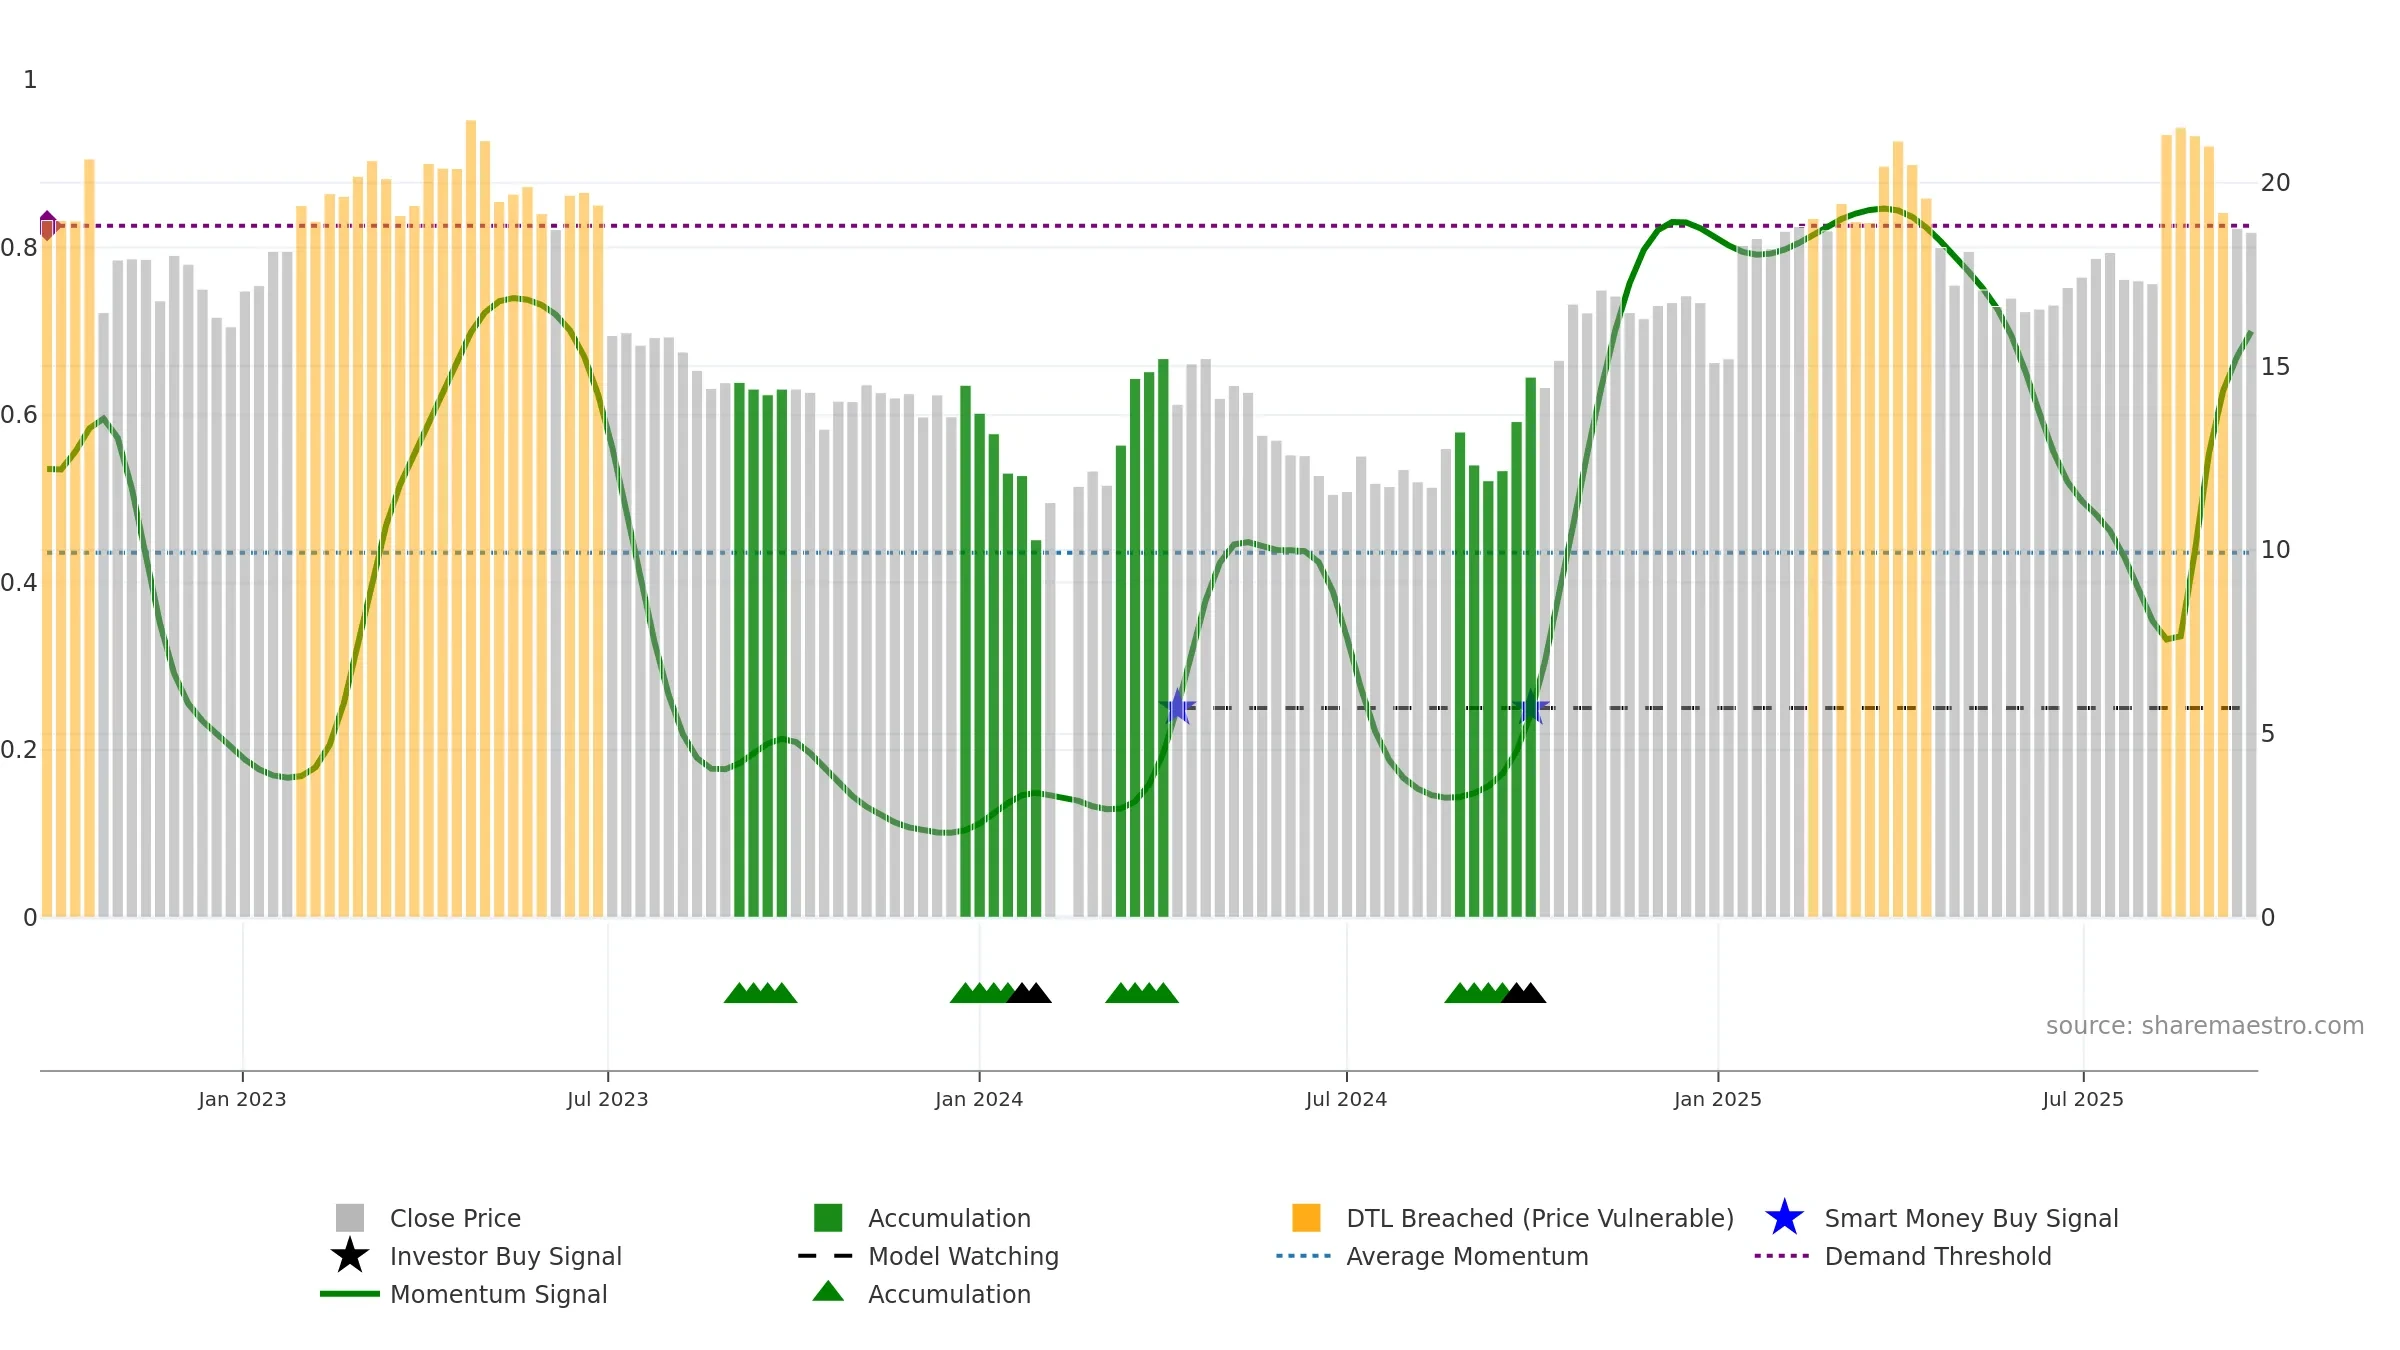
Weekly Summary
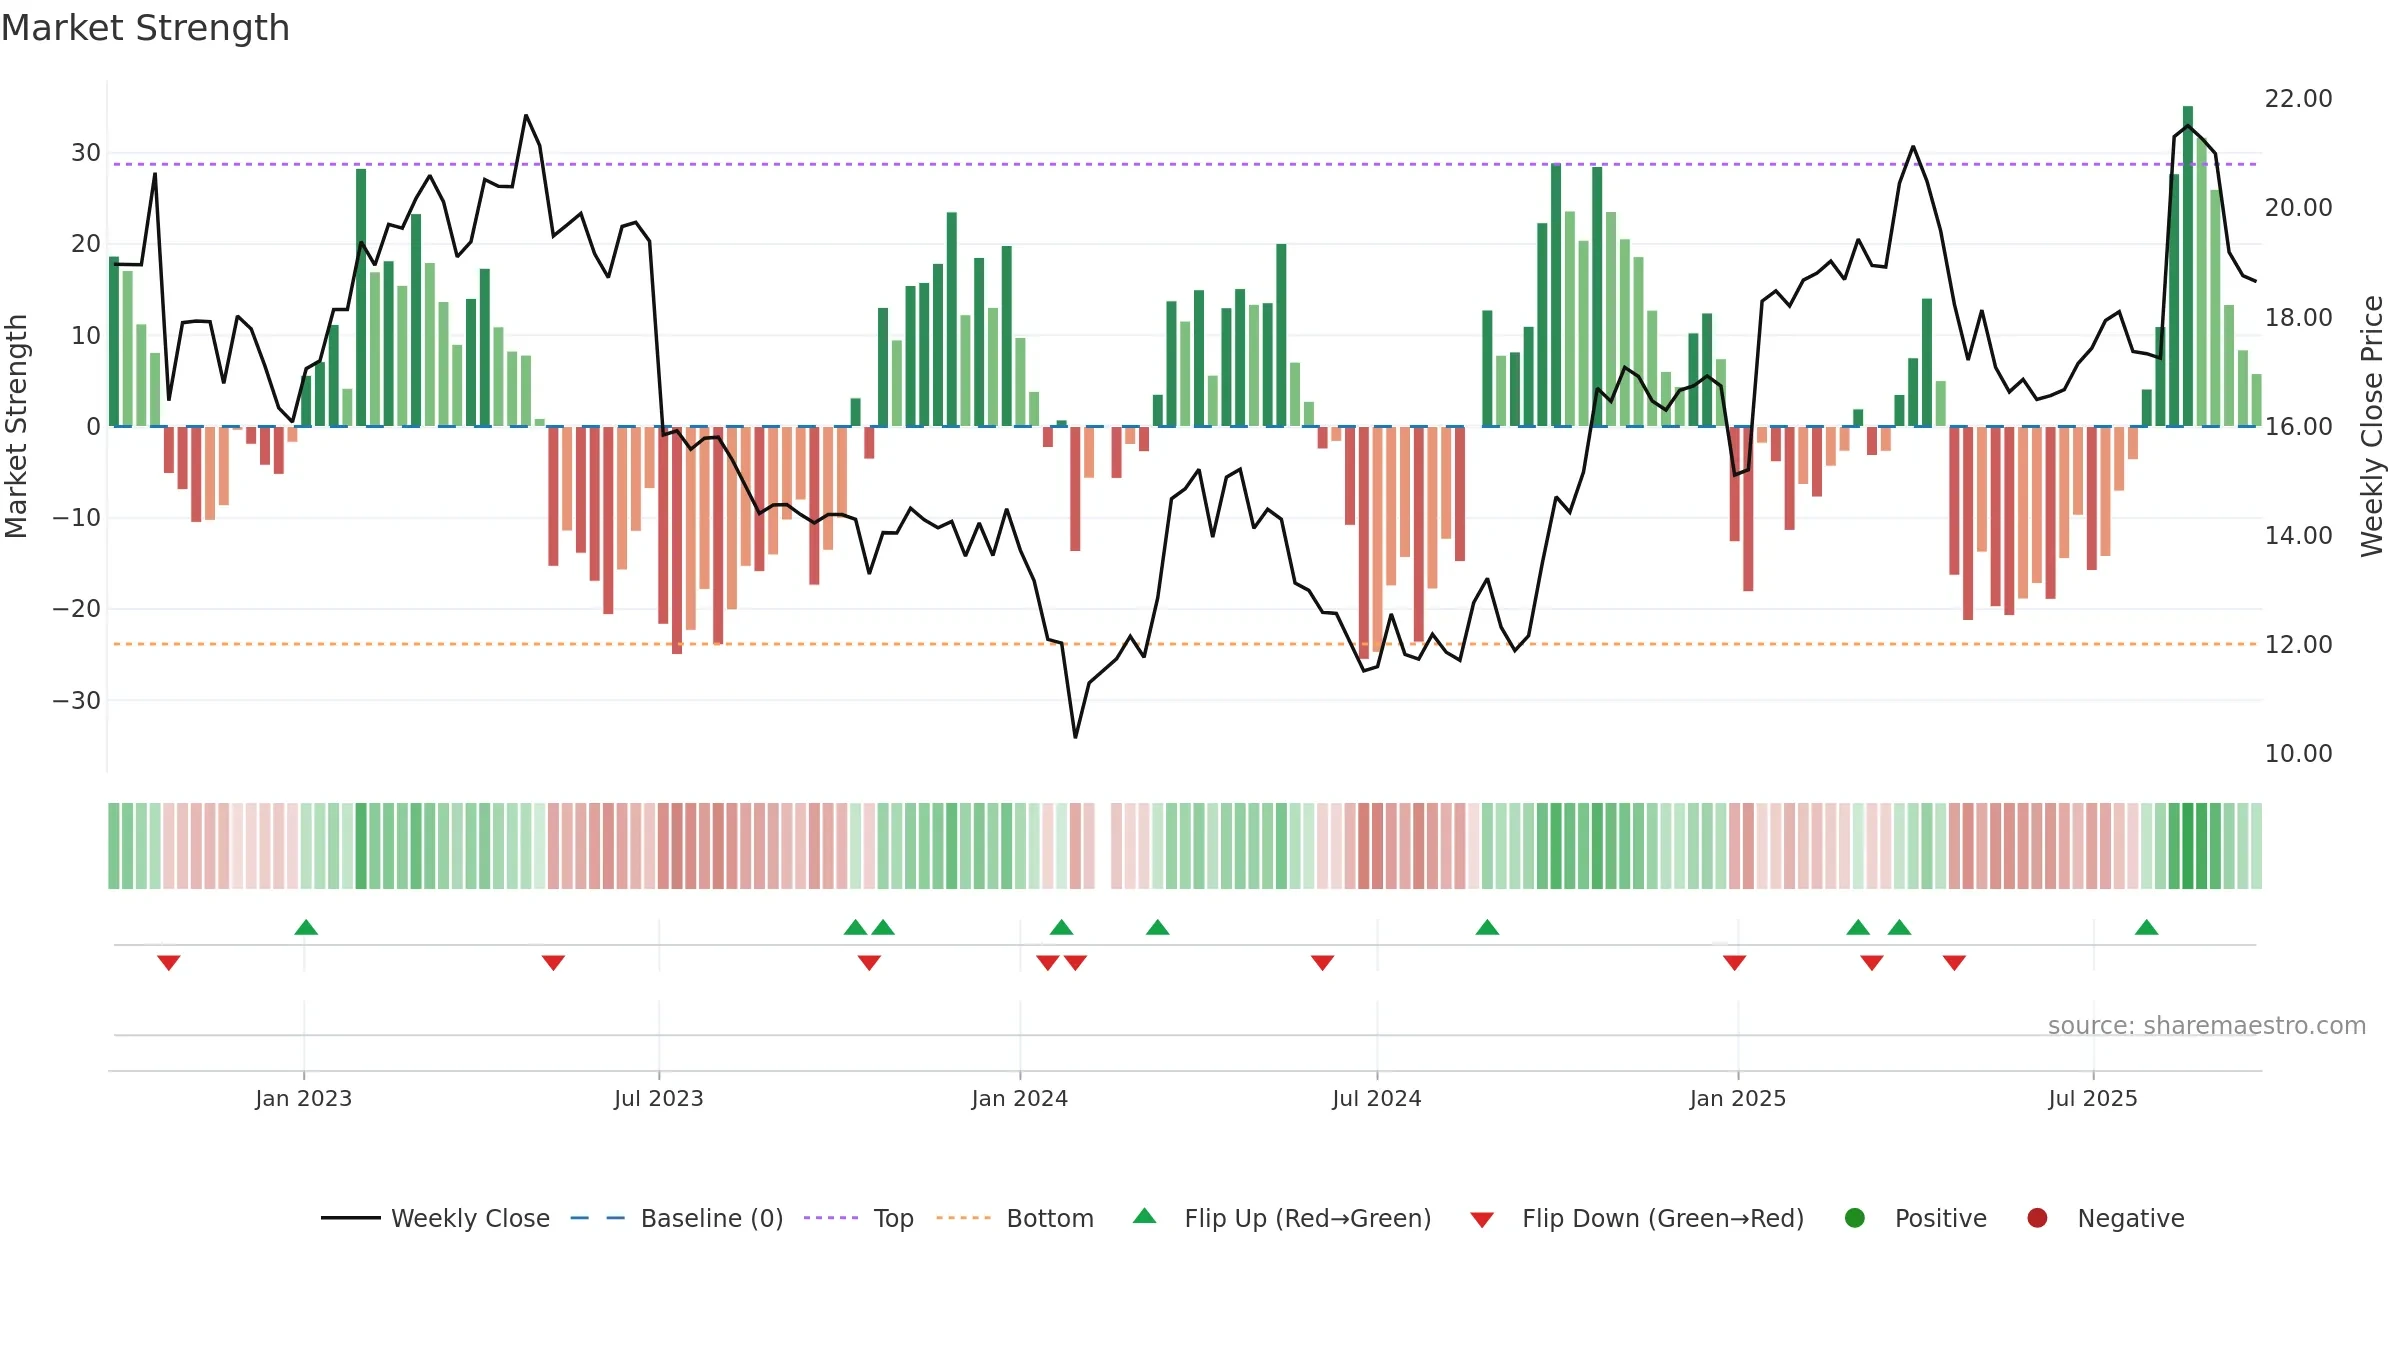
GRG Metrology & Test Group Co., Ltd. closed at 18.6500 (-0.80% WoW) . Data window ends Mon, 22 Sep 2025.
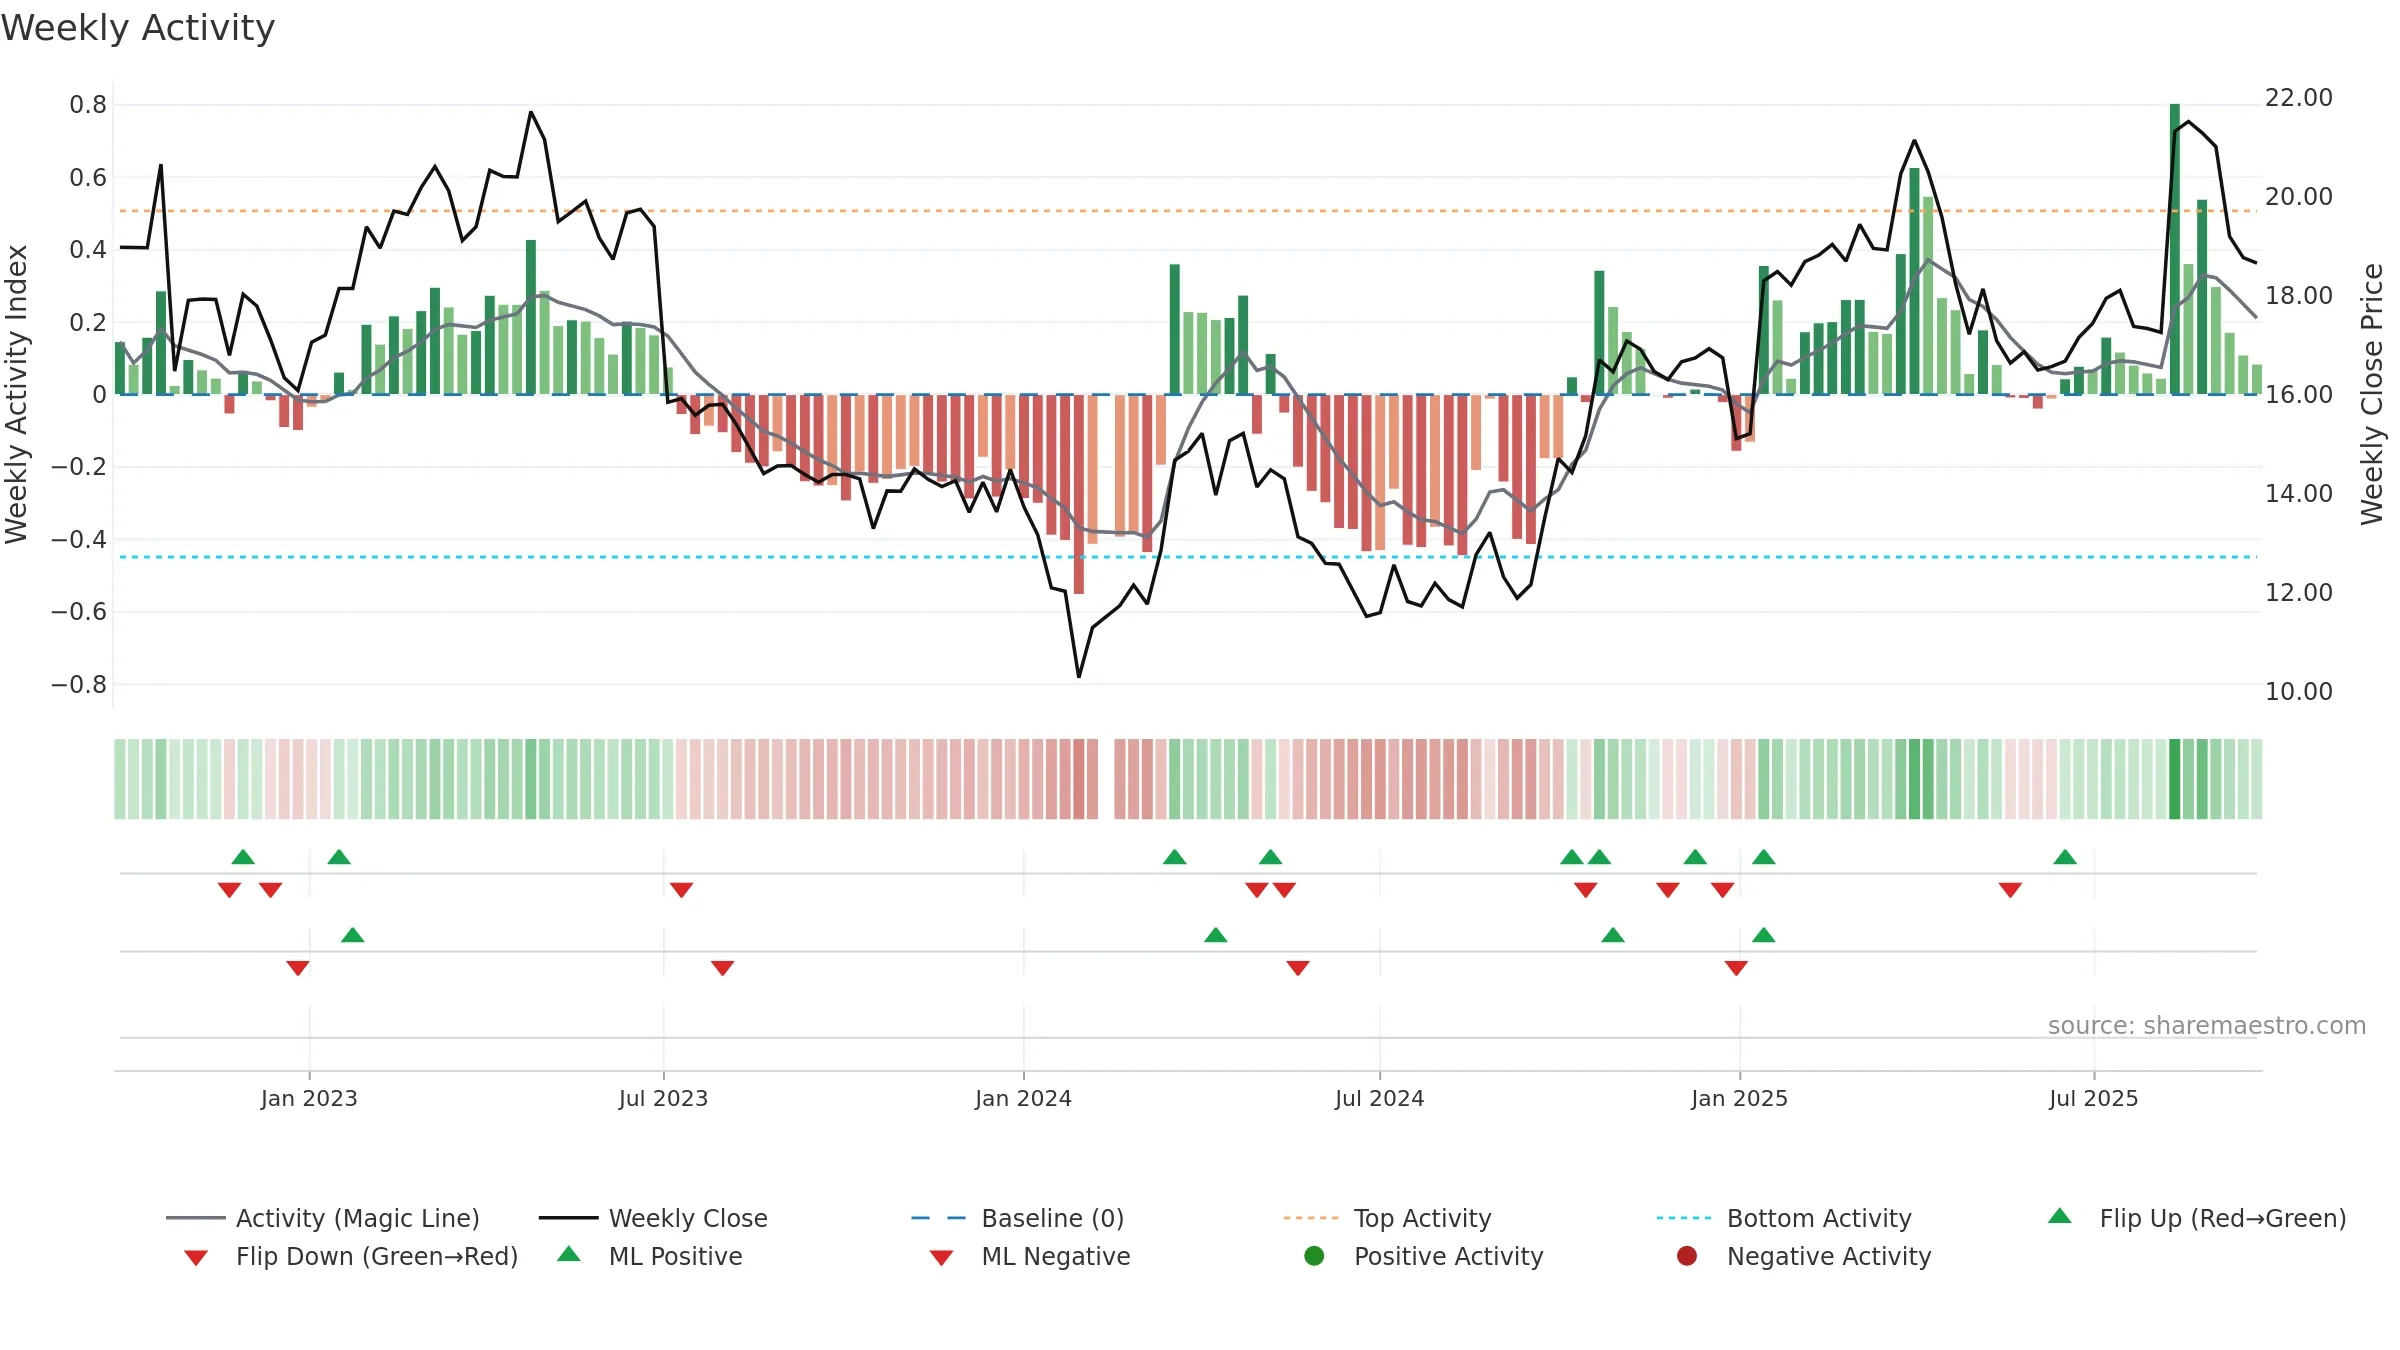
How to read this — Price slope is downward, indicating persistent supply pressure. Elevated weekly volatility increases whipsaw risk. Volume and price are moving in the same direction — a constructive confirmation. Returns are positively correlated with volume — strength tends to arrive on higher activity. Fresh short-term downside crossover weakens near-term tone.
Down-slope argues for patience; rallies can fade sooner unless participation improves.
Gauge maps the trend signal to a 0–100 scale.
How to read this — High gauge and rising momentum — buyers in control.
Bias remains higher; pullbacks could be buyable if participation holds.

Relative strength is Negative
(< 0%, underperforming).
Latest MRS: -9.87% (week ending Fri, 19 Sep 2025).
Slope: Rising over 8w.
Notes:
- Below zero line indicates relative weakness vs benchmark.
- MRS slope rising over ~8 weeks.
Price is above fair value; upside may be capped without catalysts.
Conclusion
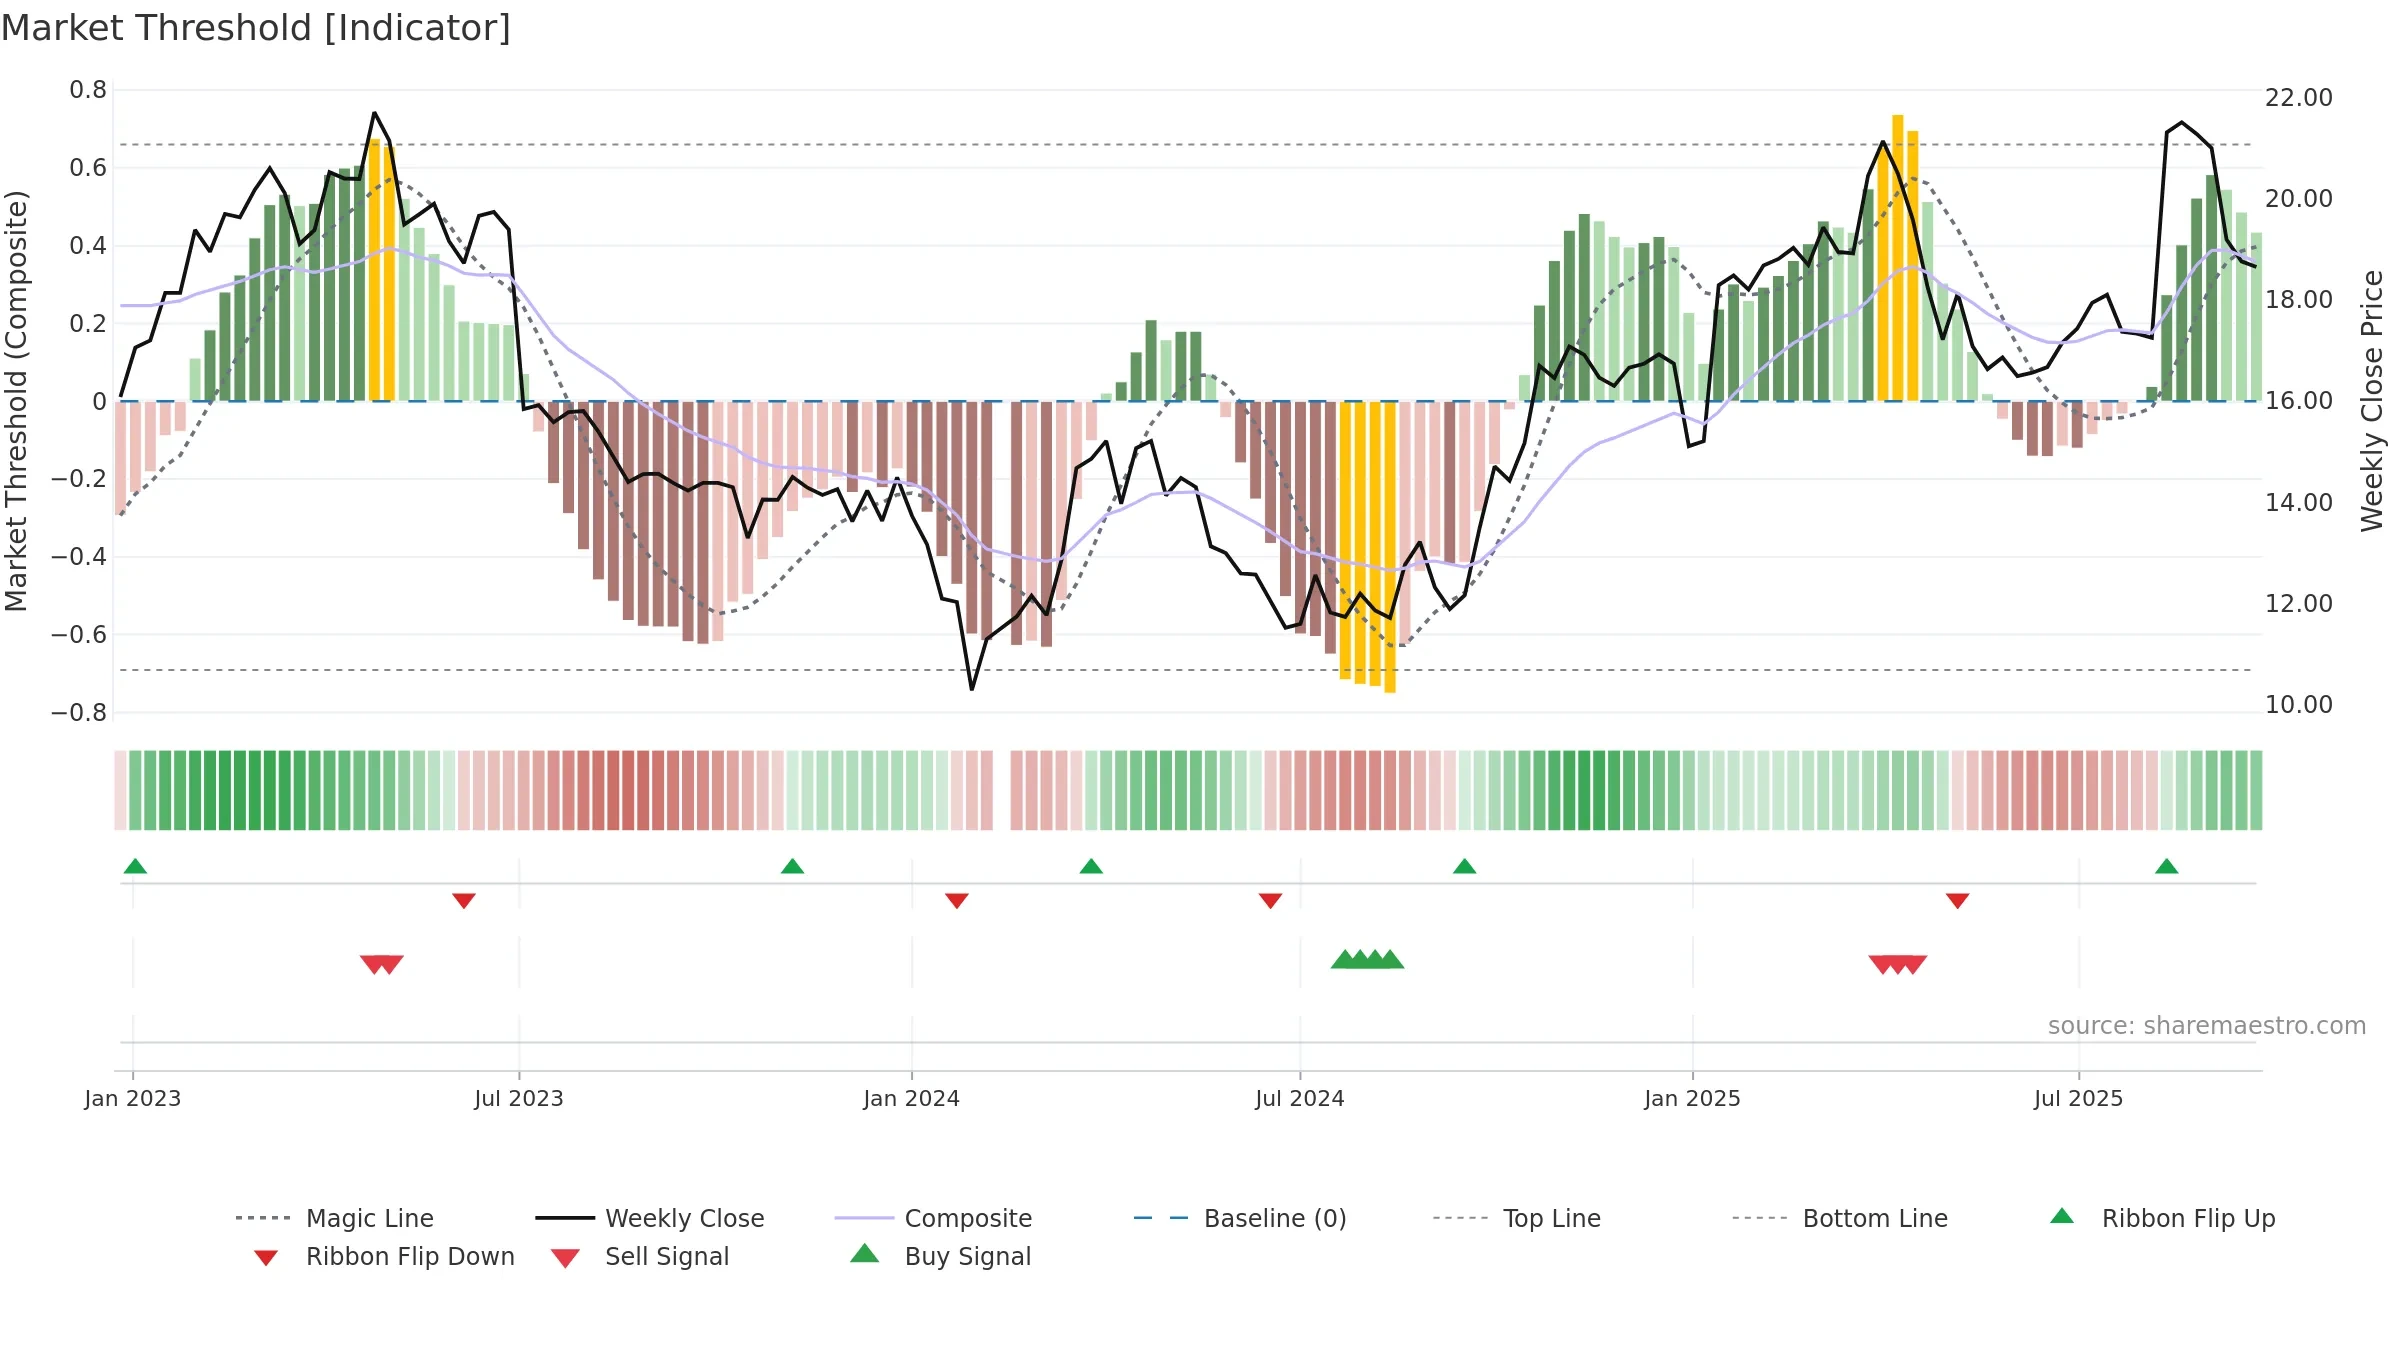
Neutral setup. ★★★☆☆ confidence. Price window: 8. Trend: Strong Uptrend; gauge 70. In combination, liquidity confirms the move.
- High gauge with rising momentum (strong uptrend)
- Momentum is bullish and rising
- Liquidity confirms the price trend
- Price is not above key averages
- High return volatility raises whipsaw risk
Why: Price window 8.12% over 8w. Close is -13.30% below the prior-window high. Return volatility 8.31%. Volume trend falling. Liquidity convergence with price. Trend state strong uptrend. 4–8w crossover bearish. Momentum bullish and rising. Valuation limited upside without catalysts.
Tip: Most metrics include a hover tooltip where they appear in the report.