Kung Sing Engineering Corporation
5521 TPE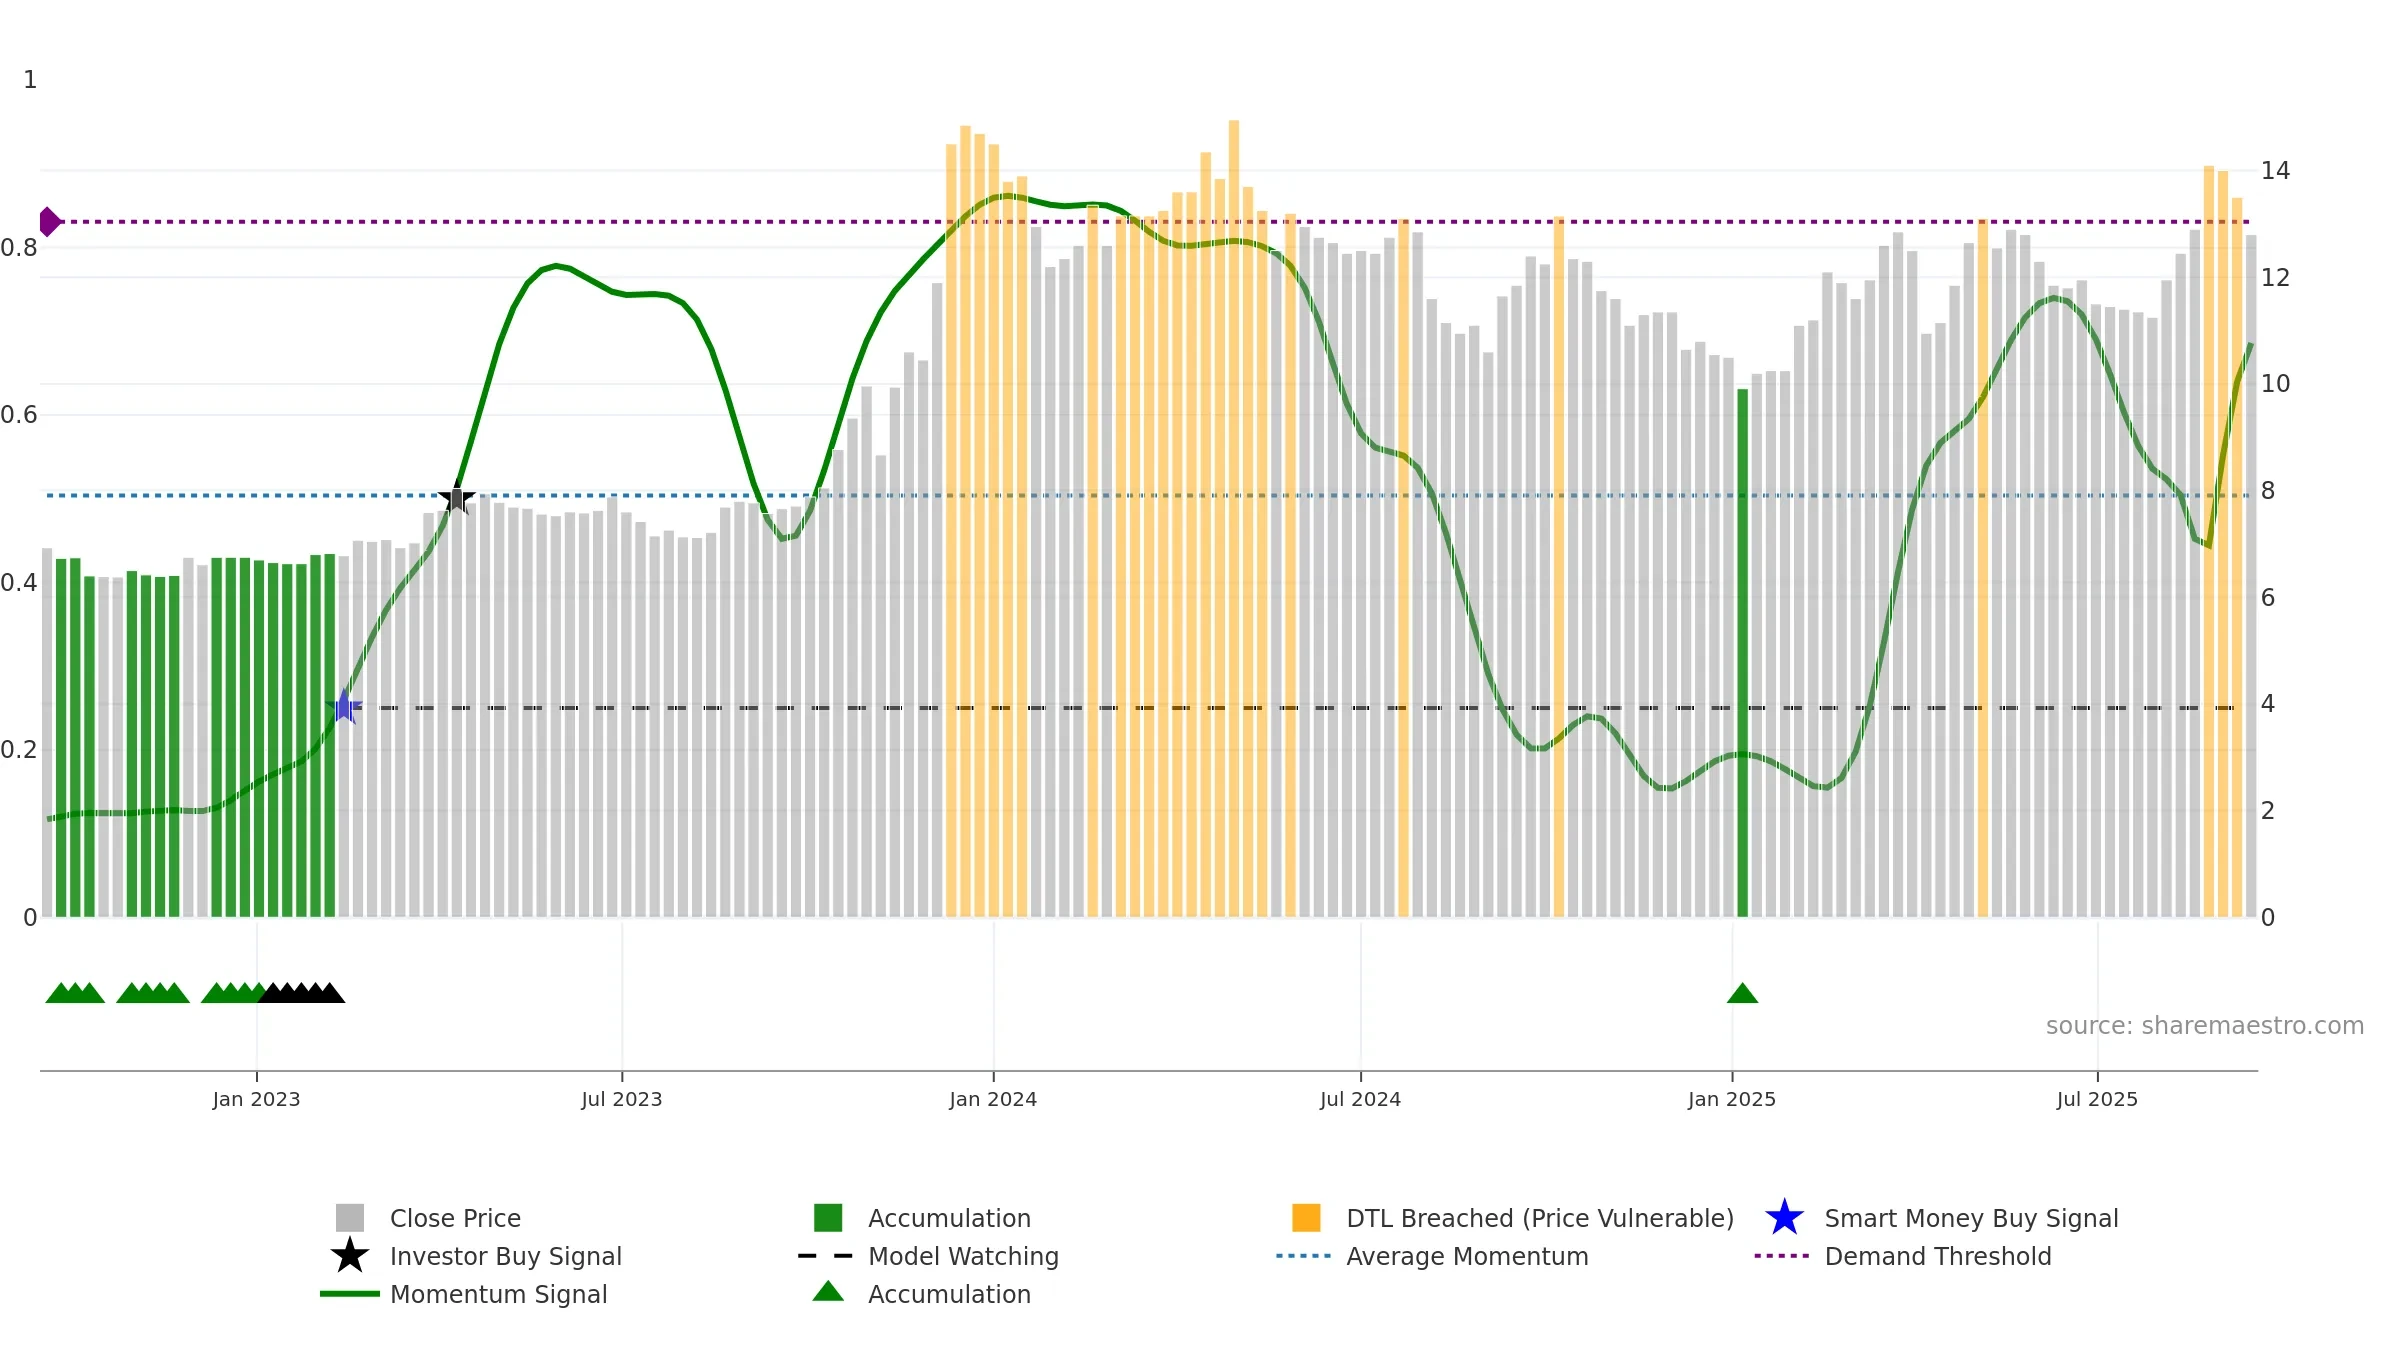
Weekly Report
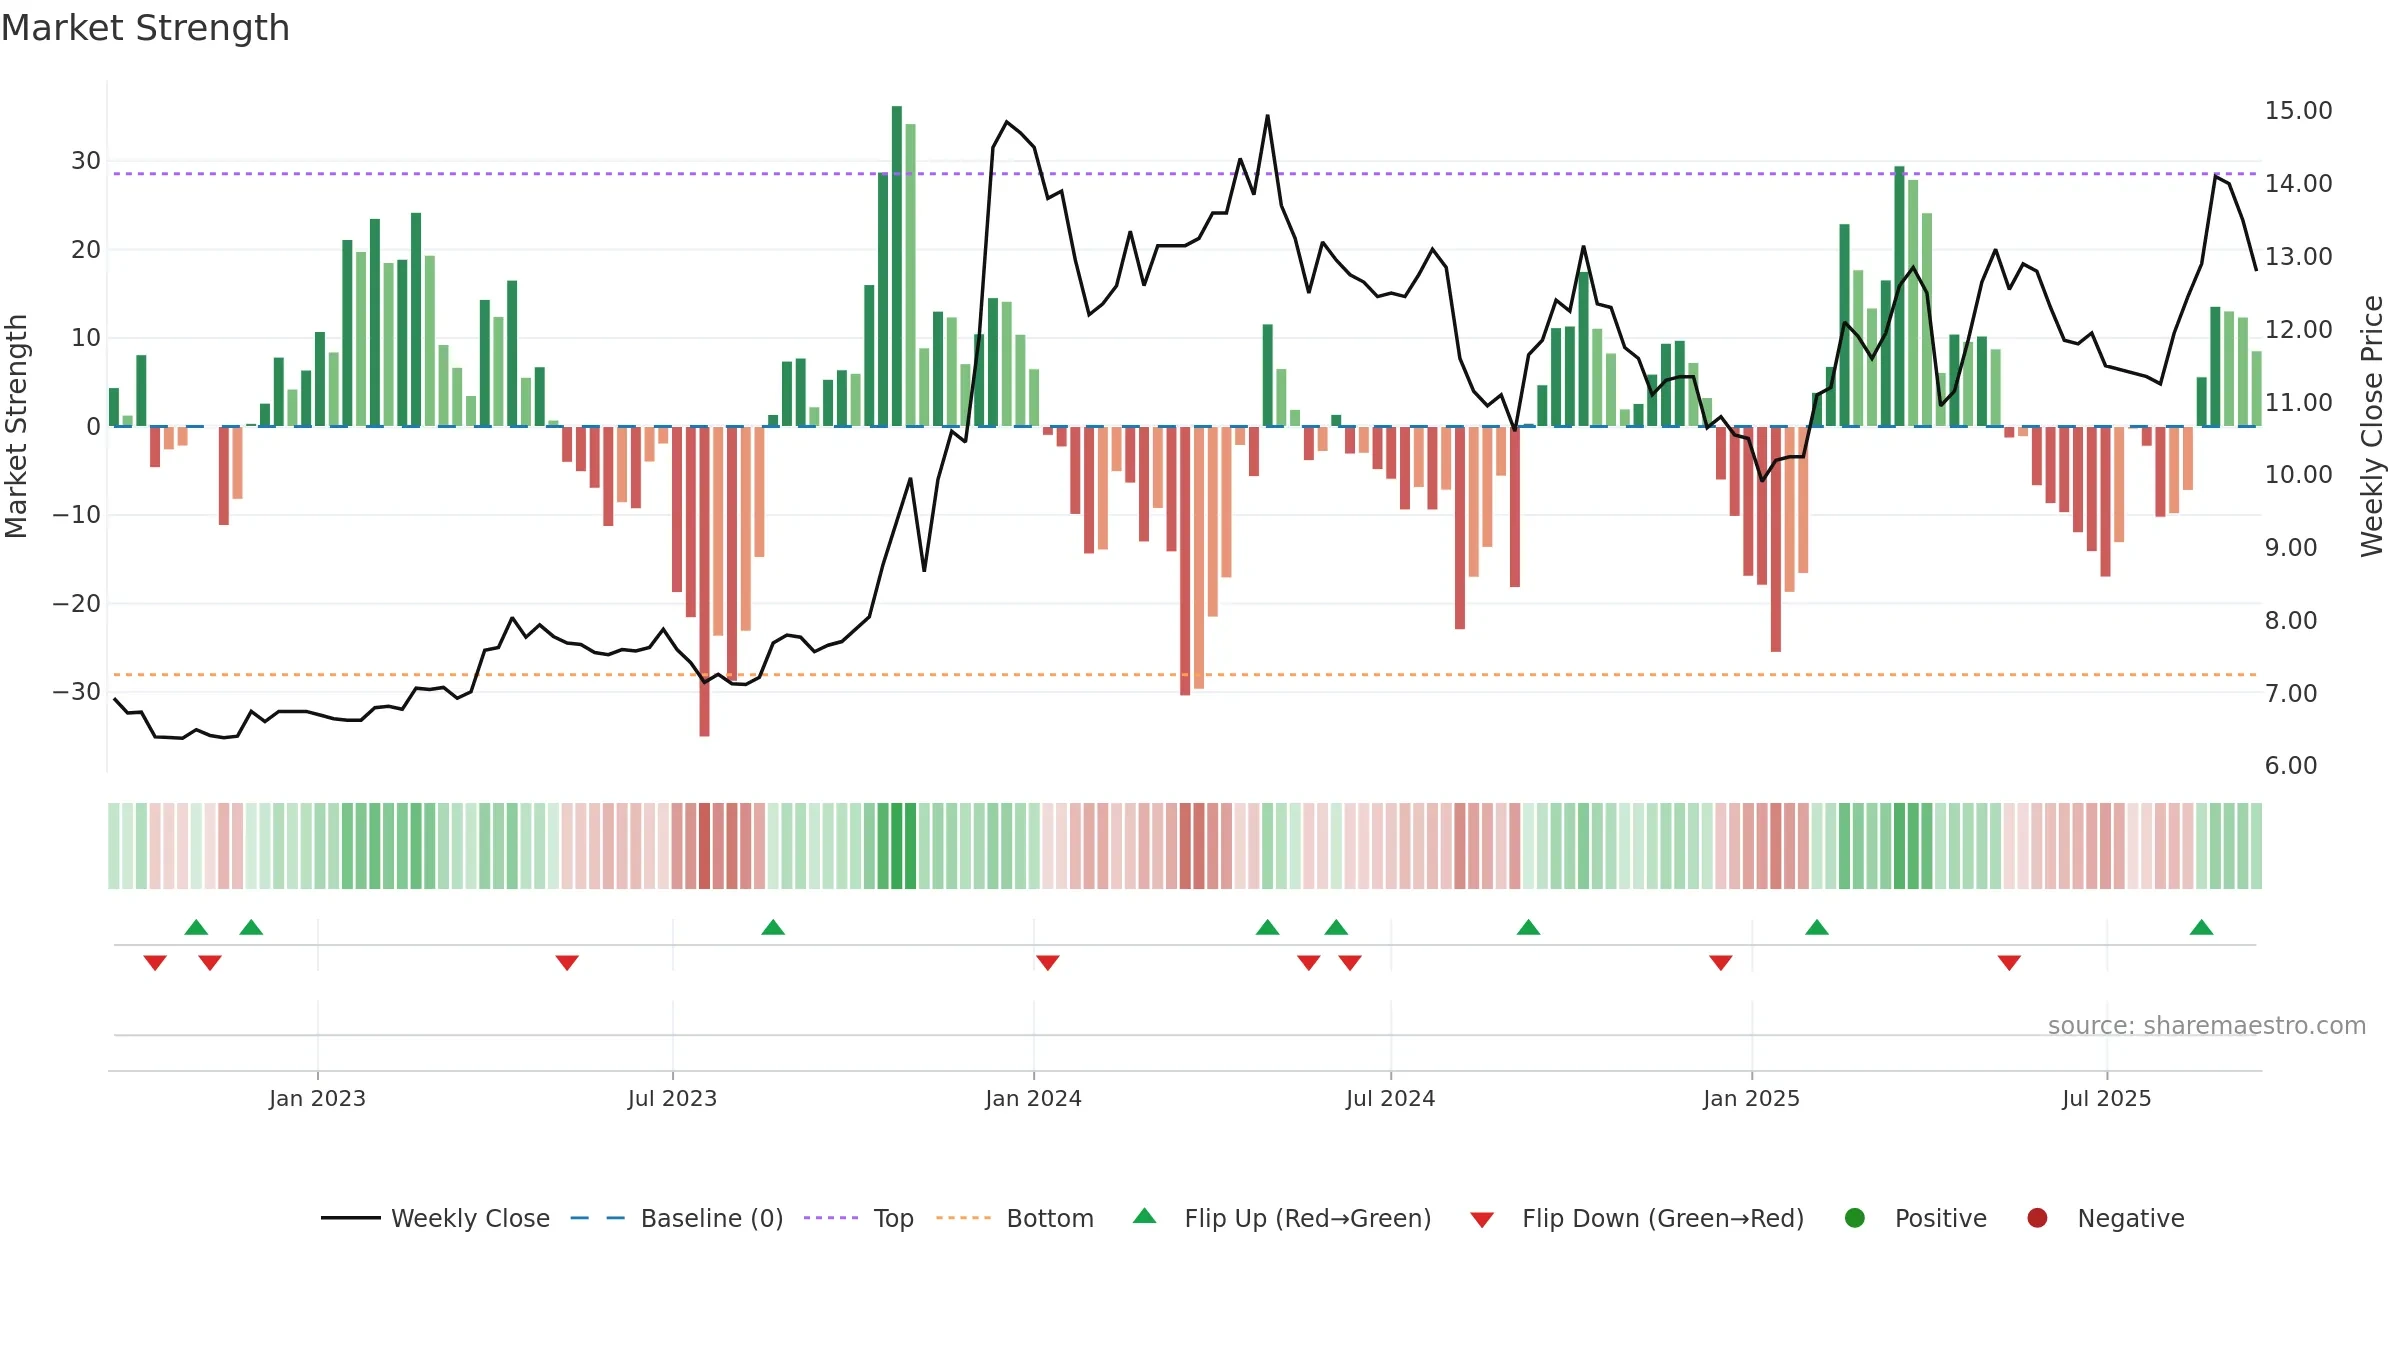
Kung Sing Engineering Corporation closed at 12.8000 (0.39% WoW) . Data window ends Mon, 15 Sep 2025.
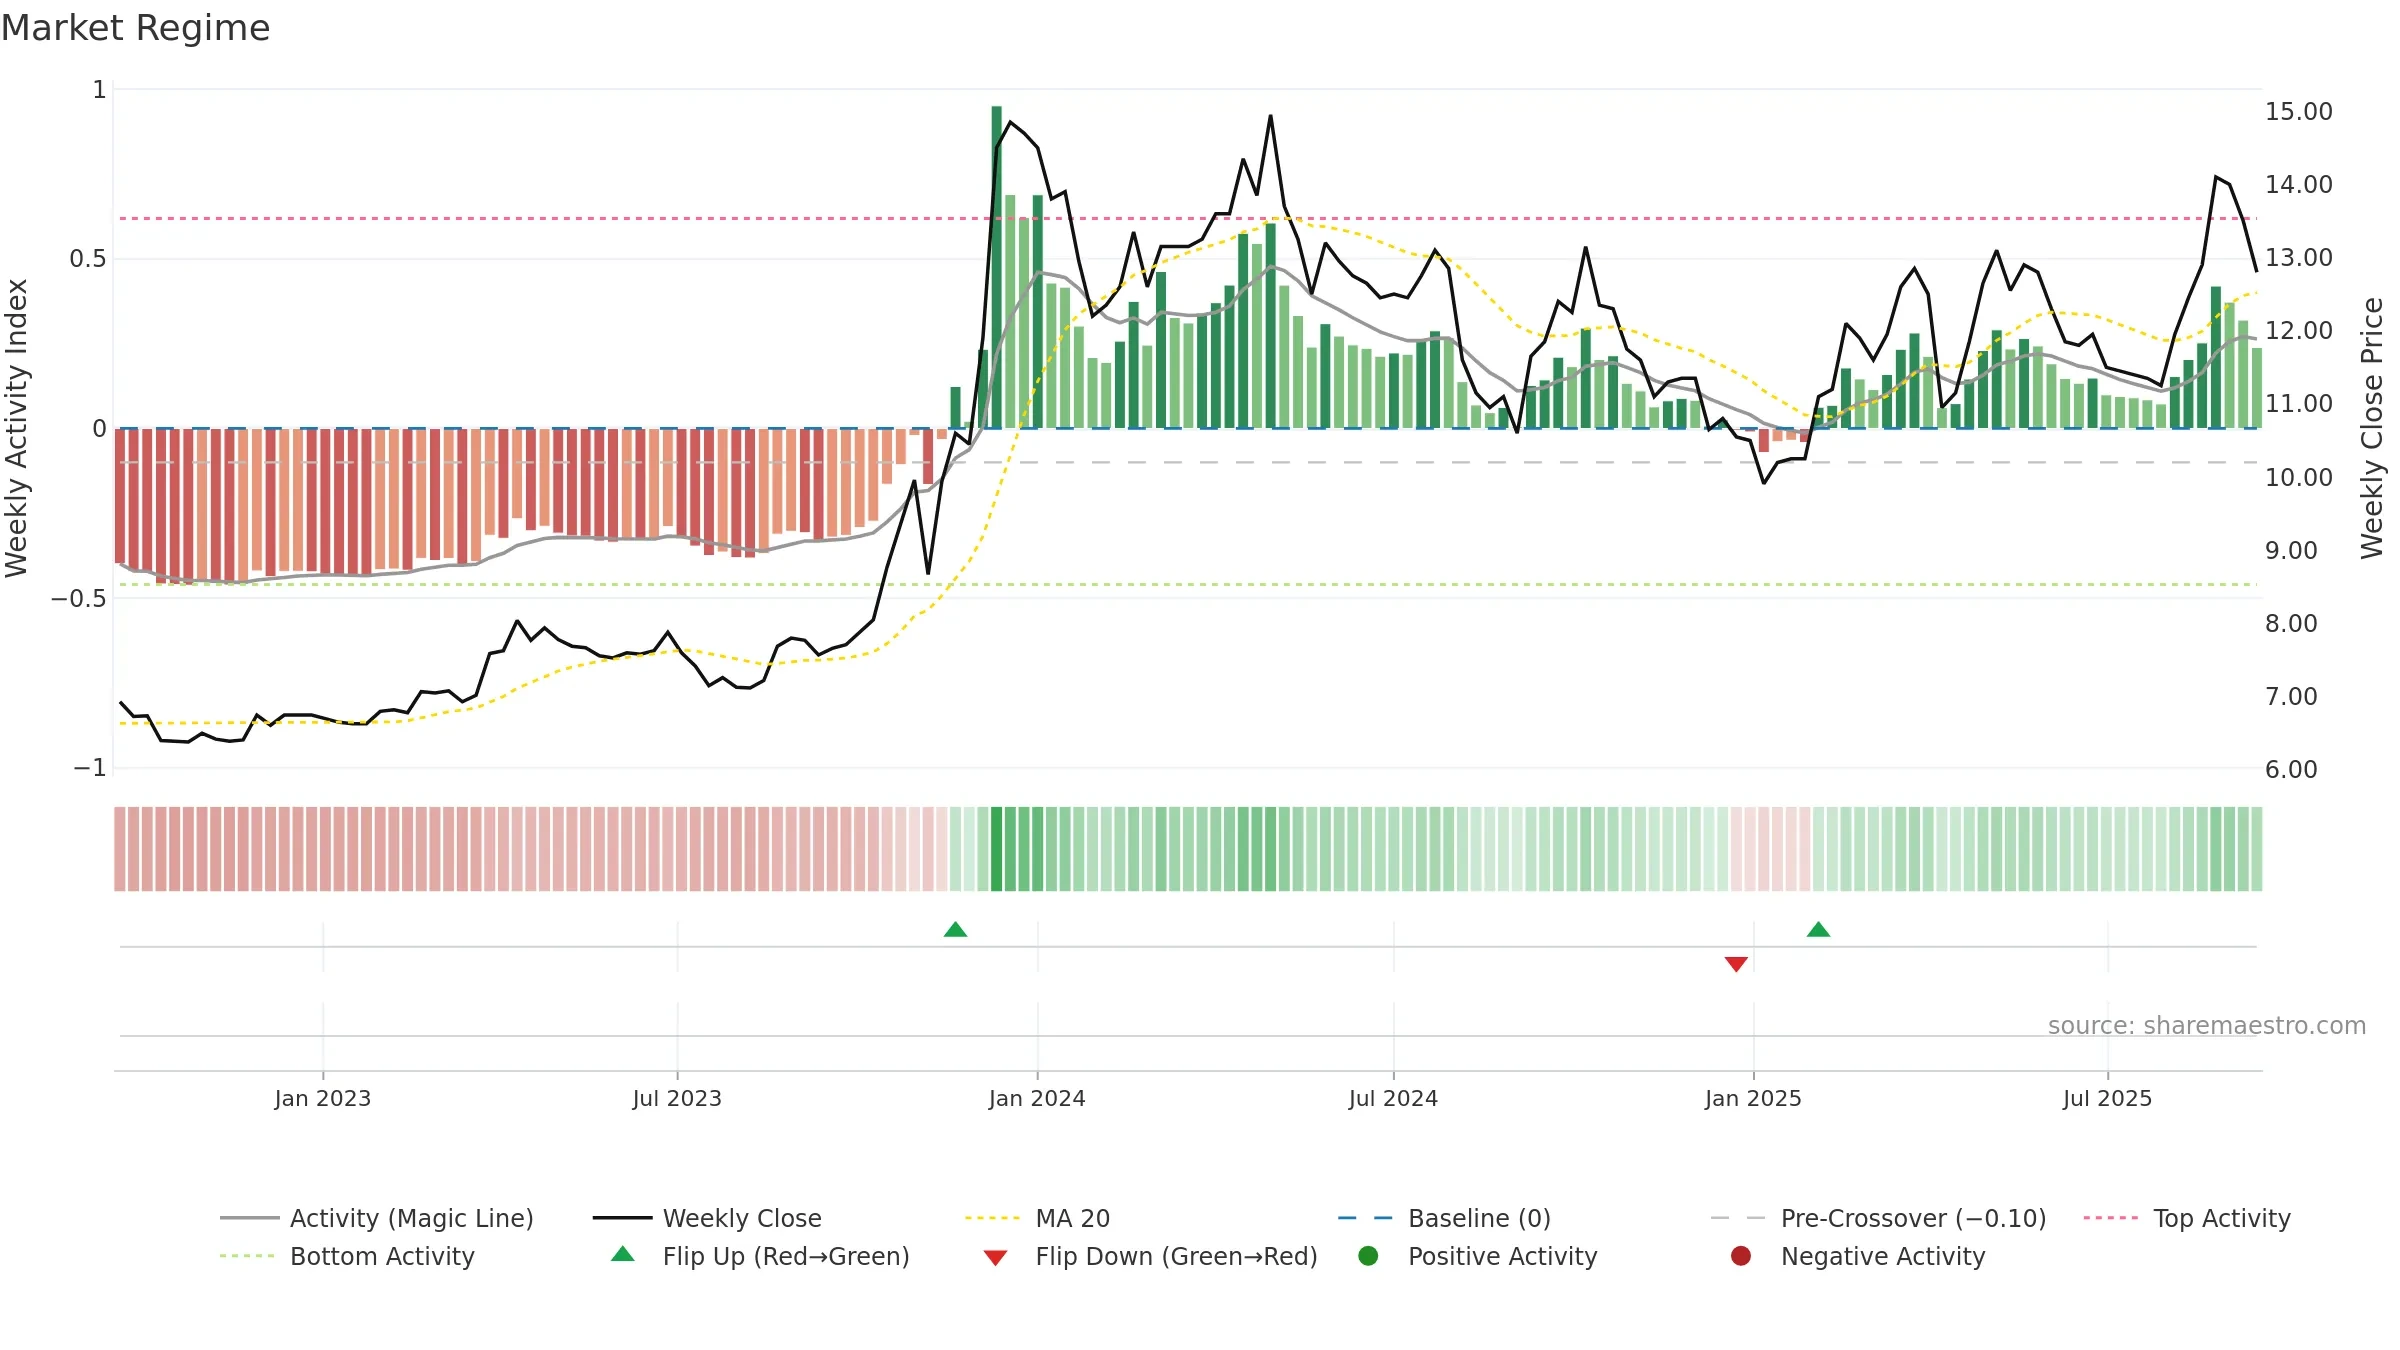
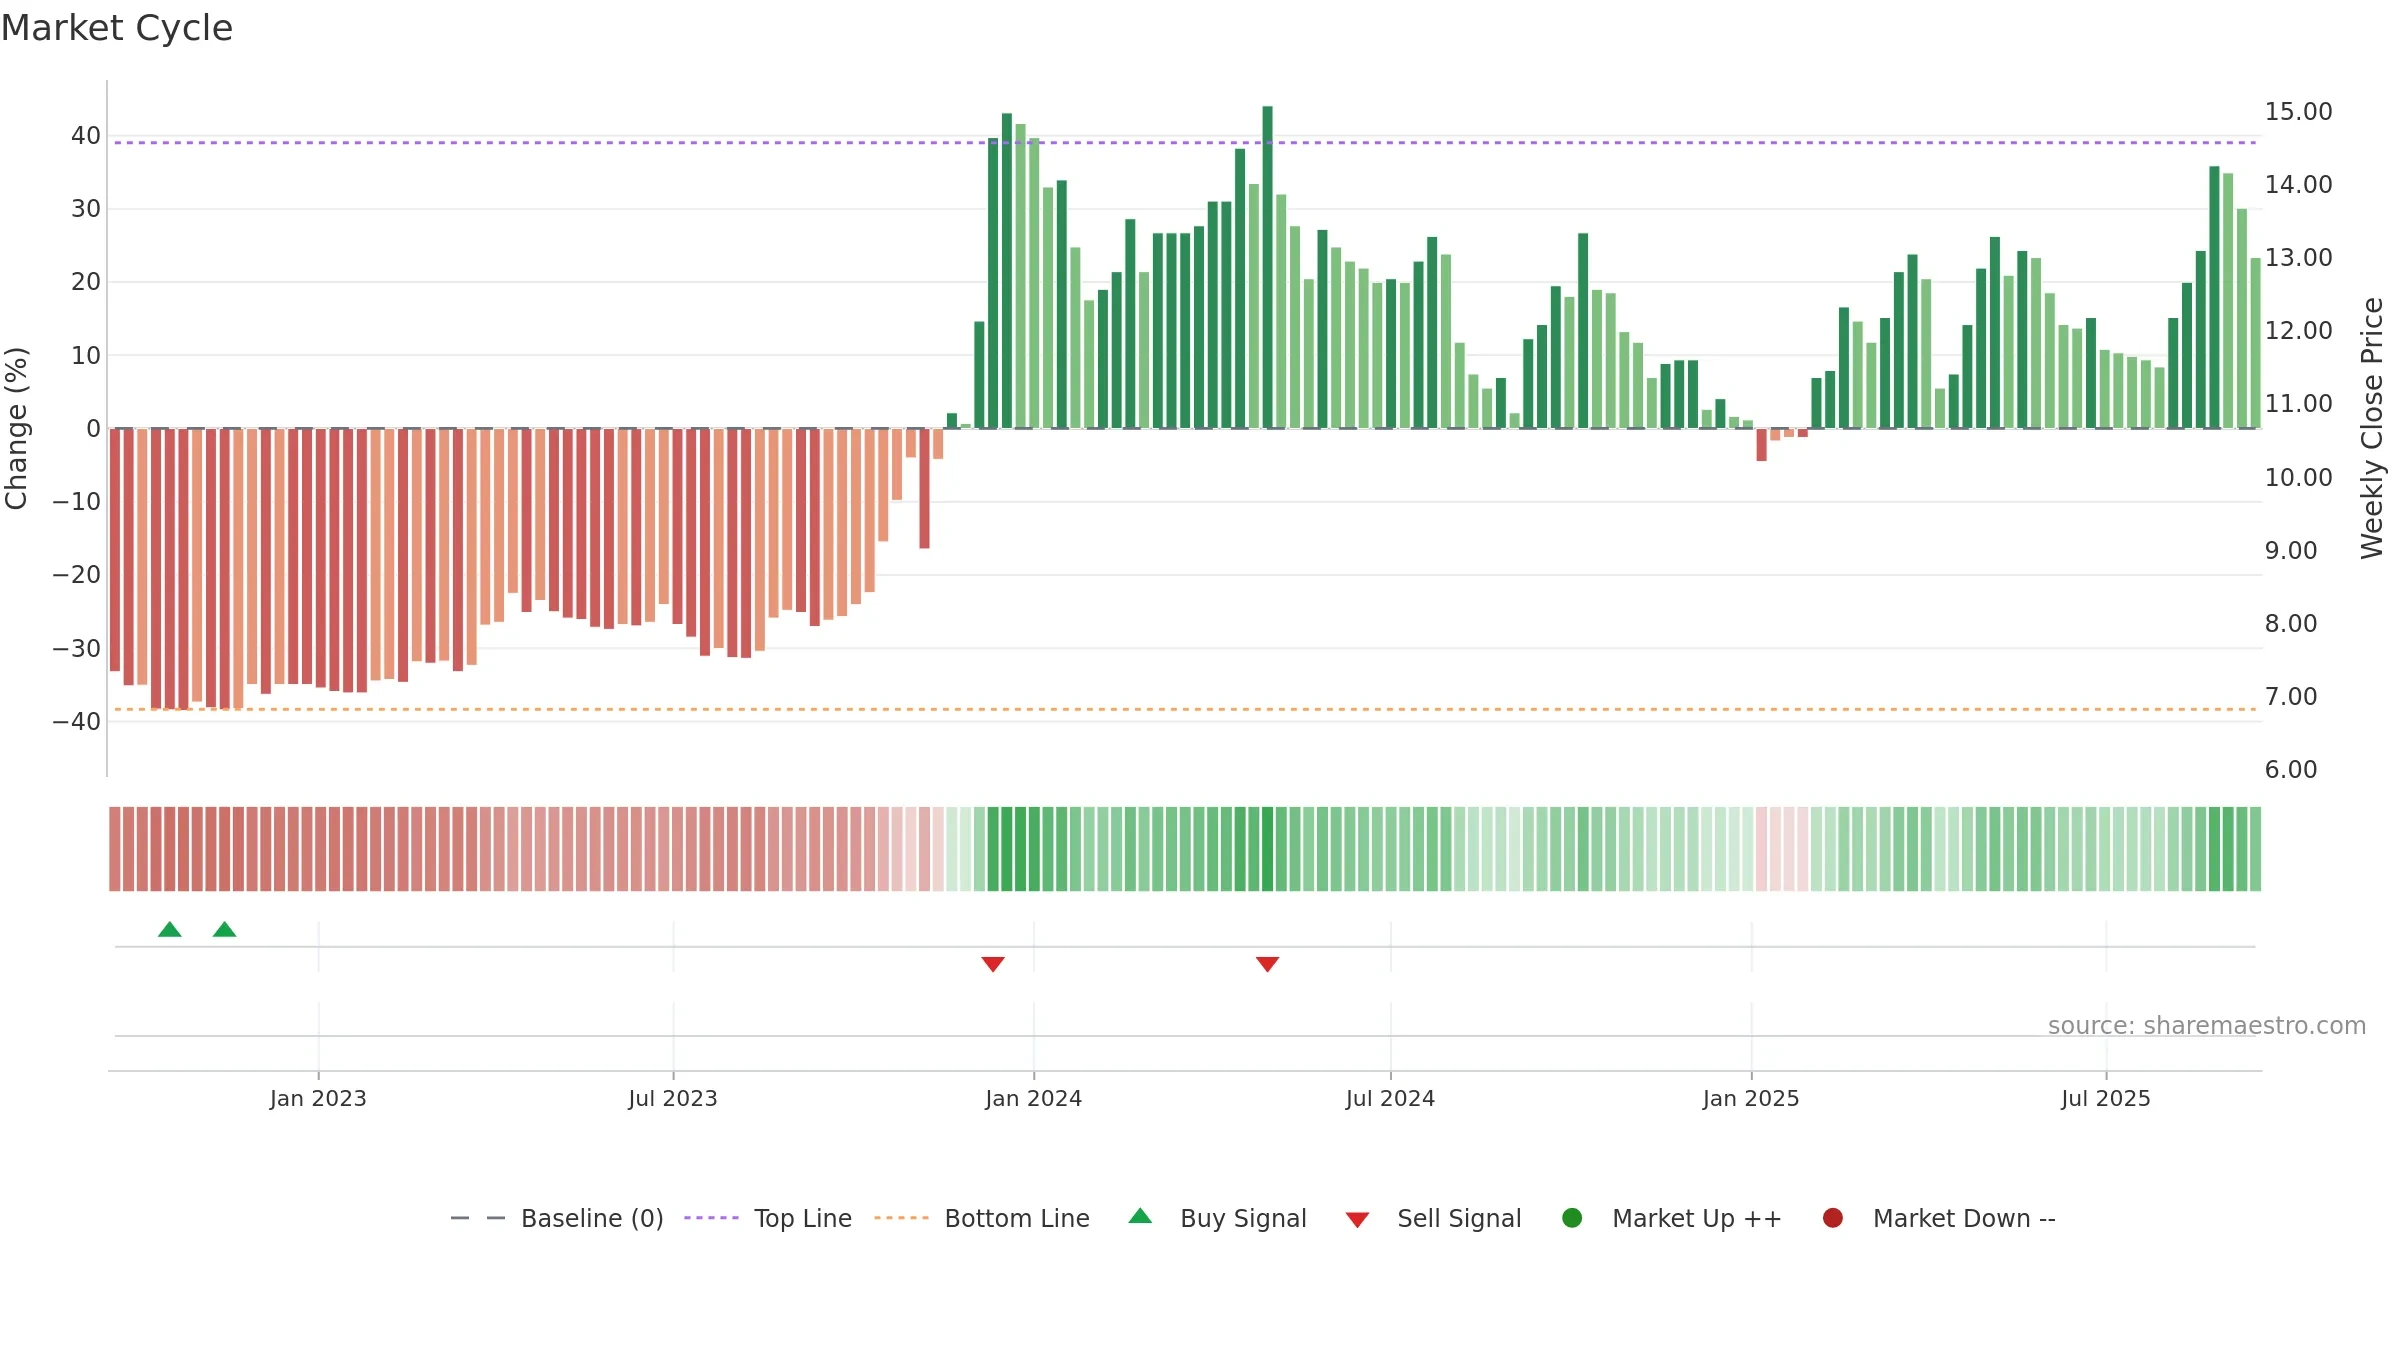
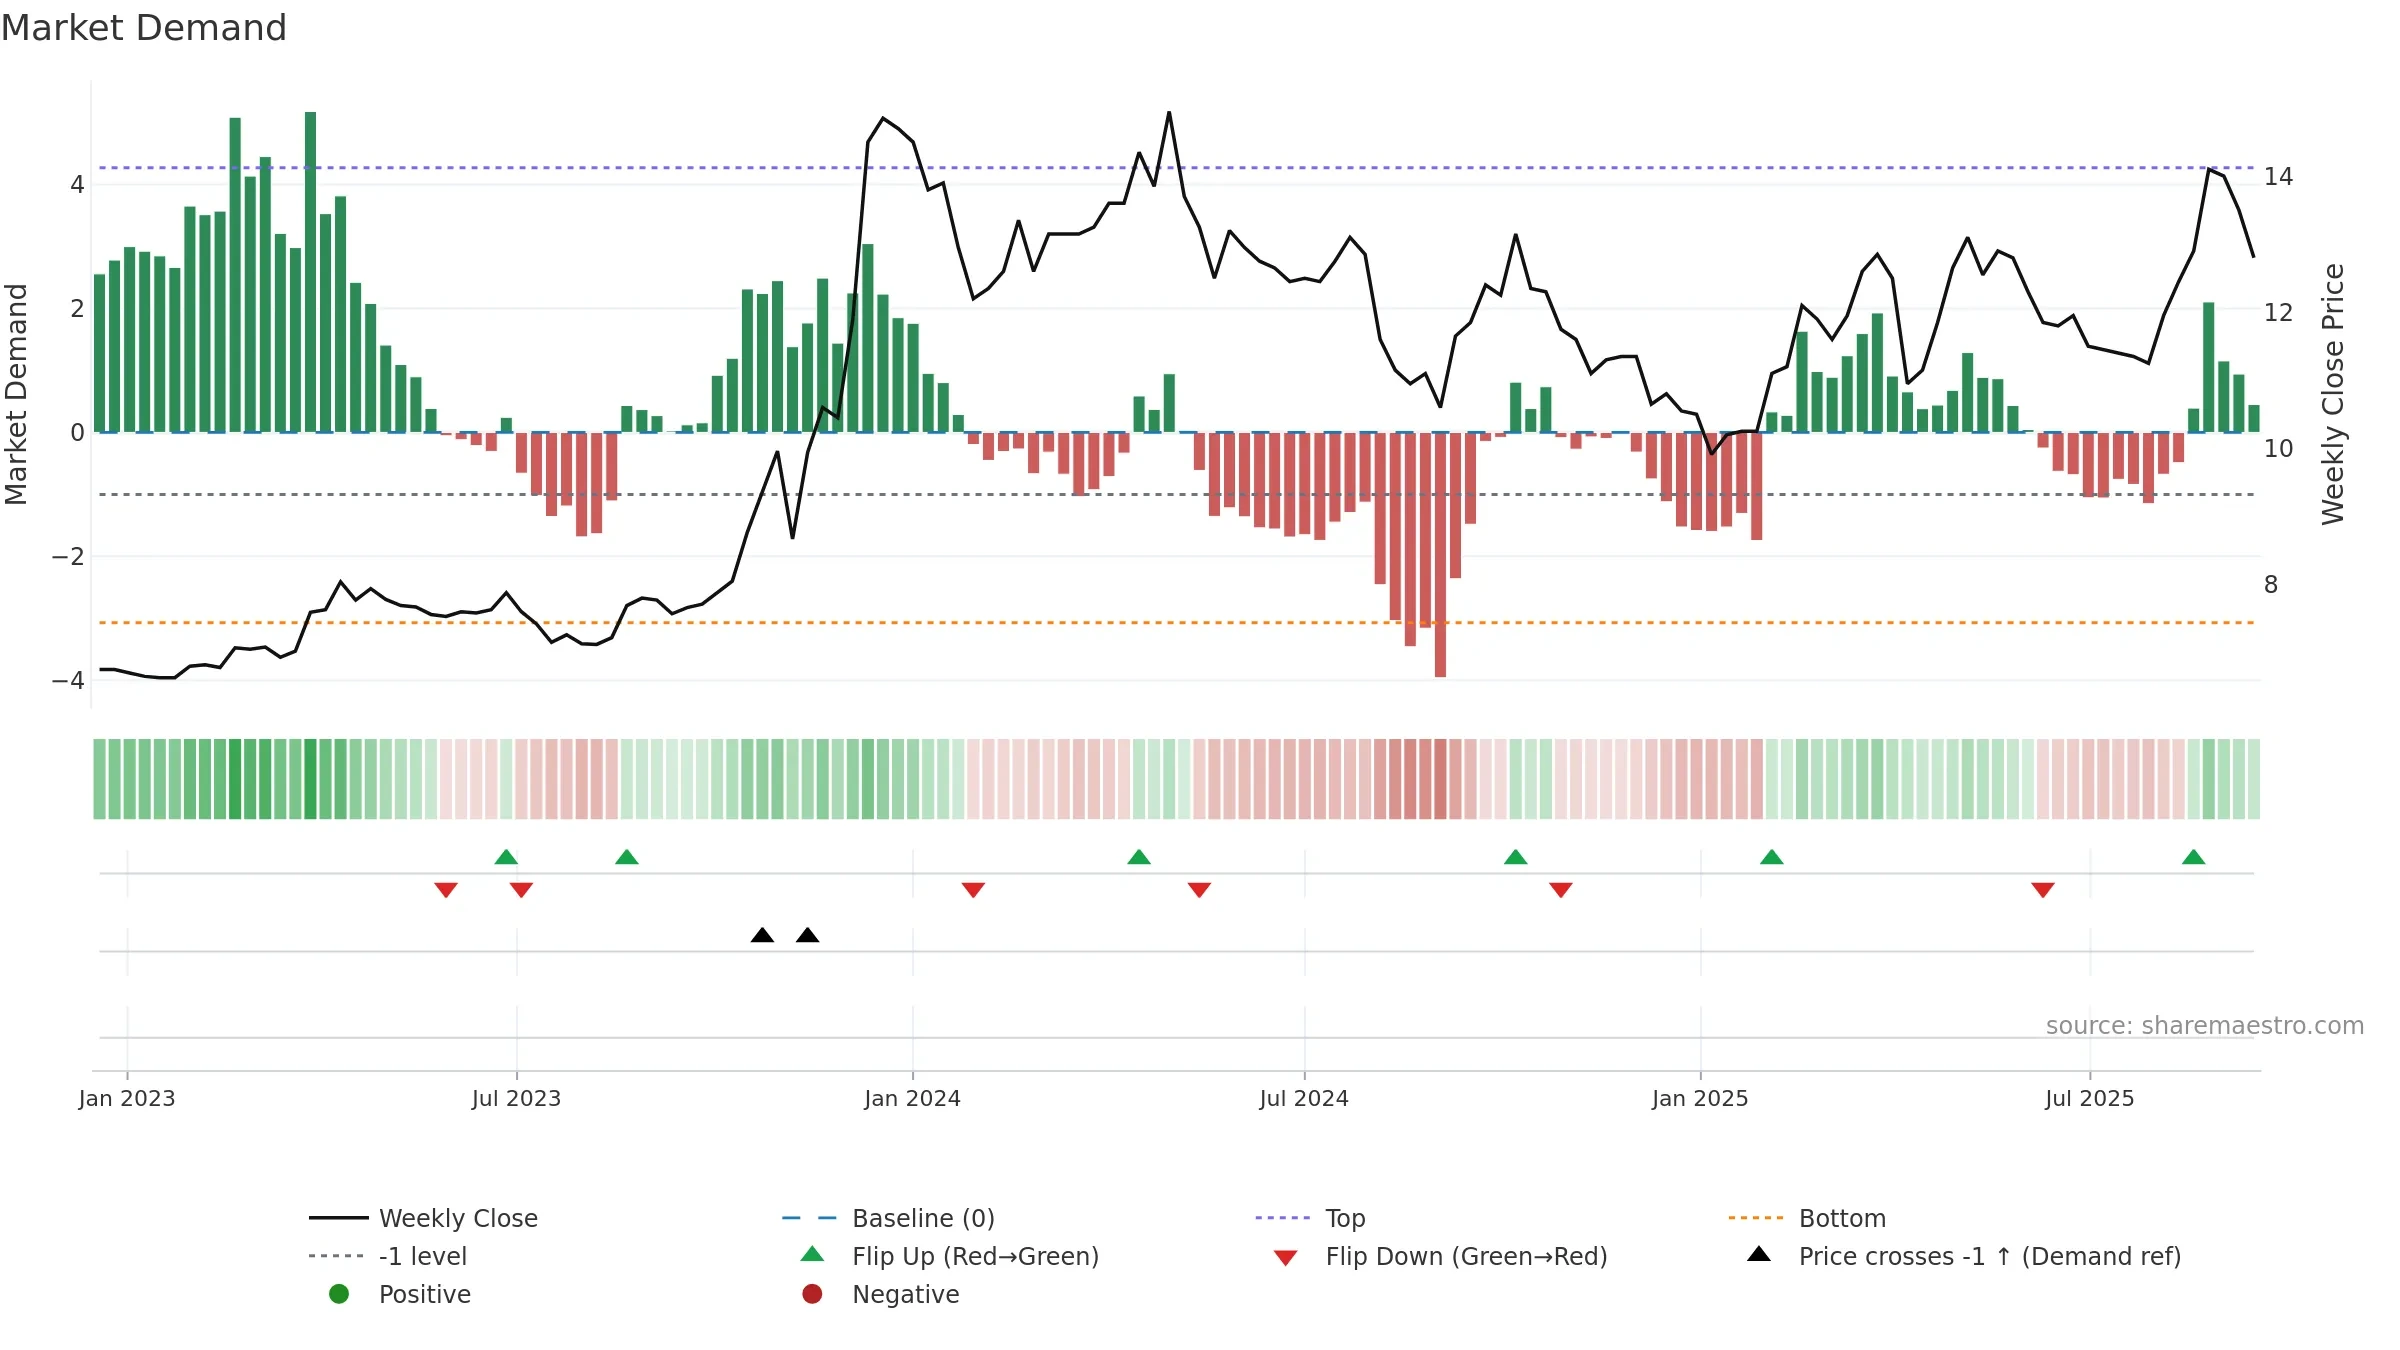
How to read this — Price slope is upward, indicating persistent buying over the window. Volume trend diverges from price — watch for fatigue or rotation. Constructive MA stack supports the up-drift; pullbacks may find support at the 8–13 week region.
Up-slope supports buying interest; pullbacks may be contained if activity stays firm. Because liquidity isn’t confirming, prefer evidence of fresh demand before chasing moves.
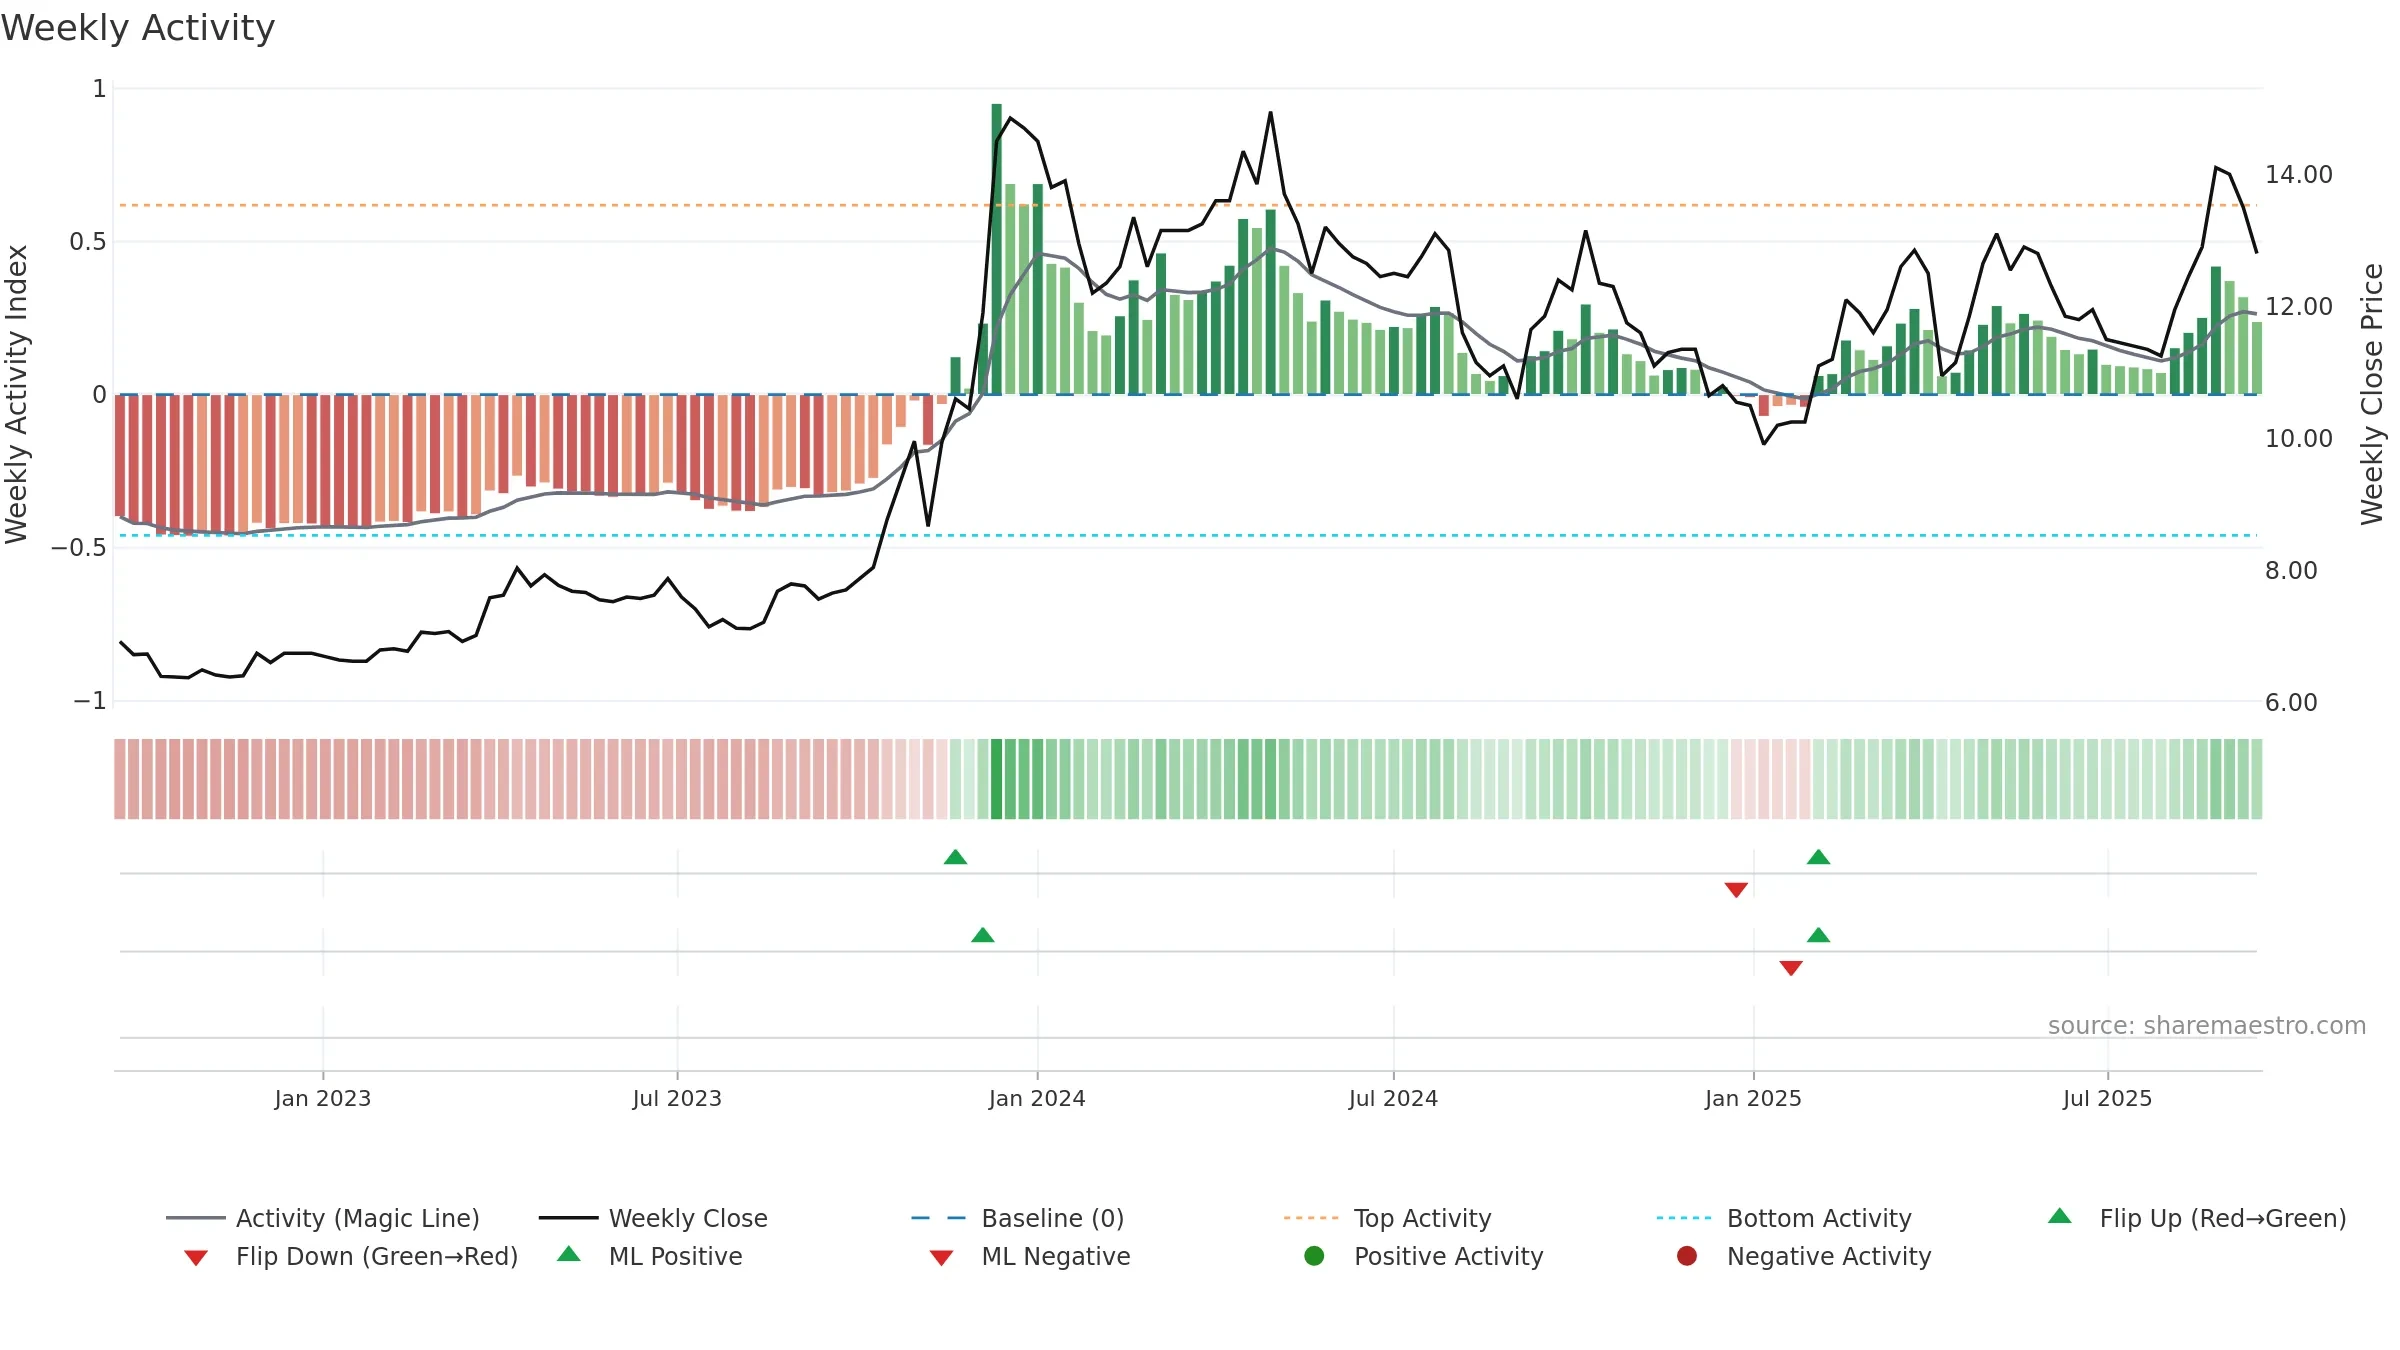
Gauge maps the trend signal to a 0–100 scale.
How to read this — High gauge and rising momentum — buyers in control.
Bias remains higher; pullbacks could be buyable if participation holds.
Price is below fair value; potential upside if momentum constructive.
Conclusion
Neutral setup. ★★★☆☆ confidence. Price window: 13. Trend: Strong Uptrend; gauge 68. In combination, liquidity diverges from price.
- High gauge with rising momentum (strong uptrend)
- Momentum is bullish and rising
- Constructive moving-average stack
- Solid multi-week performance
- Price is not above key averages
- Liquidity diverges from price
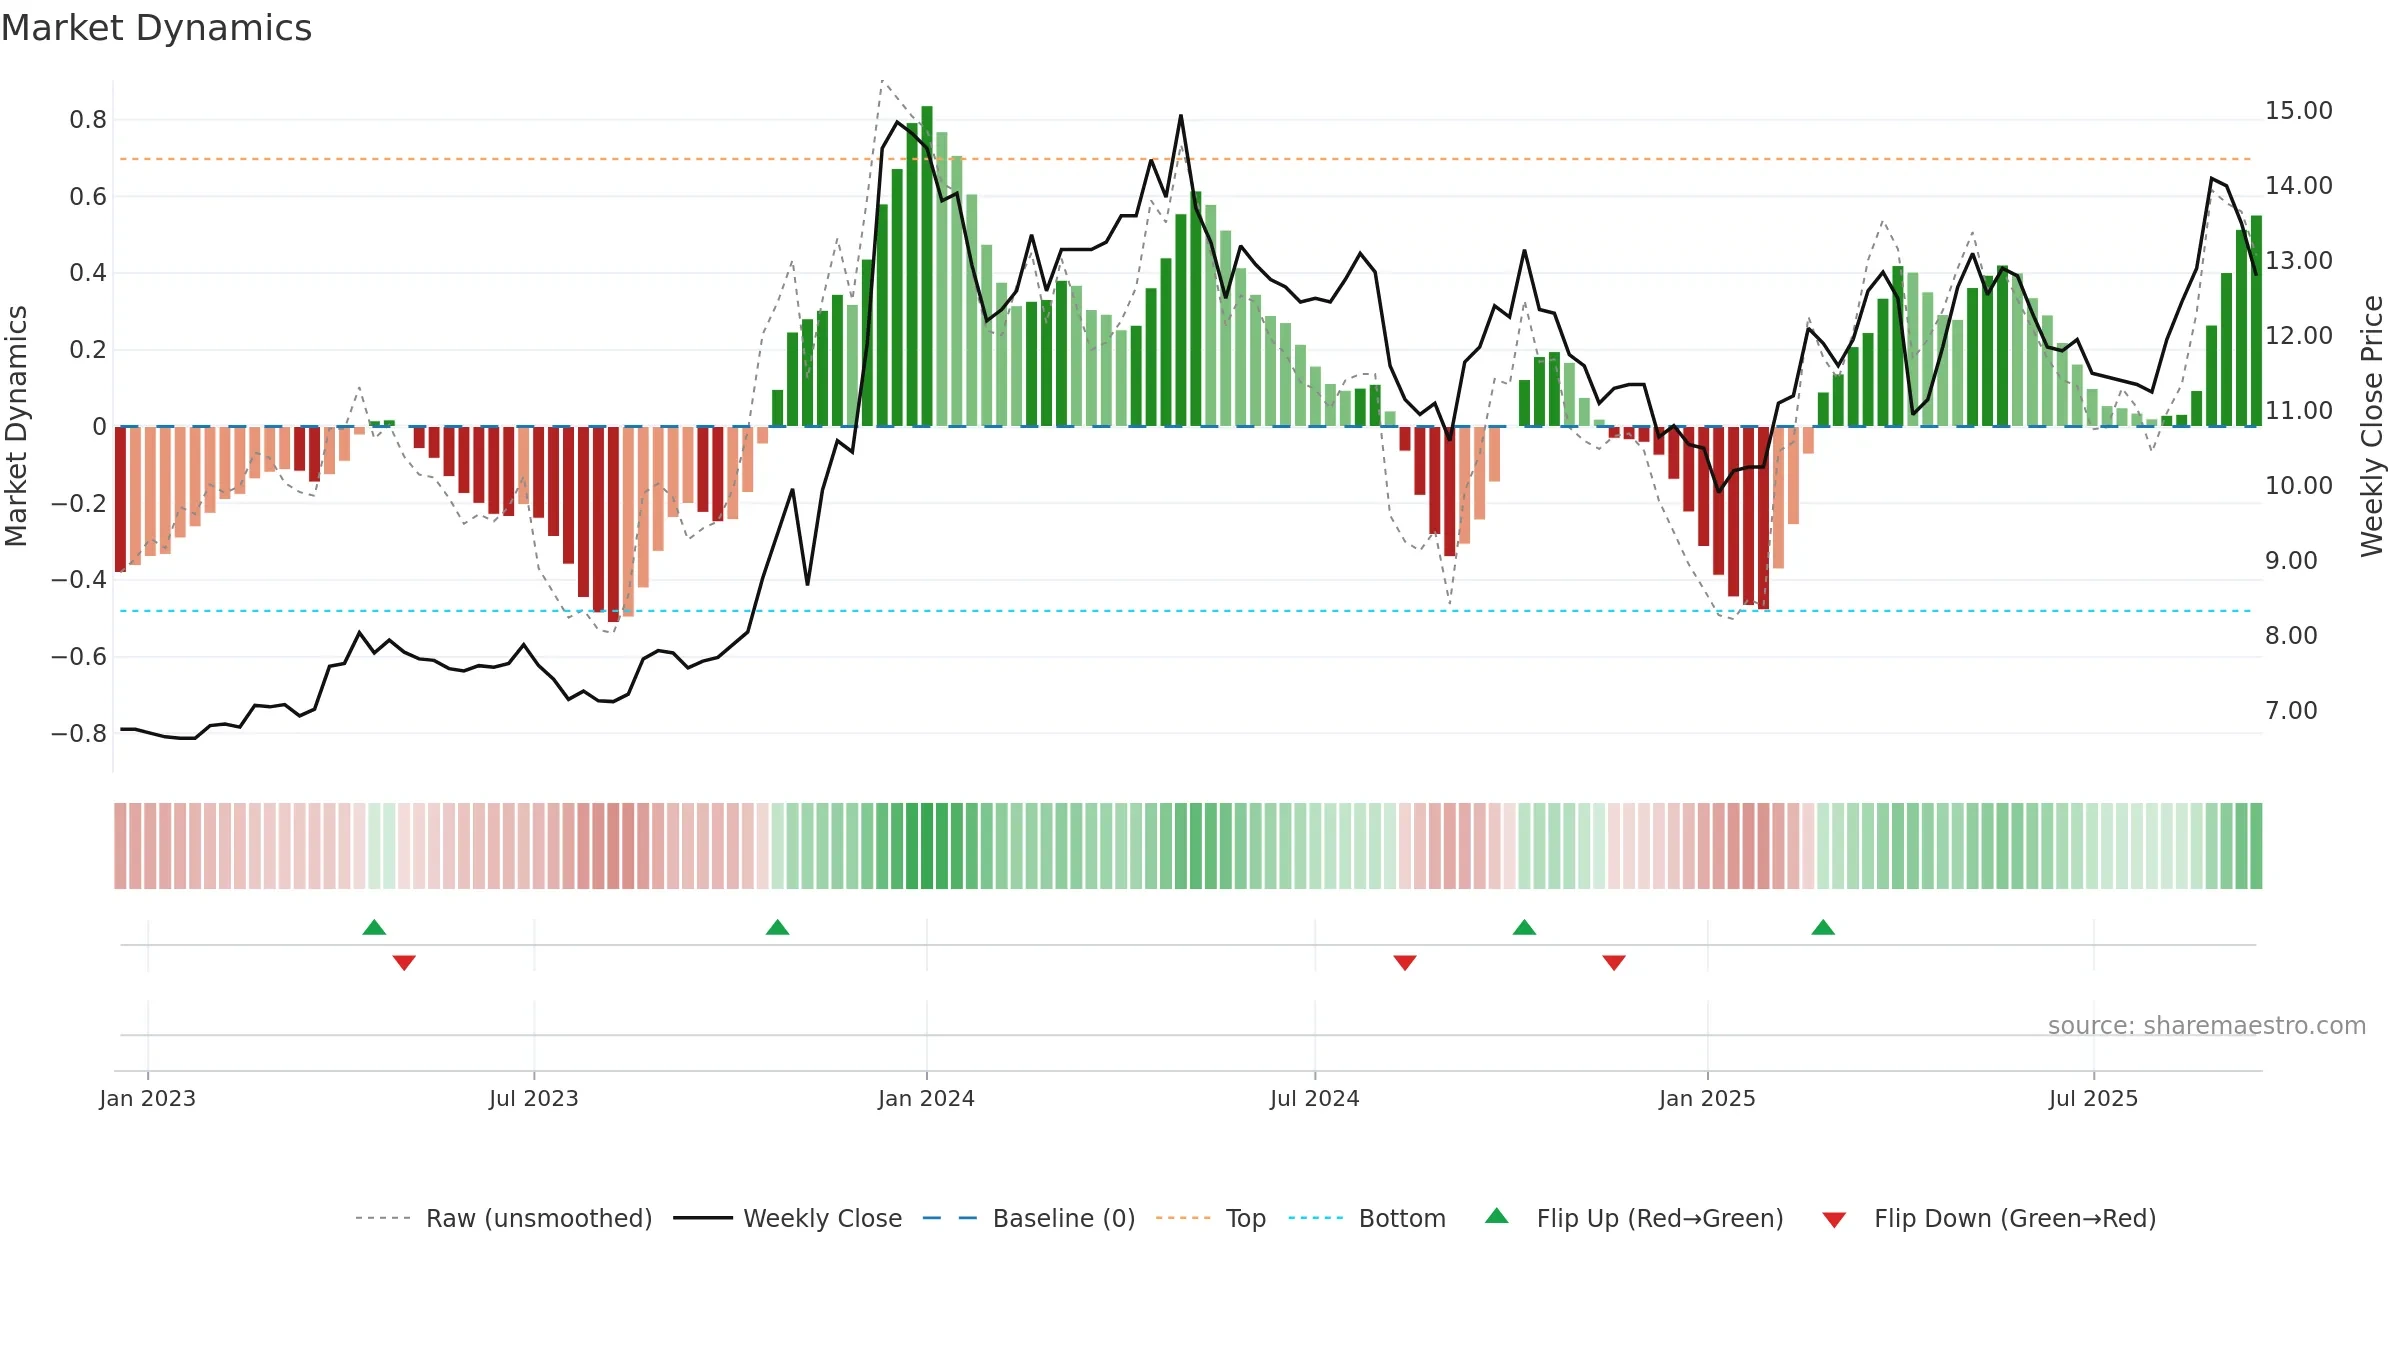
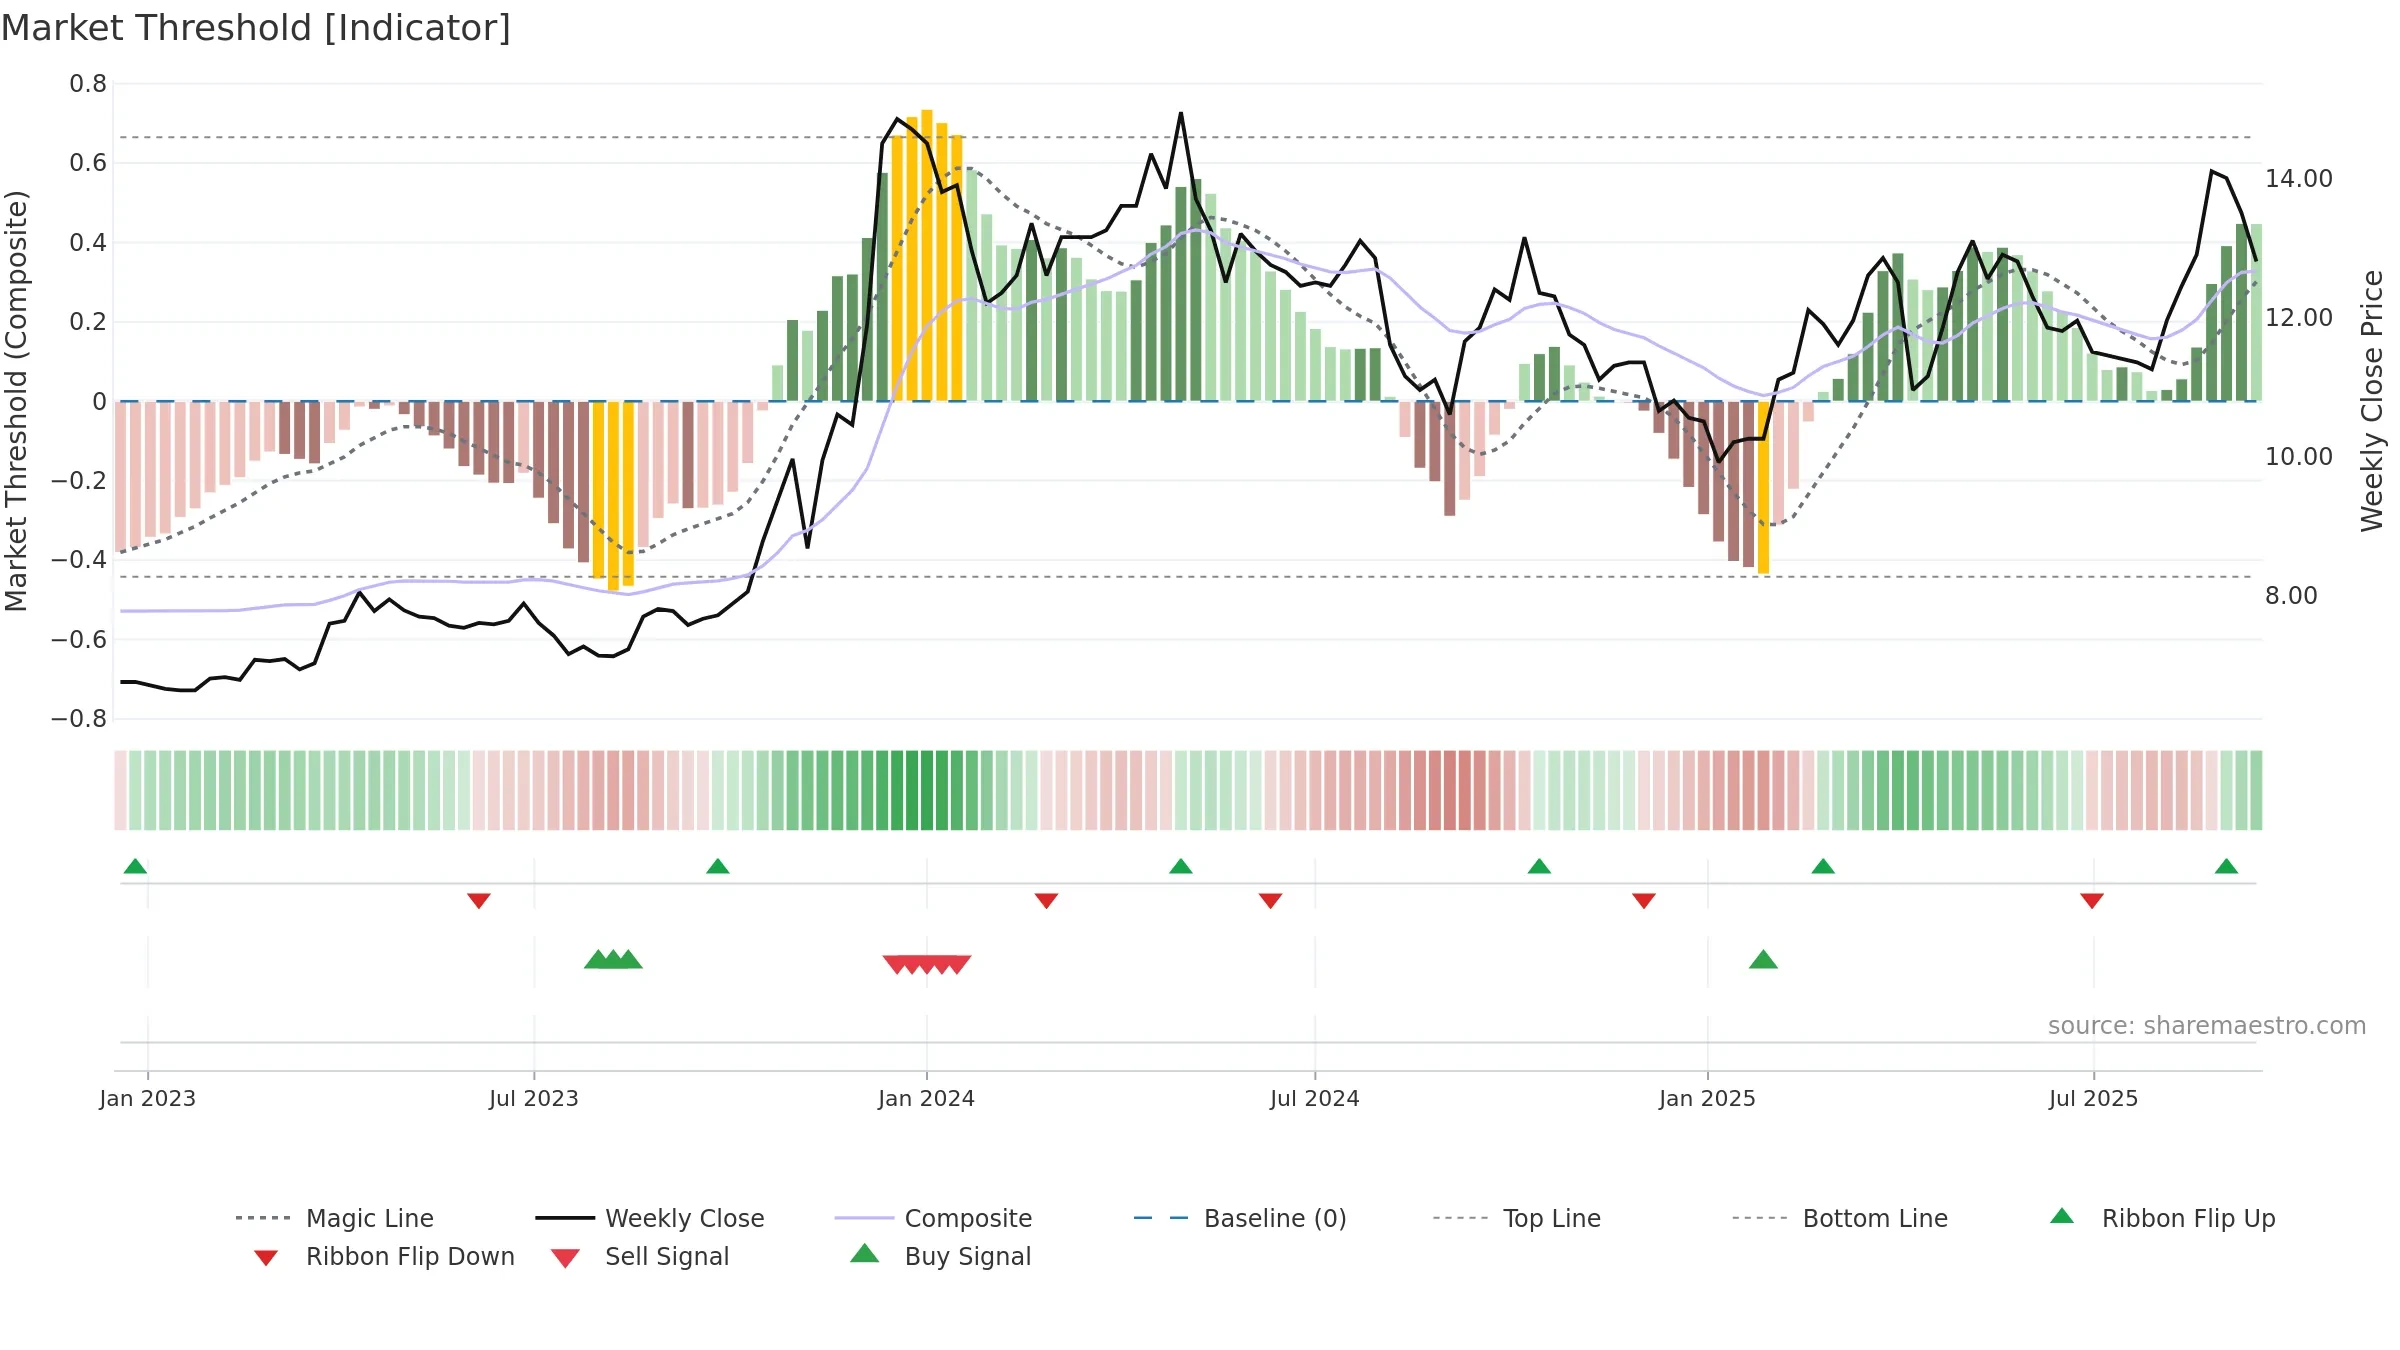
Why: Price window 13.78% over 8w. Close is -9.22% below the prior-window high. Return volatility 2.48%. Volume trend falling. Liquidity divergence with price. Trend state strong uptrend. MA stack constructive. Momentum bullish and rising. Valuation supportive skew.
Tip: Most metrics include a hover tooltip where they appear in the report.