In brief
A Sharemaestro profile of John Magee, the MIT-trained technical analysis pioneer who coauthored Technical Analysis of Stock Trends, built an advisory business around hand-drawn charts, and left a durable but contested framework for interpreting price, volume, trend, support, resistance, and market psychology.
- John Magee mattered because he helped codify technical analysis as a practical discipline for traders, especially through Technical Analysis of Stock Trends, first published with Robert D. Edwards in 1948.
- Magee's approach treated price and volume as the primary facts of market life, with news, tips, and opinions subordinated to supply and demand visible on the chart.
- His process was labor-intensive: daily charts, hand-posted prices, broad review of NYSE and AMEX stocks, and disciplined attention to trendlines, formations, support, resistance, and Dow Theory.
- The most credible critique of Magee's world is not that charts are useless, but that discretionary pattern recognition is subjective, prone to hindsight bias, and difficult to verify without clear rules and audited results.
- Academic evidence has been mixed but not dismissive: studies by Brock, Lakonishok, and LeBaron, Lo, Mamaysky, and Wang, and later institutional-manager research suggest some technical signals or technical practices can carry information, while efficient-market theory remains a powerful warning against easy claims.
- Magee's lasting relevance lies in risk control, trend discipline, and the trader's habit of demanding observable evidence before acting.
Performance and evidence
Performance markers
Visual Evidence
Charts and timelines
Risk
Timeline
Philosophy
Performance
The man who shut out the market's noise
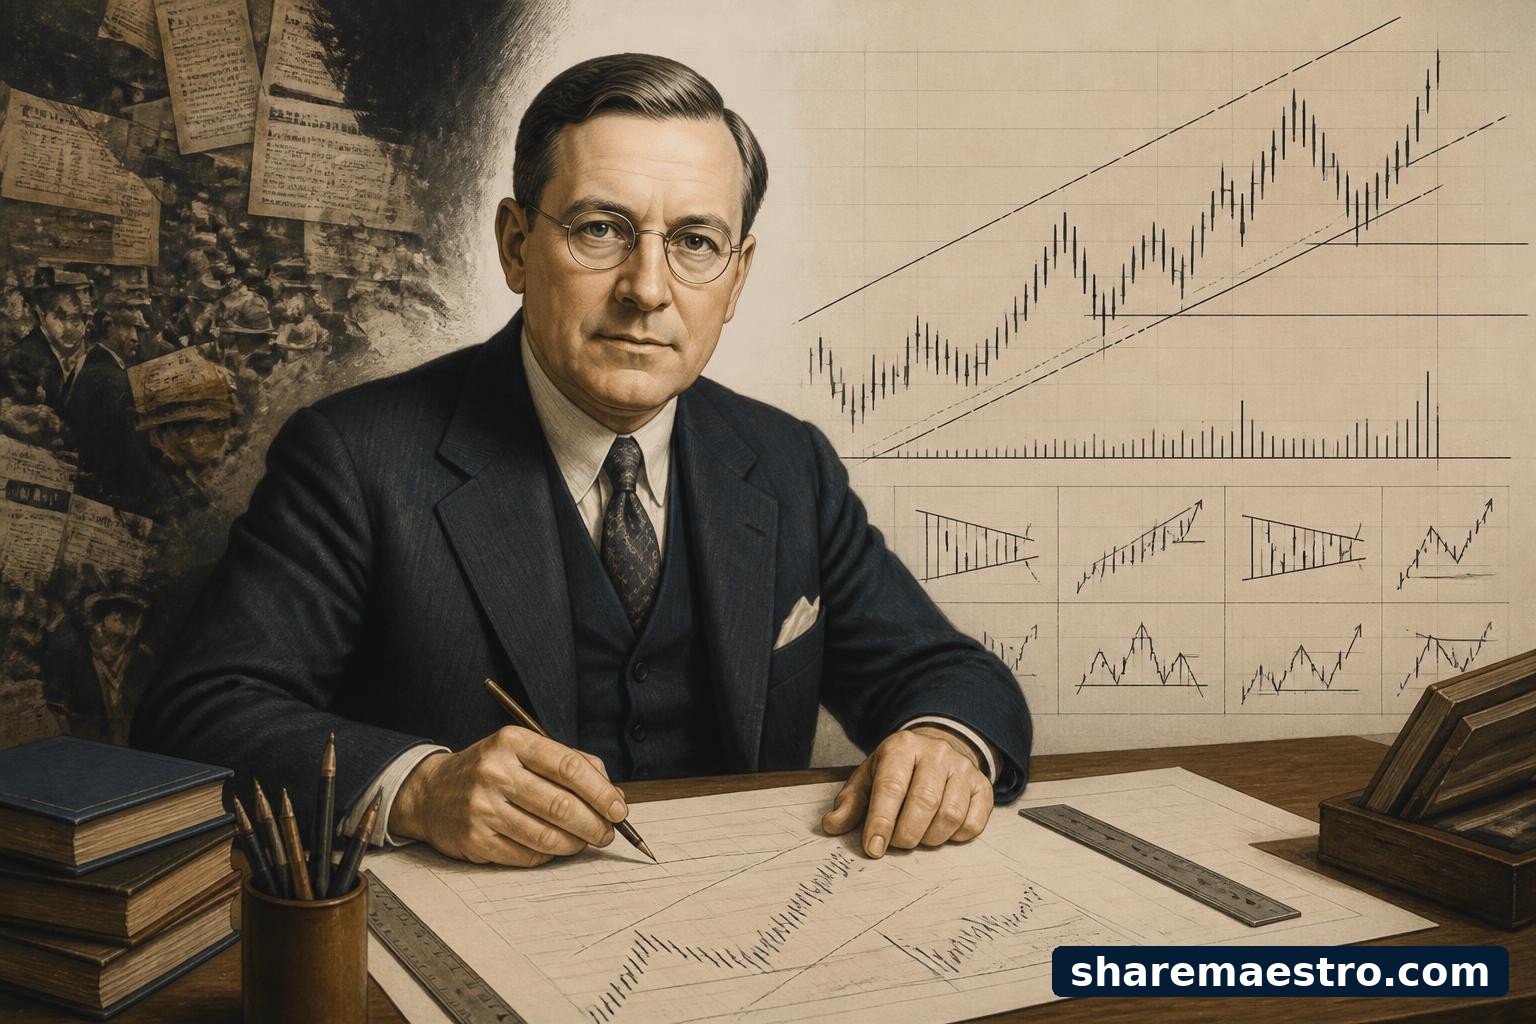
John Magee's most revealing office was not a trading floor, a paneled boardroom, or a university lecture hall. It was a working room built to keep the outside world at a distance. The story that survived among technicians is almost monastic: Magee preferred charts over chatter, delayed newspapers over fresh headlines, and the tape over the television. For a man whose business was markets, he treated the daily news as an occupational hazard.
That posture was more than eccentric theater. It was the core of a system. Magee believed the market's essential evidence was already embedded in price and volume, then organized through charts. The discipline was to observe, classify, wait, and act only when the market itself had supplied a signal. It was an engineer's answer to Wall Street's rumor mill, and it made him one of the central figures in the development of classical technical analysis.
Magee did not invent chart reading by himself, and he did not produce an audited trading record comparable to a modern hedge-fund database. His achievement was different. He helped convert a loose craft into a vocabulary of trends, formations, support, resistance, stops, and tactics. That vocabulary remains familiar to traders who may never have opened his book but still speak his language every time they describe a breakout, a failed pattern, or a trend that must be respected.
Why Magee still matters
Magee matters because he stands at the hinge between pre-computer Wall Street and the chart-saturated markets of the present. Before personal computers, electronic data feeds, and retail charting platforms, a usable stock chart required labor. Prices had to be posted by hand, volume marked carefully, gaps adjusted for dividends, and patterns studied over time. Magee's business turned that labor into a service and then into a doctrine.
The doctrine reached its widest audience through Technical Analysis of Stock Trends, coauthored with Robert D. Edwards and first published by Stock Trend Service in Springfield, Massachusetts, in 1948. The first edition ran 431 pages, a large practical manual for an age when most investors still encountered market data through newspapers, quotation services, and brokerage offices. Later editions kept the Edwards and Magee name alive as a standard reference for technicians.
The continuing editions matter because they show how durable the original framework proved. The 2019 eleventh edition from CRC Press lists 686 pages and 355 black-and-white illustrations, with chapters that still carry the architecture of the old discipline: Dow Theory, reversal patterns, triangles, gaps, support and resistance, trendlines, stops, diversification, capital application, and portfolio risk management. Magee's market was analog; his taxonomy survived digitization.
A late arrival to Wall Street's chart room
Magee's path to market influence was not linear. He graduated from MIT in 1923 and then worked in sales and marketing roles, including a stint as a Fuller Brush salesman. The biography is easy to romanticize, but its practical significance is sharper: Magee arrived at chart analysis as a grown man with engineering training and commercial experience rather than as a brokerage prodigy.
The decisive encounter came in 1942, when Magee met Robert D. Edwards. Edwards was connected to an earlier generation of chart analysis through Richard W. Schabacker, a Forbes financial editor in the 1920s and later a New York Times financial columnist. Schabacker had tried to apply charting to individual stocks rather than only to broad averages. After Schabacker died in 1935, Edwards took over his papers and the Schabacker Institute, then moved to Springfield, Massachusetts, in 1941.
Magee joined Edwards in Springfield the following year. The partnership lasted less than a decade, but it combined inheritance and operating experience. Edwards brought Schabacker's intellectual archive and the structure of technical theory. Magee brought the practical habits of a trader, chart keeper, newsletter operator, and teacher. In the finished book, later technicians would see the split: the theory owed much to Edwards and Schabacker, while the trading-tactics section was recognizably Magee's own.
The 1948 book that gave charting a grammar
Technical Analysis of Stock Trends did not arrive as a slim manifesto. It was a comprehensive operating manual. The 1948 bibliographic record lists Robert D. Edwards and John Magee Jr. as authors, Stock Trend Service as publisher, Springfield as the place of publication, and xxv plus 431 pages. That scale is part of the story. Magee and Edwards were not merely naming patterns. They were attempting to standardize the practice of reading price history.
The book's importance also rests on what it gathered. It absorbed Dow Theory, Schabacker's pattern work, and the lived experience of traders trying to distinguish noise from trend. It put names and tactical implications around formations such as head-and-shoulders, double tops, triangles, rectangles, gaps, and support and resistance. It insisted that charts were not ornaments. They were instruments of decision.
The modern reader can miss how radical that practicality was. Fundamental analysis had Graham and Dodd. Accounting analysis had balance sheets, earnings, assets, and margins of safety. Magee's side of the market had lines, price bars, and repeated human behavior. By organizing those elements into a repeatable system, he made technical analysis teachable, portable, and debatable.
Price as the first fact
Magee's philosophy began with a claim that still divides investors: market action contains the useful facts. The Edwards-Magee framework distinguished technical analysis from fundamental analysis by treating the observed market record as the raw material. Open, high, low, close, and volume were not secondary decorations around a fundamental story. They were the evidence through which supply and demand could be read.
That view led to a stark hierarchy. News might explain price action after the fact, but for Magee it was not the trader's foundation. The chart recorded the contest between buyers and sellers. If a stock broke above resistance on volume, the technician did not need to know every boardroom conversation, analyst revision, or rumor that helped create demand. The job was to recognize that demand had become visible.
The danger is obvious. Price can move for reasons that are temporary, manipulative, liquidity-driven, or simply misread. Magee's own work acknowledged that charts were imperfect tools rather than mechanical truth machines. But his great insistence was that an imperfect record of actual transactions was still better than confident opinion. In a market full of stories, he wanted a method grounded in what investors had already done with money.
The engineer's market
Magee's technical analysis was often described as chart reading, but the phrase understates the engineering instinct behind it. He wanted market behavior broken into observable components: trend, reversal, continuation, support, resistance, volume confirmation, and tactical failure points. The purpose was not prediction as prophecy. It was conditional action: if this level breaks, if volume confirms, if the pattern fails, then the trader must respond.
The Edwards-Magee tenets were simple enough to fit on a wall but demanding in practice. Prices move in trends. Volume should go with the trend. A trend, once established, tends to continue until evidence says otherwise. An uptrend remains in force when successive rallies reach higher highs and reactions hold at higher lows. Major trends can last a year or more and involve moves of at least 20 percent, while intermediate moves often retrace a meaningful portion of the major trend.
That structure gave traders a way to avoid constant reinvention. Instead of asking every morning what they believed about the economy, they could ask what the chart had confirmed, what it had failed to confirm, and where the position would be wrong. It was a modest but powerful shift: the trader's opinion became subordinate to a defined observation process.
A factory for visual evidence
Magee's business was not merely intellectual. It was industrial. Accounts from technicians who worked in his orbit describe a chart operation that required mylar sheets, rulers, pens, Wall Street Journal price tables, diazo machines, mailing tubes, and staff. In 1968, Susan Berger was hired at John Magee to post open, high, low, close, and volume by hand. Hundreds of NYSE and AMEX charts were updated in the morning, with afternoons devoted to client orders.
The detail matters because it explains the kind of knowledge Magee valued. A modern trader can scan a thousand charts in minutes and forget them just as quickly. Magee's world forced attention. Prices were read aloud, marked, checked, inked, copied, mailed, and filed. Dividends had to be distinguished from real gaps. A chart was a physical artifact, not a disposable screen.
The advisory service had the same craft character. Staff produced charts and commentary, and the weekly service required printing, addressing, collating, and shipping. On Friday nights, Magee and another analyst would review folders and charts to find a small number of long and short ideas. That routine joined broad surveillance to selectivity, a combination that later screen-based traders would automate but not necessarily improve.
From formations to tactics
Magee's great contribution was not the idea that markets form patterns. Traders had noticed that long before him. His contribution was the practical connection between pattern, signal, and action. An area pattern could suggest accumulation, distribution, consolidation, or reversal. A trendline could define the operative direction. Support and resistance could mark where a move might slow, fail, or accelerate. Dow Theory supplied a broad-market frame.
The 2019 eleventh edition's table of contents shows how comprehensive the structure became. It moves from technical theory to trading tactics, from Dow Theory and reversal patterns to gaps, support and resistance, trendlines, stock selection, stop orders, diversification, capital use, and portfolio risk management. Magee's charting was never just pattern-spotting. It was a complete decision chain from observation to execution.
The best version of that chain is disciplined. A trader identifies a pattern, waits for confirmation, defines risk, sizes the trade, and exits when the evidence changes. The weaker version is familiar too: a trader names a pattern after the fact, sees what he wants to see, and treats a chart as permission for a hunch. Magee gave the market a grammar, but grammar does not guarantee judgment.
Stops, failure points, and the humility inside the system
For all his reputation as a pure chartist, Magee was not blind to failure. He lost money early in his career, including a reported $25,000 loss in the market during the early 1940s. He later acknowledged that his own long-term investing had not matched his recommendations to clients, attributing the difference to a shaky beginning. That admission gives the profile a necessary shadow. The father of a discipline had scars from the discipline.
The mature framework tried to make those scars useful. Technical analysis as Magee practiced it was not only about finding entries. It was also about defining when the premise had failed. A broken trendline, a failed breakout, a violated support level, or a stop reached after a pattern reversal were not embarrassments to be rationalized. They were evidence that the trader's prior reading had lost force.
That is why later editors and students placed so much emphasis on basing points and stop placement. The system's most durable risk lesson is that charts can be wrong, but positions do not have to become catastrophic. Magee's real discipline was not certainty. It was the willingness to let the market invalidate the trader before losses became identity.
The record problem
Magee's historical importance is easier to document than his investment performance. There is no widely cited, independently audited fund record for him comparable to the performance histories associated with later hedge-fund managers or mutual-fund stars. His influence came through books, charts, advisory services, teaching, and practitioners trained in his methods. That does not diminish his role, but it changes how his record should be judged.
The strongest evidence for the method is therefore indirect. It appears in the persistence of the book, the careers of technicians influenced by him, the later institutional adoption of technical tools, and academic studies testing technical rules or technical users. A 2013 institutional-manager study examined more than 10,000 portfolios and found that roughly one-third of actively managed equity and balanced funds used technical analysis in some form. It also found higher volatility among users, along with somewhat better benchmark-adjusted returns, especially in declining markets.
That is not the same as proving Magee's own signals beat the market. It is evidence that the family of techniques he helped codify became part of professional portfolio management. The honest conclusion is narrower and more useful: Magee did not leave a clean performance ledger, but he left a decision technology that later markets kept testing, modifying, and using.
The efficient-market objection
The most important criticism of Magee's approach comes from efficient-market theory. If prices already reflect available information and if past price movements cannot reliably forecast future returns after costs, then classical chart reading is at best descriptive and at worst superstition. Eugene Fama's 1970 review of efficient capital markets supplied the academic structure for that challenge, and the challenge remains central to any serious discussion of technical analysis.
Magee's answer would likely have been practical rather than theoretical. He did not need markets to be permanently inefficient in every respect. He needed supply and demand imbalances to appear in the price record before they were exhausted. He needed trends to persist long enough to be acted upon. He needed crowd behavior to repeat often enough that historical formations were not meaningless.
The efficient-market critique still matters because it attacks the technician's easiest temptation: believing that a named pattern is an edge by itself. Markets adapt. Transaction costs matter. False signals cluster. A trader who sees a head-and-shoulders pattern everywhere is not practicing Magee's discipline; he is practicing projection. The academic critique keeps the chartist honest by demanding evidence rather than folklore.
What the evidence says and does not say
Academic research has not delivered a simple verdict. Brock, Lakonishok, and LeBaron tested moving-average and trading-range-break rules on the Dow Jones Index from 1897 to 1986 and reported support for the technical strategies they examined. Their results suggested buy signals generated higher returns than sell signals and were difficult to reconcile with several null models. That paper became important because it treated technical trading rules as testable claims rather than as either folk wisdom or heresy.
Lo, Mamaysky, and Wang later approached the subject through pattern-recognition algorithms. Their 2000 NBER working paper acknowledged that charting had long been part of financial practice while suffering from subjectivity. They proposed an automatic approach using nonparametric kernel regression and found that several technical indicators provided incremental information over their 1962 to 1996 U.S. stock sample. The finding was supportive but measured: some patterns appeared to contain information, not magic.
The institutional-manager evidence is similarly nuanced. Smith, Faugere, and Wang found that managers using technical analysis showed slightly higher mean and median multi-factor alphas and better benchmark-adjusted returns, especially in falling markets, but also higher volatility and distinctive skewness and kurtosis. The modern case for Magee is not that every triangle works. It is that disciplined attention to price structure can improve behavior, timing, and risk response for some practitioners.
How Magee changed the profession
Magee's influence spread through people as much as through pages. W.H.C. Bassetti, later editor and coauthor of revised editions, became a client of Magee's advisory service in the 1960s and spent many hours discussing chart patterns and trading tactics with him. Bassetti's later work helped carry Magee's name into computerized markets, options analysis, futures, and university teaching.
Susan Berger's career shows another path of transmission. Hired in 1968 to chart stocks by hand, she absorbed the Edwards and Magee tradition through daily repetition. She later moved with the company after Magee sold it, then joined Fidelity, where she helped automate the firm's chart room and became a technical analyst. In that arc, Magee's hand-drawn craft entered a large investment institution and then a computerized workflow.
That is the deeper market change. Magee helped make charts professional. They were no longer only bucket-shop artifacts, newspaper curiosities, or speculative doodles. They became analytical tools that could be taught, staffed, sold, debated, automated, and incorporated into portfolio management. The technical analyst's desk, with its screens and scans, still owes something to the room where Magee's staff drew lines with rulers.
What remains dangerous now
The modern market is built to flatter Magee and to betray him. It flatters him because every investor now has instant access to charts, volume, moving averages, relative strength, screening tools, and pattern labels. It betrays him because abundance makes discipline harder. A trader can force a bullish formation onto one timeframe, find a bearish one on another, and call the result analysis.
The danger is not technical analysis itself. It is unstructured discretion disguised as technical analysis. Magee's framework required patience, confirmation, attention to volume, and respect for failure points. It was slow because the tools were slow, but slowness imposed standards. Today's trader can generate signals faster than judgment can evaluate them. That speed raises the cost of sloppy pattern recognition.
The useful inheritance is therefore behavioral. Magee's best lessons are to observe before opining, to define the level that proves the idea wrong, to avoid being panicked by news, and to understand that the market's verdict matters more than the trader's narrative. The dangerous inheritance is the belief that old formations guarantee future profits. The chart is a map of behavior, not a promise.
The disciplined skeptic's legacy
John Magee died in 1987 at age 86, but his work did not disappear with the analog tools that produced it. The Market Technicians Association formally recognized his contribution in 1978, and later technicians continued to describe him as a leading authority on classical charting. The phrase Edwards and Magee still functions as shorthand for a way of seeing markets through price structure before explanation.
His legacy is strongest when stated with restraint. He did not solve markets. He did not remove uncertainty. He did not leave proof that every pattern works or that news never matters. What he did was force traders to confront observable evidence, to distinguish trend from noise, and to translate visual judgment into action and risk limits. That is a serious achievement in a business where opinion often arrives before evidence.
The irony is that Magee's refusal to be distracted by facts was, at its best, a demand for a different kind of fact. Not the headline, not the rumor, not the persuasive story, but the transaction record itself. In that sense, Magee remains useful precisely because he was not offering comfort. He was asking the trader to look at the chart, decide what would constitute proof, and accept the answer when the market supplied it.
Disclosure
Educational financial journalism and market research only. Not financial, investment, trading, tax, or legal advice.