· Weekly signal · AAOI
Applied Opt (AAOI) suffers a 16.2% weekly break on above-average turnover
The reset cuts into a recent advance, but the stock still shows a 30.6% twelve-week gain and an active trend reading.
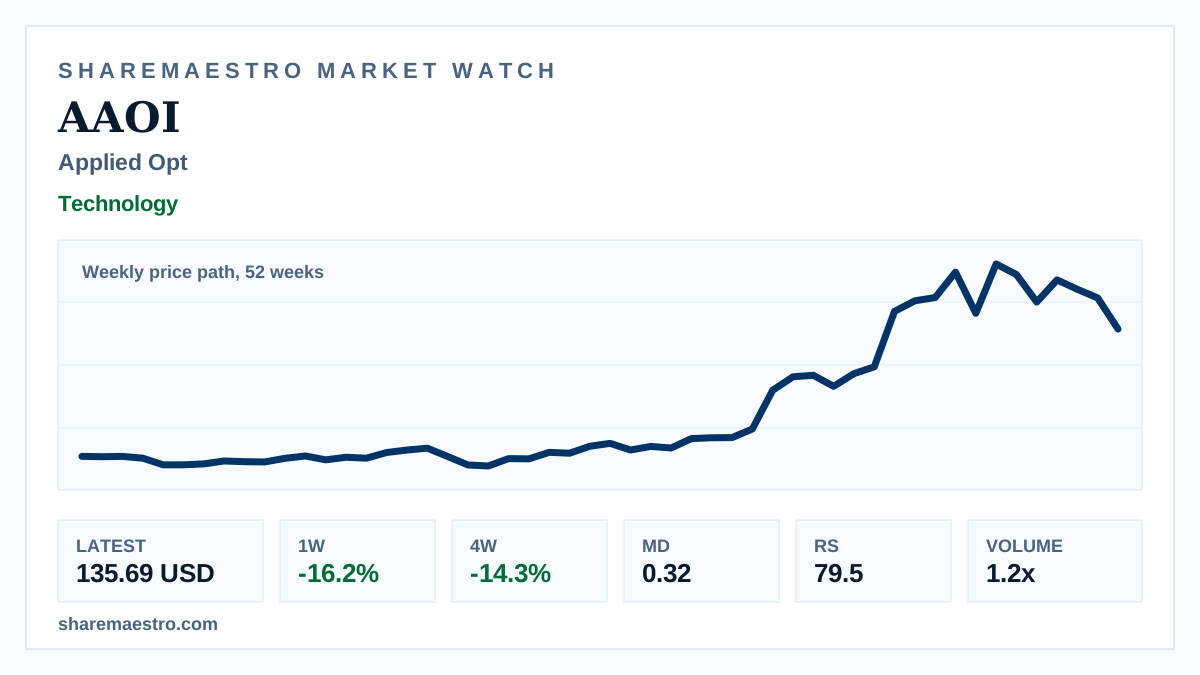
Applied Opt (AAOI) closed at 135.69 USD for the latest week, down -16.2% over one week and -14.3% over four weeks. The chart shows a weekly price path over 52 weeks, so the move is weekly context rather than live intraday action.
The evidence is mixed. Weekly volume of 72.2 million shares ran above the 62.1 million 13-week average, while Relative Strength remained elevated at 79.5 and the trend signal stayed active. Market Dynamics at 0.32 points to pressure, complicating the otherwise firm longer-window setup.