· Weekly signal · SNX
Synnex Corporation (SNX) puts an 81.5% twelve-week run on the weekly tape
The technology distributor remains in an active weekly trend, but participation and Relative Strength leave the setup less than one-sided.
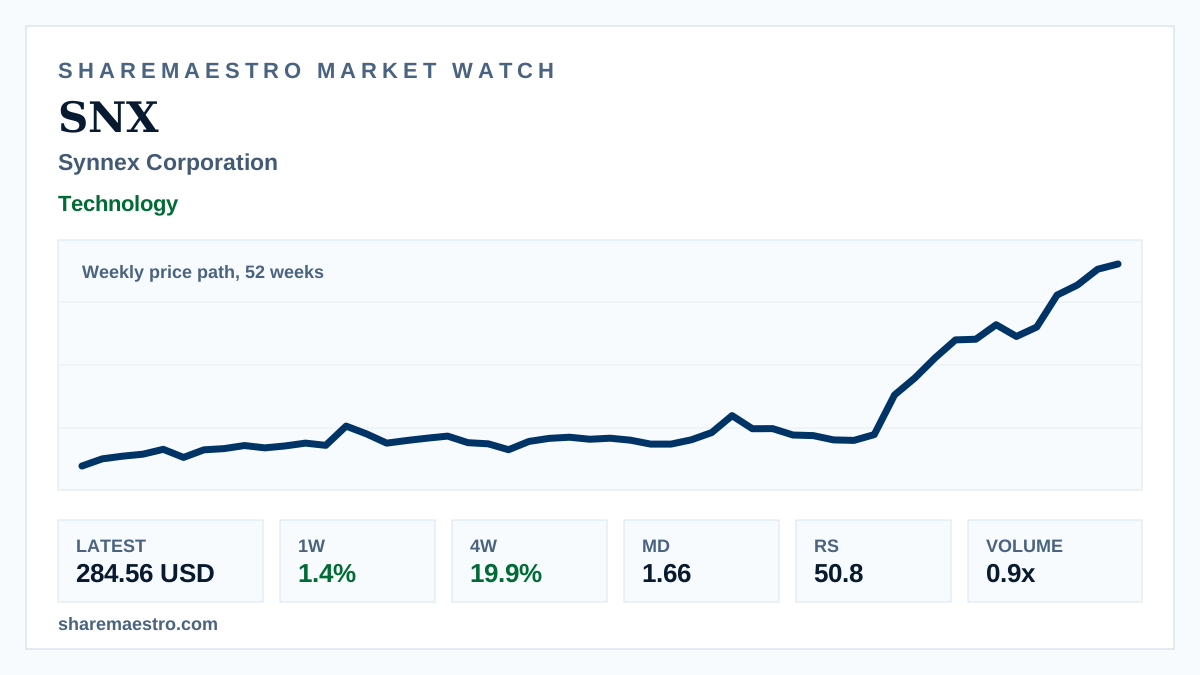
Synnex Corporation (SNX) closed the latest week at 284.56 USD, rising 1.4% in the week ended June 19. The weekly price path over 52 weeks shows the stock holding its broader advance rather than an intraday move.
Confirmation comes from an active trend state and Market Dynamics at 1.66. The evidence is mixed, with Relative Strength at 50.8 and latest volume below the 13-week average, suggesting momentum without unusually heavy participation.