· Weekly signal · VG
Venture Global, Inc. (VG) keeps active weekly trend after one-month surge
The Energy midstream stock’s weekly setup remains firm, though Market Dynamics still shows slight pressure.
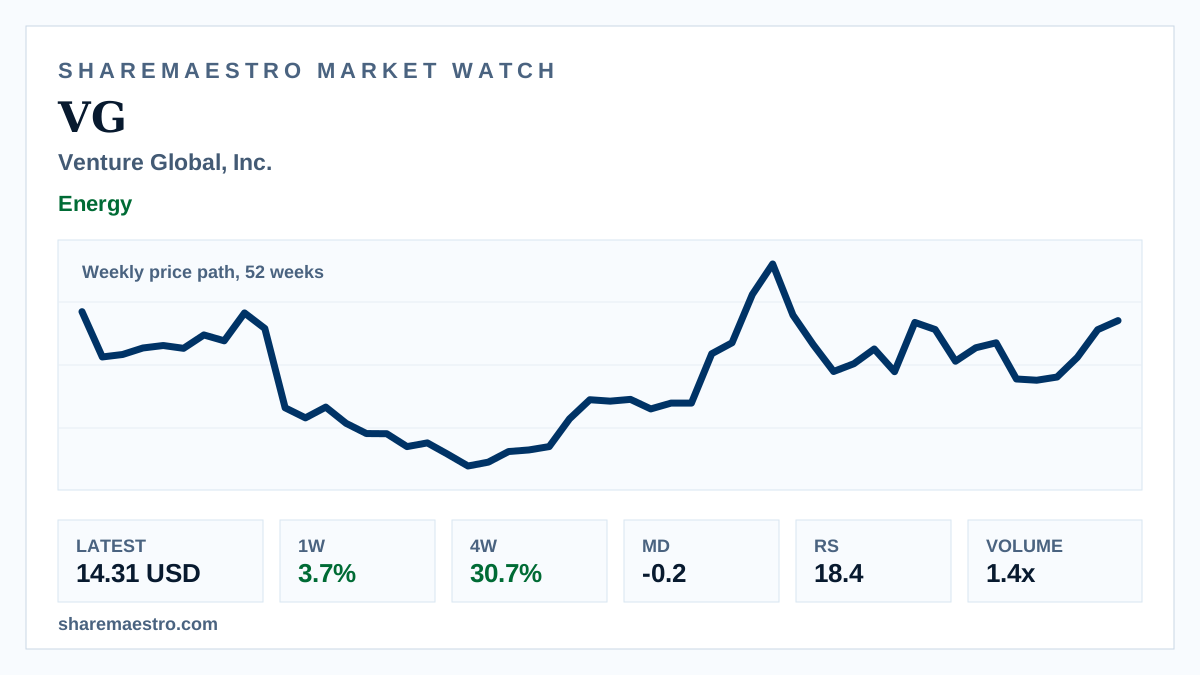
Venture Global, Inc. (VG) closed the latest week at $14.31, up 3.7% for the period. The chart shows a weekly price path over 52 weeks, with the stock in an active trend state after a 30.7% four-week rise.
Trading activity confirmed the move, with 106.6 million shares changing hands, about 1.36x the 13-week average. The evidence is not one-way: Market Dynamics showed slight pressure at -0.2, while Relative Strength stood at 18.4.