· Weekly signal · FIG
Figma, Inc. (FIG) weekly rebound runs ahead of trend confirmation
The latest weekly close improved the 12-week picture, while volume and trend readings left confirmation incomplete.
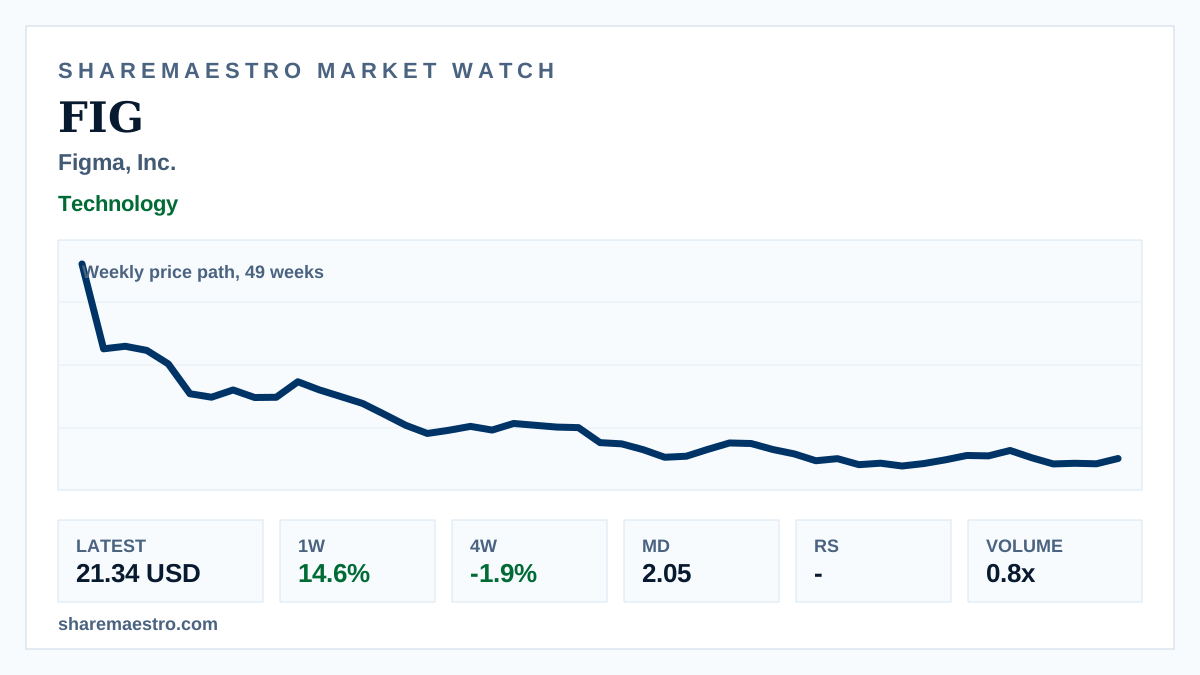
Figma, Inc. (FIG) closed the latest week at $21.34, rising 14.6% as the stock recovered from a -1.9% four-week move.
The chart shows a weekly price path over 49 weeks, so the setup is weekly context rather than live intraday action. Market Dynamics showed positive pressure at 2.05, but the trend signal remained inactive and Relative Strength was unavailable.
Trading activity was lighter than normal, with 77.7 million shares versus a 13-week average of 94.1 million. The separate intraday screen showed the stock at $22.72, up 1.4% from a $22.41 start on 232,873 shares.