· Weekly signal · FLEX
Flex Ltd (FLEX) four-week pullback reaches -2.7%
The weekly setup remains active, but recent returns have softened after a sharp three-month run in the electronic-components manufacturer.
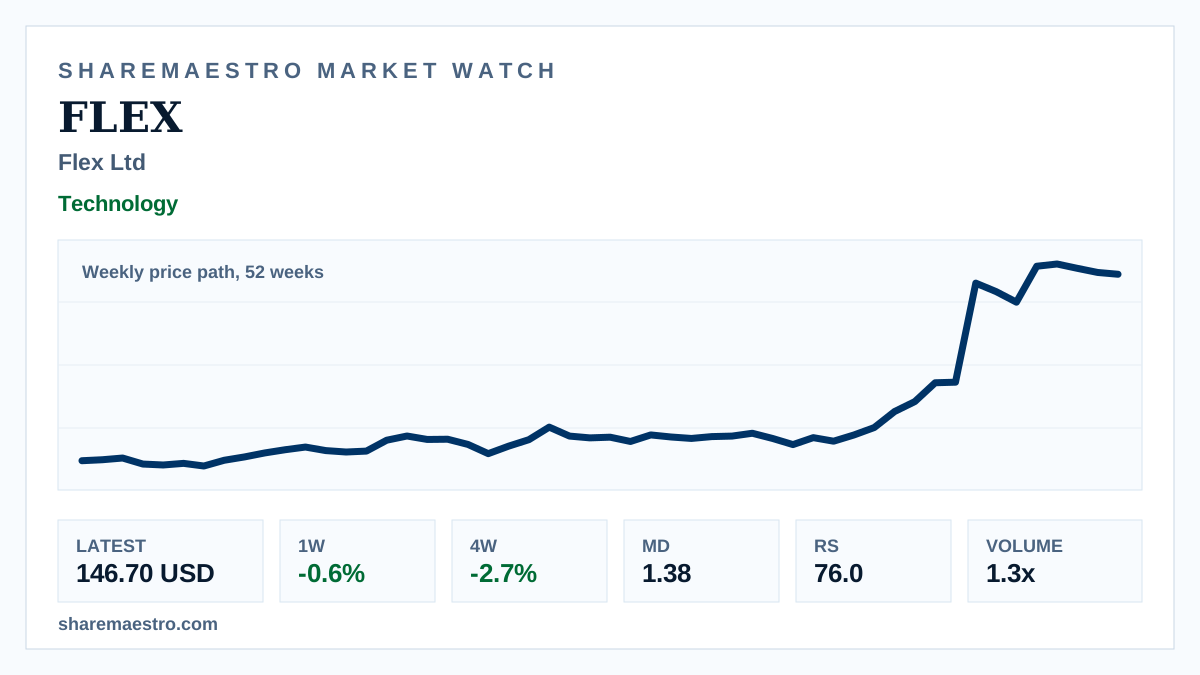
Flex Ltd (FLEX) closed the latest week at 146.70 USD, slipping -0.6% for the week as the stock extended a short-term pause. The visual context is a weekly price path over 52 weeks, not an intraday tape.
The broader move is still substantial, with a 113.9% twelve-week return, an active trend signal and Relative Strength at 76. Market Dynamics at 1.38 provides confirmation, while participation is mixed: latest volume was 40.7 million shares versus a 32.4 million 13-week average, but the weekly setup’s separate volume ratio sits at 0.4x.