Weekly signal · FLEX · Technology

Flex Ltd (FLEX) stalls after 142.9% 12-week climb

The electronic-components manufacturer’s weekly trend remains active, but the latest one-week decline adds a pause after a steep multiweek advance.

Latest149.71 USD
1W move-1.5%
Volume1.0x
TrendActive
Electronics manufacturing line with circuit boards and a market-data screen representing Flex Ltd market coverage.
Supporting market chart for Flex Ltd (FLEX) stalls after 142.9% 12-week climb

Market update

What happened

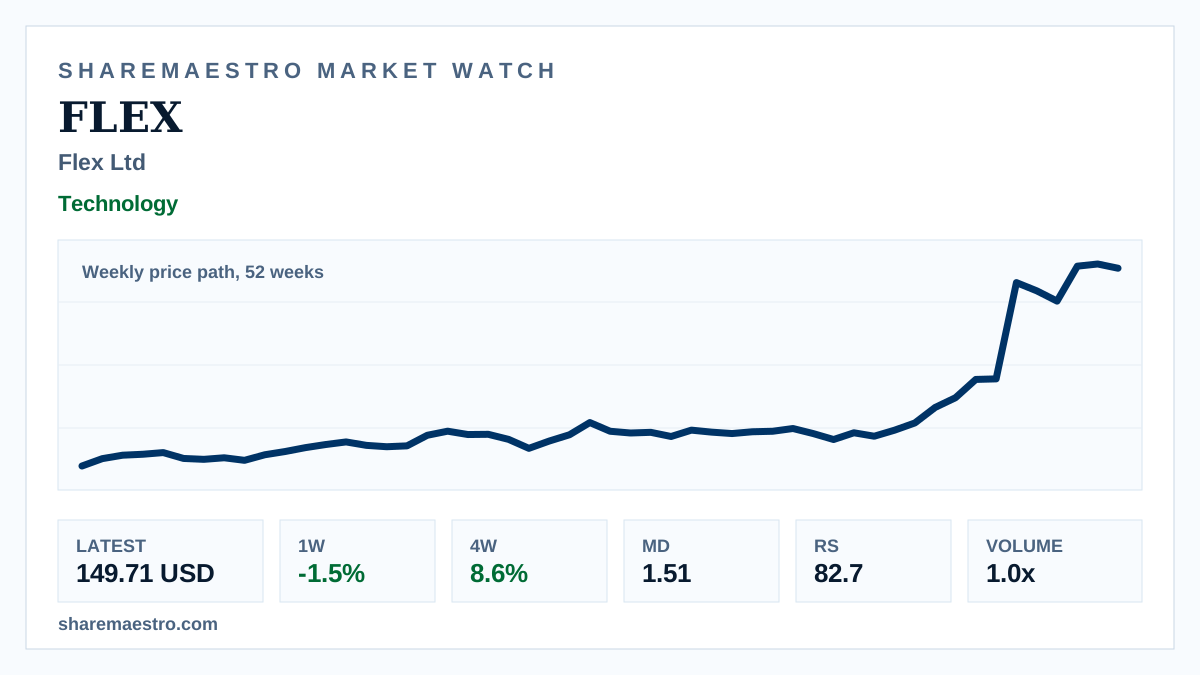
Flex Ltd (FLEX) fell 1.5% in the week ended June 12, closing at 149.71 USD. The 52-week weekly price path shows a strong broader advance, even as the latest week cooled from recent gains.

The confirming evidence remains firm: the trend signal is active, Relative Strength is 82.7, and Market Dynamics shows positive confirmation. The complication is positioning after a 142.9% twelve-week gain, with volume running close to its recent weekly average rather than showing a major turnover spike.

Continue your research

Explore FLEX across Sharemaestro

These links are shown because current Sharemaestro data is available for this company.

Evidence context