· Weekly signal · HUT
Hut 8 Corp. (HUT) weekly selloff tests active trend
The Bitcoin miner’s latest weekly context shows pressure on a still-active setup, with the longer rebound intact but less convincing near term.
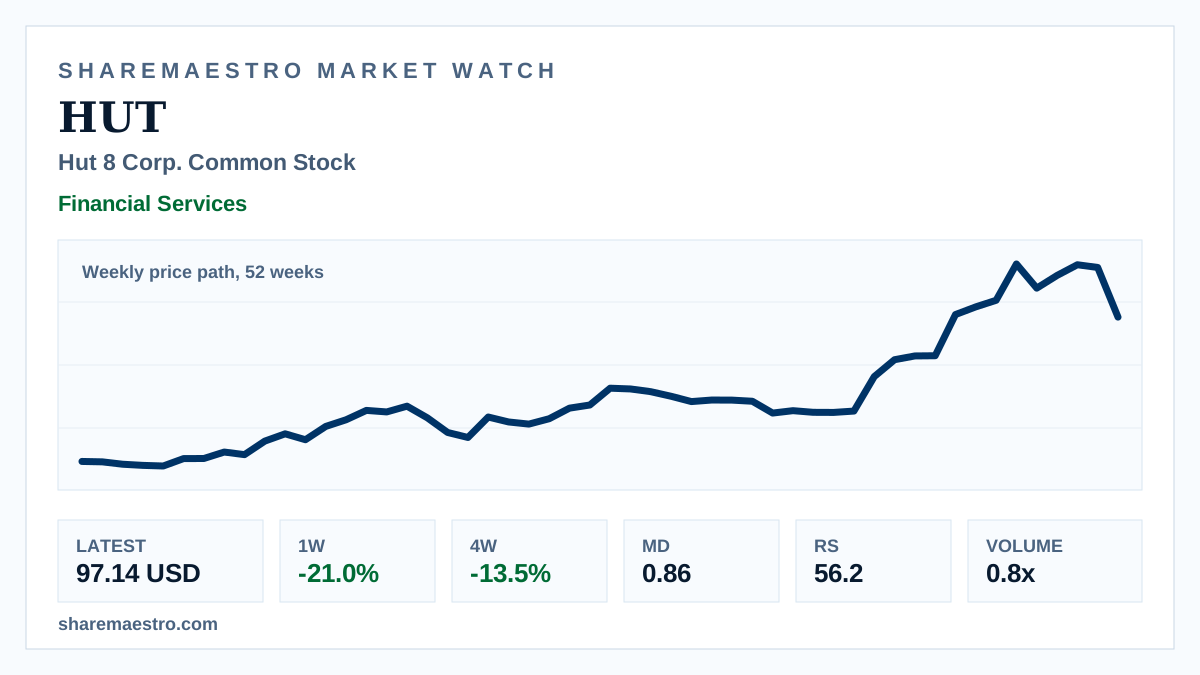
Hut 8 Corp. (HUT) closed the latest week at 97.14 USD as the 52-week weekly price path showed a sharp setback rather than intraday action.
The evidence is mixed. The trend signal remains active and Market Dynamics provided confirmation at 0.86, but turnover ran below its 13-week average. Relative Strength at 56.2 points to moderate leadership rather than a broad momentum breakout.