· Weekly signal · NBIS
Nebius Group N.V. (NBIS) snaps back in weekly context after steep one-week loss
The setback matters because the stock is still carrying a strong three-month advance, leaving momentum evidence mixed rather than cleanly broken.
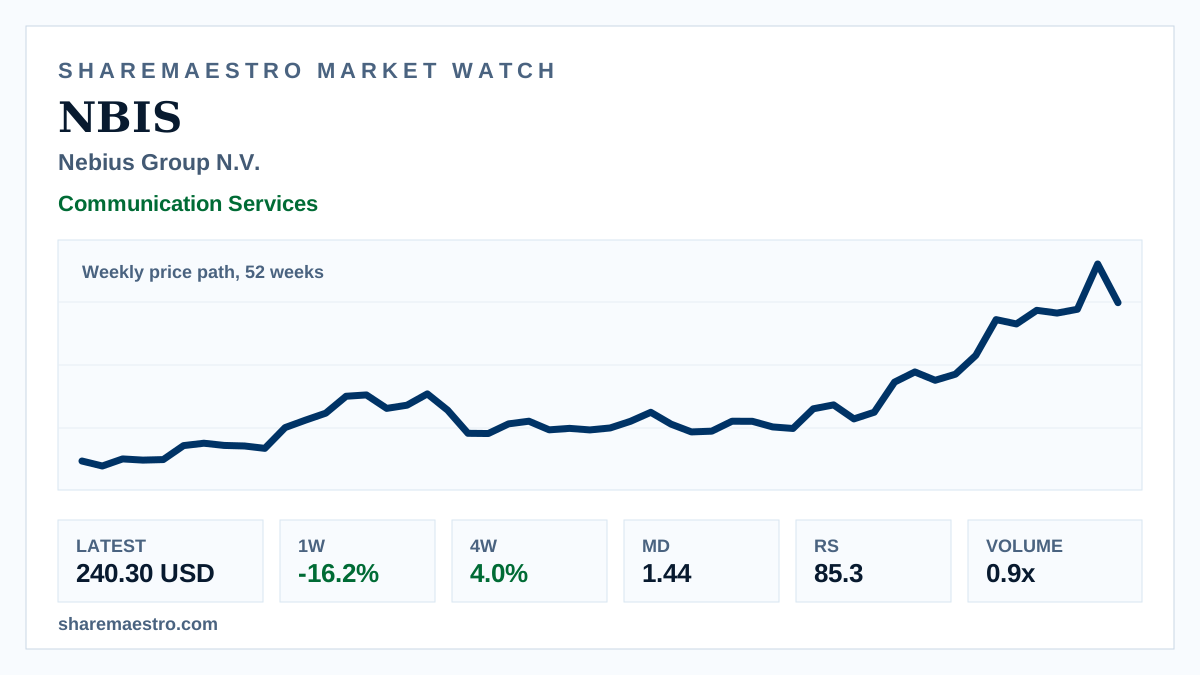
Nebius Group N.V. (NBIS) closed at 240.30 USD after losing 16.2% in the latest week, marking a sharp pullback on the weekly price path over 52 weeks.
The complication is that the longer tape remains firm: NBIS is still up 4.0% over four weeks and 120.8% over twelve weeks. The trend signal remains active, Relative Strength is 85.3, and Market Dynamics at 1.44 provides confirmation, while weekly turnover ran below its recent average.