· Weekly signal · OKTA
Okta Inc (OKTA) pullback meets an active weekly trend
The identity-software stock is easing after a sharp multiweek advance, making the next signals more about confirmation than fresh momentum.
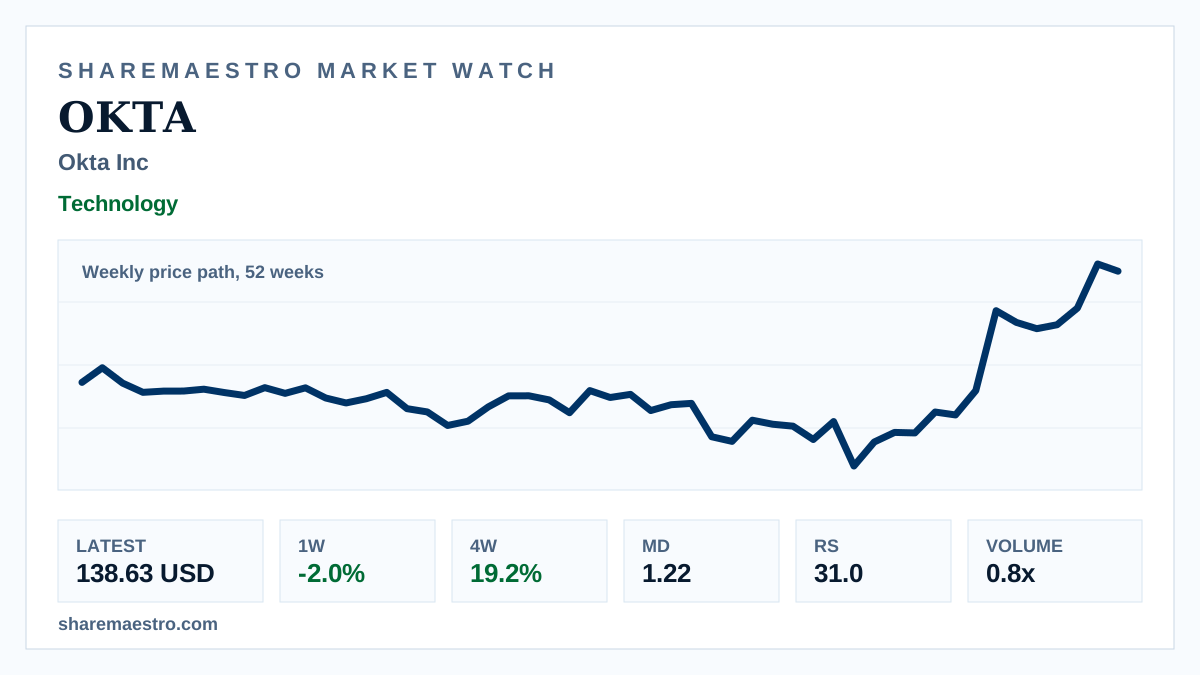
Okta Inc (OKTA) closed at 138.63 USD for the latest week, down -2.0% over one week while still up 19.2% over four weeks and 91.9% over twelve weeks.
The chart is a weekly price path over 52 weeks, so it frames the move as weekly context rather than live intraday action. The trend signal remains active, Market Dynamics shows 1.22 confirmation, and Relative Strength sits at 31.0, leaving the evidence supportive but not one-sided.
Volume evidence is mixed: the active-mover screen shows 1.2x volume, while weekly turnover of 15.4 million shares was below the 13-week average of 18.7 million.